The Fast Track to New Skills

Page 30

6

The Fast Track to New Skills

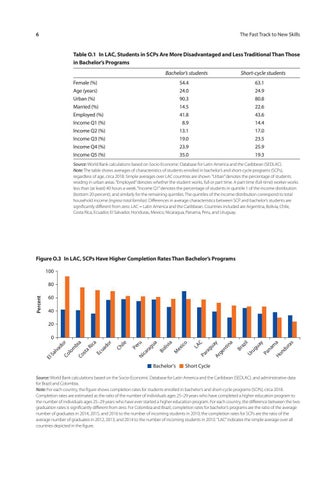
Table O.1  In LAC, Students in SCPs Are More Disadvantaged and Less Traditional Than Those in Bachelor’s Programs Bachelor’s students Female (%) Age (years) Urban (%) Married (%) Employed (%) Income Q1 (%) Income Q2 (%) Income Q3 (%) Income Q4 (%) Income Q5 (%)

Short-cycle students

54.4 24.0 90.3 14.5 41.8 8.9 13.1 19.0 23.9 35.0

63.1 24.9 80.8 22.6 43.6 14.4 17.0 23.5 25.9 19.3

Source: World Bank calculations based on Socio-Economic Database for Latin America and the Caribbean (SEDLAC). Note: The table shows averages of characteristics of students enrolled in bachelor’s and short-cycle programs (SCPs), regardless of age, circa 2018. Simple averages over LAC countries are shown. “Urban” denotes the percentage of students residing in urban areas. “Employed” denotes whether the student works, full or part time. A part-time (full-time) worker works less than (at least) 40 hours a week. “Income Q1” denotes the percentage of students in quintile 1 of the income distribution (bottom 20 percent), and similarly for the remaining quintiles. The quintiles of the income distribution correspond to total household income (ingreso total familiar). Differences in average characteristics between SCP and bachelor’s students are significantly different from zero. LAC = Latin America and the Caribbean. Countries included are Argentina, Bolivia, Chile, Costa Rica, Ecuador, El Salvador, Honduras, Mexico, Nicaragua, Panama, Peru, and Uruguay.

Figure O.3  In LAC, SCPs Have Higher Completion Rates Than Bachelor’s Programs 100

Percent

80 60 40 20

Bachelor’s

as

Ho

nd

ur

m

a

y

na Pa

il

ug ua

az

Ur

a tin

Br

y ge n

gu a

Ar

Pa

ra

LA C

o ex ic

ia

M

liv

a

Bo

gu

ru

ra ca

Pe

Ni

r

ile Ch

do ua

ica

Ec

a

aR

bi

st Co

m lo

Co

El S

al va

do

r

0

Short Cycle

Source: World Bank calculations based on the Socio-Economic Database for Latin America and the Caribbean (SEDLAC). and administrative data for Brazil and Colombia. Note: For each country, the figure shows completion rates for students enrolled in bachelor’s and short-cycle programs (SCPs), circa 2018. Completion rates are estimated as the ratio of the number of individuals ages 25–29 years who have completed a higher education program to the number of individuals ages 25–29 years who have ever started a higher education program. For each country, the difference between the two graduation rates is significantly different from zero. For Colombia and Brazil, completion rates for bachelor’s programs are the ratio of the average number of graduates in 2014, 2015, and 2016 to the number of incoming students in 2010; the completion rates for SCPs are the ratio of the average number of graduates in 2012, 2013, and 2014 to the number of incoming students in 2010. ”LAC” indicates the simple average over all countries depicted in the figure.

Turn static files into dynamic content formats.

Create a flipbook

Articles inside

References

8min
pages 211-217

Notes

2min
page 210

5.7 Flexible Academic Pathways in the United States

7min
pages 204-206

5.6 Oversight and Regulation Reform: Recent Attempts in LAC

2min
page 202

Skill Development Pathways

2min
page 203

Institutions in the United States

2min
page 201

Funding

4min
pages 195-196

Oversight and Regulation

7min
pages 198-200

5.3 What Do We Know about Information Interventions?

4min
pages 193-194

Information

5min
pages 191-192

Education in LAC

2min
page 190

Education Markets?

5min
pages 188-189

4.3 Quality Determinants and Value Added: The Case of Brazil

5min
pages 170-171

References

4min
pages 181-184

Notes

4min
pages 179-180

Graduates’ Wages

2min
page 169

4A.2 Summary of Results B5.4.1 Net Present Value of SCPs, from the Policy

1min
page 176

Formal Employment

4min
pages 167-168

Extra Time to Degree

4min
pages 165-166

A LASSO-Regression Approach

5min
pages 162-163

Dropout Rates

1min
page 164

and Student Outcomes

2min
page 161

SCPs in Colombia

9min
pages 157-160

4.1 Student Academic Outcomes, by Country

2min
page 152

Defining and Measuring SCP Quality

4min
pages 150-151

References

1min
page 146

Notes

2min
page 145

Conclusions

2min
page 144

3.2 Two Market Paradigms: Colombia and Chile

2min
page 120

3.23 Activities to Support Students’ Job Search

2min
page 141

Notes

4min
pages 111-112

Conclusions

2min
page 110

References

5min
pages 113-116

by Country

2min
page 107

Overall and by Field of Study

2min
page 105

Contribution (Value Added) of SCPs Demand for SCP Graduates: Exploiting

2min
page 103

Expanding the Supply of SCPs: Who Would Benefit and Why?

5min
pages 100-101

2.4 Estimating Value Added

2min
page 104

Economic Value of SCPs in LAC

2min
page 89

2.2 Estimating Mincerian Returns

2min
page 90

What Do We Know?

7min
pages 86-88

2.1 Sources of Information

4min
pages 84-85

References

1min
page 82

Conclusions

2min
page 76

Critical Institutional Aspect: Funding

2min
page 68

Notes

4min
pages 80-81

and of High School Graduates, circa 2018

4min
pages 65-66

1.2 Fundamental Data Source: SEDLAC

5min
pages 62-64

circa 2018

2min
page 67

1.1 Short-Cycle Programs in the United States and Germany

2min
page 60

Framework of the Book

2min
page 53

O.1 In LAC, Students in SCPs Are More Disadvantaged and Less Traditional Than Those in Bachelor’s Programs

2min
page 30

Policy to Realize the Potential of SCPs

4min
pages 43-44

I.1 Some Technical Aspects of the World Bank Short-Cycle Program Survey

2min
page 51

World Bank Short-Cycle Program Survey

2min
page 50

O.4 On Average, SCPs in LAC Have Good Curriculum, Infrastructure, and Faculty—but with Much Variation

4min
pages 39-40

BI1.1 Universes, Samples, and Response Rates, by Country

2min
page 52

Introduction

4min
pages 47-48
Issuu converts static files into: digital portfolios, online yearbooks, online catalogs, digital photo albums and more. Sign up and create your flipbook.