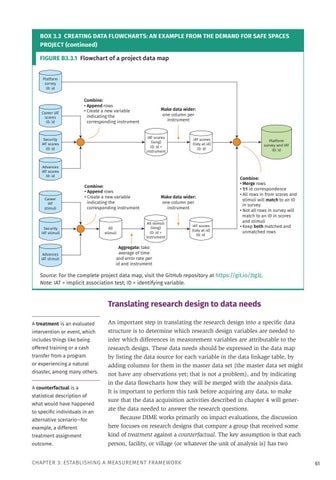
BOX 3.3 CREATING DATA FLOWCHARTS: AN EXAMPLE FROM THE DEMAND FOR SAFE SPACES PROJECT (continued) FIGURE B3.3.1 Flowchart of a project data map Platform survey ID: id
Career IAT scores ID: id
Combine: • Append rows • Create a new variable indicating the corresponding instrument
Make data wider: one column per instrument
IAT scores (long) ID: id + instrument
Security IAT scores ID: id
IAT scores (tidy at id) ID: id
Advances IAT scores ID: id
Career IAT stimuli
Combine: • Append rows • Create a new variable indicating the corresponding instrument
Security IAT stimuli
Advances IAT stimuli
All stimuli
Make data wider: one column per instrument All stimuli (long) ID: id + instrument
IAT scores (tidy at id) ID: id
Platform survey and IAT ID: id
Combine: • Merge rows • 1:1 id correspondence • All rows in from scores and stimuli will match to an ID in survey • Not all rows in survey will match to an ID in scores and stimuli • Keep both matched and unmatched rows
Aggregate: take average of time and error rate per id and instrument
Source: For the complete project data map, visit the GitHub repository at https://git.io/Jtg3J. Note: IAT = implicit association test; ID = identifying variable.
Translating research design to data needs A treatment is an evaluated intervention or event, which includes things like being offered training or a cash transfer from a program or experiencing a natural disaster, among many others. A counterfactual is a statistical description of what would have happened to specific individuals in an alternative scenario—for example, a different treatment assignment outcome.
An important step in translating the research design into a specific data structure is to determine which research design variables are needed to infer which differences in measurement variables are attributable to the research design. These data needs should be expressed in the data map by listing the data source for each variable in the data linkage table, by adding columns for them in the master data set (the master data set might not have any observations yet; that is not a problem), and by indicating in the data flowcharts how they will be merged with the analysis data. It is important to perform this task before acquiring any data, to make sure that the data acquisition activities described in chapter 4 will generate the data needed to answer the research questions. Because DIME works primarily on impact evaluations, the discussion here focuses on research designs that compare a group that received some kind of treatment against a counterfactual. The key assumption is that each person, facility, or village (or whatever the unit of analysis is) has two
Chapter 3: Establishing a measurement framework
61


