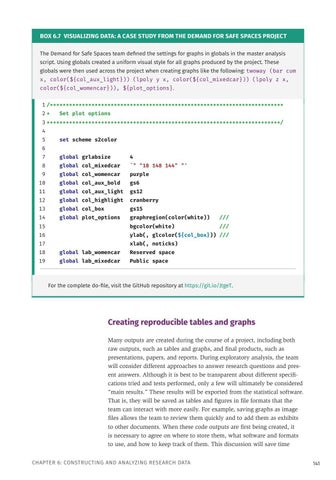
BOX 6.7 VISUALIZING DATA: A CASE STUDY FROM THE DEMAND FOR SAFE SPACES PROJECT The Demand for Safe Spaces team defined the settings for graphs in globals in the master analysis script. Using globals created a uniform visual style for all graphs produced by the project. These globals were then used across the project when creating graphs like the following: twoway (bar cum x, color(${col_aux_light})) (lpoly y x, color(${col_mixedcar})) (lpoly z x, color(${col_womencar})), ${plot_options}. 1 /************************************************************************* 2 *
Set plot options
3 *************************************************************************/ 4 5
set scheme s2color
6 7
global grlabsize
4
8
global col_mixedcar
`" "18 148 144" "'
9
global col_womencar
purple
10
global col_aux_bold
gs6
11
global col_aux_light
gs12
12
global col_highlight
cranberry
13
global col_box
gs15
14
global plot_options
graphregion(color(white))
///
15
bgcolor(white)
///
16
ylab(, glcolor(${col_box})) ///
17
xlab(, noticks)
18
global lab_womencar
Reserved space
19
global lab_mixedcar
Public space
For the complete do-file, visit the GitHub repository at https://git.io/JtgeT.
Creating reproducible tables and graphs Many outputs are created during the course of a project, including both raw outputs, such as tables and graphs, and final products, such as presentations, papers, and reports. During exploratory analysis, the team will consider different approaches to answer research questions and present answers. Although it is best to be transparent about different specifications tried and tests performed, only a few will ultimately be considered “main results.” These results will be exported from the statistical software. That is, they will be saved as tables and figures in file formats that the team can interact with more easily. For example, saving graphs as image files allows the team to review them quickly and to add them as exhibits to other documents. When these code outputs are first being created, it is necessary to agree on where to store them, what software and formats to use, and how to keep track of them. This discussion will save time CHAPTER 6: CONSTRUCTING AND ANALYZING RESEARCH DATA
141


