Development Research in Practice

Page 128

BOX 5.3 TIDYING DATA: A CASE STUDY FROM THE DEMAND FOR SAFE SPACES PROJECT The unit of observation in an original data set does not always match the relevant unit of analysis for a study. One of the first steps required is to create data sets at the unit of analysis desired. In the case of the crowdsourced ride data used in the Demand for Safe Spaces project, study participants were asked to complete three tasks in each metro trip: one before boarding the train (check-in task), one during the ride (ride task), and one after leaving the train (check-out task). The raw data sets show one task per row. As a result, each unit of analysis, a metro trip, was described in three rows in this data set. To create a data set at the trip level, the research team took two steps, outlined in the data flowchart (for an example of how data flowcharts can be created, see box 3.3 in chapter 3). First, three separate data sets were created, one for each task, containing only the variables and observations created during that task. Then the trip-level data set was created by combining the variables in the data tables for each task at the level of the individual trip (identified by the session variable).

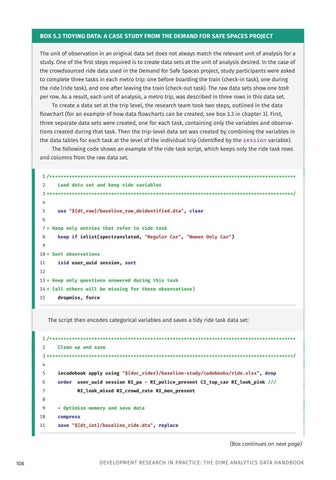
The following code shows an example of the ride task script, which keeps only the ride task rows

and columns from the raw data set. 1 /**************************************************************************************** 2

Load data set and keep ride variables

3 ****************************************************************************************/ 4 5

use "${dt_raw}/baseline_raw_deidentified.dta", clear

6 7 * Keep only entries that refer to ride task 8

keep if inlist(spectranslated, "Regular Car", "Women Only Car")

9 10 * Sort observations 11

isid user_uuid session, sort

12 13 * Keep only questions answered during this task 14 * (all others will be missing for these observations) 15

dropmiss, force

The script then encodes categorical variables and saves a tidy ride task data set: 1 /**************************************************************************************** 2

Clean up and save

3 ****************************************************************************************/ 4 5

iecodebook apply using "${doc_rider}/baseline-study/codebooks/ride.xlsx", drop

6

order

7

user_uuid session RI_pa - RI_police_present CI_top_car RI_look_pink /// RI_look_mixed RI_crowd_rate RI_men_present

8 9

* Optimize memory and save data

10

compress

11

save "${dt_int}/baseline_ride.dta", replace

(Box continues on next page) 108

DEVELOPMENT RESEARCH IN PRACTICE: THE DIME ANALYTICS DATA HANDBOOK


Turn static files into dynamic content formats.

Create a flipbook

Articles inside

Appendix C: Research design for impact evaluation

33min
pages 215-231

Appendix A: The DIME Analytics Coding Guide

24min
pages 195-210

Appendix B: DIME Analytics resource directory

3min
pages 211-214

8.1 Research data work outputs

6min
pages 190-194

Chapter 8: Conclusion

1min
page 189

7.4 Releasing a reproducibility package: A case study from the Demand for Safe Spaces project

3min
pages 184-186

7.1 Summary: Publishing reproducible research outputs

8min
pages 172-175

7.3 Publishing research data sets: A case study from the Demand for Safe Spaces project

10min
pages 180-183

7.2 Publishing research papers and reports: A case study from the Demand for Safe Spaces project

8min
pages 176-179

Chapter 7: Publishing reproducible research outputs

1min
page 171

6.1 Data analysis tasks and outputs

3min
pages 168-170

6.8 Managing outputs: A case study from the Demand for Safe Spaces project

10min
pages 163-167

6.7 Visualizing data: A case study from the Demand for Safe Spaces project

4min
pages 161-162

6.6 Organizing analysis code: A case study from the Demand for Safe Spaces project

4min
pages 159-160

6.5 Writing analysis code: A case study from the Demand for Safe Spaces project

3min
pages 157-158

6.4 Documenting variable construction: A case study from the Demand for Safe Spaces project

4min
pages 155-156

6.3 Creating analysis variables: A case study from the Demand for Safe Spaces project

1min
page 154

6.2 Integrating multiple data sources: A case study from the Demand for Safe Spaces project

9min
pages 150-153

6.1 Summary: Constructing and analyzing research data

10min
pages 146-149

Chapter 6: Constructing and analyzing research data

1min
page 145

5.7 Recoding and annotating data: A case study from the Demand for Safe Spaces project

3min
pages 140-141

5.6 Correcting data points: A case study from the Demand for Safe Spaces project

4min
pages 138-139

5.5 Implementing de-identification: A case study from the Demand for Safe Spaces project

9min
pages 134-137

5.1 Summary: Cleaning and processing research data

7min
pages 122-124

5.4 Assuring data quality: A case study from the Demand for Safe Spaces project

7min
pages 131-133

5.3 Tidying data: A case study from the Demand for Safe Spaces project

7min
pages 128-130

5.2 Establishing a unique identifier: A case study from the Demand for Safe Spaces project

7min
pages 125-127

Chapter 5: Cleaning and processing research data

1min
page 121

B4.4.1 A sample dashboard of indicators of progress

12min
pages 113-117

4.4 Checking data quality in real time: A case study from the Demand for Safe Spaces project

2min
page 112

4.3 Piloting survey instruments: A case study from the Demand for Safe Spaces project

14min
pages 106-111

4.2 Determining data ownership: A case study from the Demand for Safe Spaces project

16min
pages 100-105

B3.3.1 Flowchart of a project data map

37min
pages 81-96

B2.3.1 Folder structure of the Demand for Safe Spaces data work

36min
pages 55-72

Chapter 4: Acquiring development data

5min
pages 97-99

Chapter 3: Establishing a measurement framework

18min
pages 73-80

Chapter 1: Conducting reproducible, transparent, and credible research

35min
pages 31-46

Chapter 2: Setting the stage for effective and efficient collaboration

18min
pages 47-54

I.1 Overview of the tasks involved in development research data work

18min
pages 22-30

Introduction

2min
page 21
Issuu converts static files into: digital portfolios, online yearbooks, online catalogs, digital photo albums and more. Sign up and create your flipbook.