Development Research in Practice

Page 113

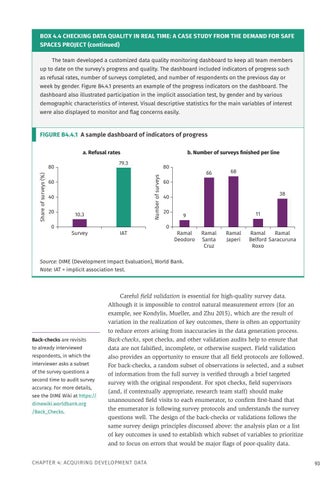
BOX 4.4 CHECKING DATA QUALITY IN REAL TIME: A CASE STUDY FROM THE DEMAND FOR SAFE SPACES PROJECT (continued) The team developed a customized data quality monitoring dashboard to keep all team members up to date on the survey’s progress and quality. The dashboard included indicators of progress such as refusal rates, number of surveys completed, and number of respondents on the previous day or week by gender. Figure B4.4.1 presents an example of the progress indicators on the dashboard. The dashboard also illustrated participation in the implicit association test, by gender and by various demographic characteristics of interest. Visual descriptive statistics for the main variables of interest were also displayed to monitor and flag concerns easily.

FIGURE B4.4.1  A sample dashboard of indicators of progress a. Refusal rates 79.3

60 40

0

10.3 Survey

80 Number of surveys

Share of surveys (%)

80

20

b. Number of surveys finished per line

IAT

66

68

60 38

40 20 0

11

9 Ramal Deodoro

Ramal Santa Cruz

Ramal Japeri

Ramal Ramal Belford Saracuruna Roxo

Source: DIME (Development Impact Evaluation), World Bank. Note: IAT = implicit association test.

Back-checks are revisits to already interviewed respondents, in which the interviewer asks a subset of the survey questions a second time to audit survey accuracy. For more details, see the DIME Wiki at https:// dimewiki.worldbank.org​ /Back_Checks.

Careful field validation is essential for high-quality survey data. Although it is impossible to control natural measurement errors (for an example, see Kondylis, Mueller, and Zhu 2015), which are the result of variation in the realization of key outcomes, there is often an opportunity to reduce errors arising from inaccuracies in the data generation process. ­Back-checks, spot checks, and other validation audits help to ensure that data are not falsified, incomplete, or otherwise suspect. Field validation also provides an opportunity to ensure that all field protocols are followed. For back-checks, a random subset of observations is selected, and a subset of information from the full survey is verified through a brief targeted survey with the original respondent. For spot checks, field supervisors (and, if contextually appropriate, research team staff) should make unannounced field visits to each enumerator, to confirm first-hand that the enumerator is following survey protocols and understands the survey questions well. The design of the back-checks or validations follows the same survey design principles discussed above: the analysis plan or a list of key outcomes is used to establish which subset of variables to prioritize and to focus on errors that would be major flags of poor-quality data.

CHAPTER 4: ACQUIRING DEVELOPMENT DATA

93


Turn static files into dynamic content formats.

Create a flipbook

Articles inside

Appendix C: Research design for impact evaluation

33min
pages 215-231

Appendix A: The DIME Analytics Coding Guide

24min
pages 195-210

Appendix B: DIME Analytics resource directory

3min
pages 211-214

8.1 Research data work outputs

6min
pages 190-194

Chapter 8: Conclusion

1min
page 189

7.4 Releasing a reproducibility package: A case study from the Demand for Safe Spaces project

3min
pages 184-186

7.1 Summary: Publishing reproducible research outputs

8min
pages 172-175

7.3 Publishing research data sets: A case study from the Demand for Safe Spaces project

10min
pages 180-183

7.2 Publishing research papers and reports: A case study from the Demand for Safe Spaces project

8min
pages 176-179

Chapter 7: Publishing reproducible research outputs

1min
page 171

6.1 Data analysis tasks and outputs

3min
pages 168-170

6.8 Managing outputs: A case study from the Demand for Safe Spaces project

10min
pages 163-167

6.7 Visualizing data: A case study from the Demand for Safe Spaces project

4min
pages 161-162

6.6 Organizing analysis code: A case study from the Demand for Safe Spaces project

4min
pages 159-160

6.5 Writing analysis code: A case study from the Demand for Safe Spaces project

3min
pages 157-158

6.4 Documenting variable construction: A case study from the Demand for Safe Spaces project

4min
pages 155-156

6.3 Creating analysis variables: A case study from the Demand for Safe Spaces project

1min
page 154

6.2 Integrating multiple data sources: A case study from the Demand for Safe Spaces project

9min
pages 150-153

6.1 Summary: Constructing and analyzing research data

10min
pages 146-149

Chapter 6: Constructing and analyzing research data

1min
page 145

5.7 Recoding and annotating data: A case study from the Demand for Safe Spaces project

3min
pages 140-141

5.6 Correcting data points: A case study from the Demand for Safe Spaces project

4min
pages 138-139

5.5 Implementing de-identification: A case study from the Demand for Safe Spaces project

9min
pages 134-137

5.1 Summary: Cleaning and processing research data

7min
pages 122-124

5.4 Assuring data quality: A case study from the Demand for Safe Spaces project

7min
pages 131-133

5.3 Tidying data: A case study from the Demand for Safe Spaces project

7min
pages 128-130

5.2 Establishing a unique identifier: A case study from the Demand for Safe Spaces project

7min
pages 125-127

Chapter 5: Cleaning and processing research data

1min
page 121

B4.4.1 A sample dashboard of indicators of progress

12min
pages 113-117

4.4 Checking data quality in real time: A case study from the Demand for Safe Spaces project

2min
page 112

4.3 Piloting survey instruments: A case study from the Demand for Safe Spaces project

14min
pages 106-111

4.2 Determining data ownership: A case study from the Demand for Safe Spaces project

16min
pages 100-105

B3.3.1 Flowchart of a project data map

37min
pages 81-96

B2.3.1 Folder structure of the Demand for Safe Spaces data work

36min
pages 55-72

Chapter 4: Acquiring development data

5min
pages 97-99

Chapter 3: Establishing a measurement framework

18min
pages 73-80

Chapter 1: Conducting reproducible, transparent, and credible research

35min
pages 31-46

Chapter 2: Setting the stage for effective and efficient collaboration

18min
pages 47-54

I.1 Overview of the tasks involved in development research data work

18min
pages 22-30

Introduction

2min
page 21
Issuu converts static files into: digital portfolios, online yearbooks, online catalogs, digital photo albums and more. Sign up and create your flipbook.
Development Research in Practice by World Bank Publications - Issuu