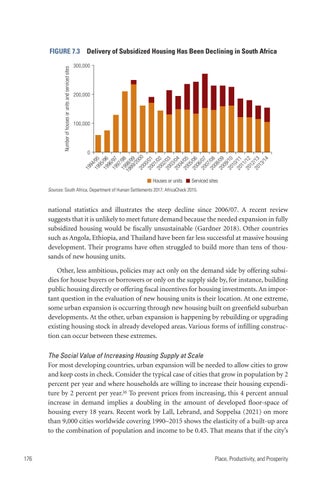
Delivery of Subsidized Housing Has Been Declining in South Africa
300,000
200,000
100,000
0
19 94 19 /95 95 19 /96 96 19 /97 97 19 /98 19 98/ 99 99 /2 0 20 00 00 20 /01 01 20 /02 02 20 /03 03 20 /04 04 20 /05 05 20 /06 06 20 /07 07 20 /08 08 20 /09 09 20 /10 10 20 /11 11 20 /12 12 20 /13 13 /1 4
Number of houses or units and serviced sites
FIGURE 7.3
Houses or units
Serviced sites
Sources: South Africa, Department of Human Settlements 2017; AfricaCheck 2015.
national statistics and illustrates the steep decline since 2006/07. A recent review suggests that it is unlikely to meet future demand because the needed expansion in fully subsidized housing would be fiscally unsustainable (Gardner 2018). Other countries such as Angola, Ethiopia, and Thailand have been far less successful at massive housing development. Their programs have often struggled to build more than tens of thousands of new housing units. Other, less ambitious, policies may act only on the demand side by offering subsidies for house buyers or borrowers or only on the supply side by, for instance, building public housing directly or offering fiscal incentives for housing investments. An important question in the evaluation of new housing units is their location. At one extreme, some urban expansion is occurring through new housing built on greenfield suburban developments. At the other, urban expansion is happening by rebuilding or upgrading existing housing stock in already developed areas. Various forms of infilling construction can occur between these extremes. The Social Value of Increasing Housing Supply at Scale For most developing countries, urban expansion will be needed to allow cities to grow and keep costs in check. Consider the typical case of cities that grow in population by 2 percent per year and where households are willing to increase their housing expenditure by 2 percent per year.16 To prevent prices from increasing, this 4 percent annual increase in demand implies a doubling in the amount of developed floor-space of housing every 18 years. Recent work by Lall, Lebrand, and Soppelsa (2021) on more than 9,000 cities worldwide covering 1990–2015 shows the elasticity of a built-up area to the combination of population and income to be 0.45. That means that if the city’s
176
Place, Productivity, and Prosperity
