If, for instance, the project will lead to rail freight flows of 300 and to passenger flows of 100—both from a zero baseline, then this rail freight will come partly from a diversion on the same route from road to rail, partly from a diversion from another rail route further to the north, and partly from the creation of new trips. To keep the analysis of the South Trans-Andean Railway in Argentina simple, the computations assume that rail passenger flows are all pure diversions from road transport and that the project will increase congestion around Neuquén. Table 7.1 provides quantity changes for these three alternative types of routes, based on these assumptions. Valuing Quality Changes. Valuation requires details on how the new service will create time savings and change other costs of travel. These changes will vary depending on the type of flow (diverted from another mode on the same route, from another route, and so on). These costs include the following: ■ ■
■ ■
■
The value of time for passenger transport A generalized measure of freight transport costs, including driver salaries, the cost of trucks, and so on Potential improvements in reliability Accounting for other nonmarketed outputs such as changes in carbon dioxide (CO2) emissions and in safety Possible changes in pricing power by the freight industry.
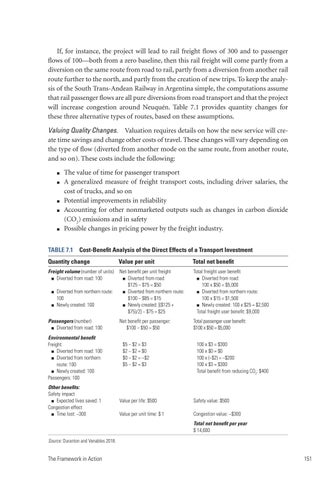
TABLE 7.1
Cost-Benefit Analysis of the Direct Effects of a Transport Investment
Quantity change
Value per unit
Total net benefit
Freight volume (number of units) ■ Diverted from road: 100
Net benefit per unit freight ■ Diverted from road: $125 − $75 = $50 ■ Diverted from northern route: $100 − $85 = $15 ■ Newly created: [($125 + $75)/2] − $75 = $25
Total freight user benefit ■ Diverted from road: 100 x $50 = $5,000 ■ Diverted from northern route: 100 x $15 = $1,500 ■ Newly created: 100 x $25 = $2,500 Total freight user benefit: $9,000
Net benefit per passenger: $100 − $50 = $50
Total passenger user benefit: $100 x $50 = $5,000
Diverted from northern route: 100 ■ Newly created: 100 ■
Passengers (number) ■ Diverted from road: 100 Environmental benefit Freight: ■ Diverted from road: 100 ■ Diverted from northern route: 100 ■ Newly created: 100 Passengers: 100 Other benefits: Safety impact ■ Expected lives saved: 1 Congestion effect ■ Time lost: −300
$5 − $2 = $3 $2 − $2 = $0 $0 − $2 = –$2 $5 − $2 = $3
100 x $3 = $300 100 x $0 = $0 100 x (−$2) = −$200 100 x $3 = $300 Total benefit from reducing CO2: $400
Value per life: $500
Safety value: $500
Value per unit time: $ 1
Congestion value: −$300 Total net benefit per year $ 14,600
Source: Duranton and Venables 2018.
The Framework in Action
151
