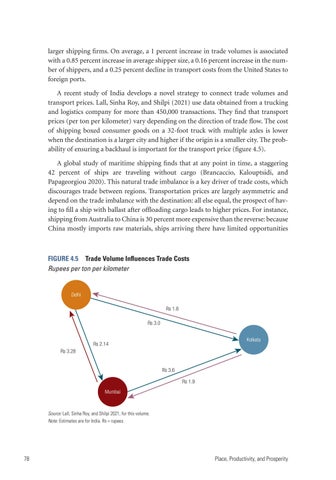
larger shipping firms. On average, a 1 percent increase in trade volumes is associated with a 0.85 percent increase in average shipper size, a 0.16 percent increase in the number of shippers, and a 0.25 percent decline in transport costs from the United States to foreign ports. A recent study of India develops a novel strategy to connect trade volumes and transport prices. Lall, Sinha Roy, and Shilpi (2021) use data obtained from a trucking and logistics company for more than 450,000 transactions. They find that transport prices (per ton per kilometer) vary depending on the direction of trade flow. The cost of shipping boxed consumer goods on a 32-foot truck with multiple axles is lower when the destination is a larger city and higher if the origin is a smaller city. The probability of ensuring a backhaul is important for the transport price (figure 4.5). A global study of maritime shipping finds that at any point in time, a staggering 42 percent of ships are traveling without cargo (Brancaccio, Kalouptsidi, and Papageorgiou 2020). This natural trade imbalance is a key driver of trade costs, which discourages trade between regions. Transportation prices are largely asymmetric and depend on the trade imbalance with the destination: all else equal, the prospect of having to fill a ship with ballast after offloading cargo leads to higher prices. For instance, shipping from Australia to China is 30 percent more expensive than the reverse: because China mostly imports raw materials, ships arriving there have limited opportunities
FIGURE 4.5 Trade Volume Influences Trade Costs Rupees per ton per kilometer
Delhi Rs 1.8 Rs 3.0 Kolkata
Rs 2.14 Rs 3.28 Rs 3.6 Rs 1.9 Mumbai
Source: Lall, Sinha Roy, and Shilpi 2021, for this volume. Note: Estimates are for India. Rs = rupees.
78
Place, Productivity, and Prosperity