● 79
Selected Country Pages
MONTENEGRO Table 1
2017
P o pulatio n, millio n
0.6
GDP , current US$ billio n
4.7
GDP per capita, current US$
7528
Upper middle-inco me po verty rate ($ 5.5) Gini co efficient
a
a
4.8 31.9
Scho o l enro llment, primary (% gro ss) Life expectancy at birth, years
b
b
94.3 76.9
Source: WDI, M acro Poverty Outlook, and official data. Notes: (a) M ost recent value (2014), 2011 PPPs. (b) M ost recent WDI value (2015).
Economic growth accelerated in 2017 due to surge in investment led by the highway construction and a historically strong tourism season. Employment increased continuing four years of growth. However, unemployment remains high amid high informality and increased labor imports. Labor force participation increased slightly led by male activation. While fiscal consolidation efforts are underway, led by tax changes, high deficit and public debt require continued efforts. The improved credit rating outlook is providing easier access to capital market.
Recent developments The economy grew by 4.3 percent in 2017. Investment made the strongest contribution to growth at 5 percentage points (pp), as the construction of the Bar-Boljare highway and residential construction accelerated. Consumption also grew, contributing an additional 3.7 percentage points, supported by employment and wage growth. Net exports continued to contribute negatively to growth, but in 2017 subtracted less from growth due to a record tourism season and a pickup in goods exports from the metal industry, driven by improved EU demand. Due to high import content, the growth impact of the higher investment for highway construction is subdued. Credit growth increased by close to 12 percent in 2017, as household lending surged, amid subdued corporate lending. NPLs declined to 7 percent of total loans, supported by relaxed voluntary financial restructuring rules. Current account deficit further widened to 18.9 percent of GDP in 2017 on the back of rising constructionrelated imports and despite rise in exports of metals, mineral ore sales, and tourism. Net FDI inflows increased to 11.2 percent of GDP, financing two-thirds of the CAD. Still, after a decline in 2016 to 160 percent, external debt increased again in 2017 to an estimated 162 percent of GDP and remains the highest in the region. Robust growth led to employment rise by 2.5 percent in 2017; however, it slowed down in the last quarter by 0.2 percentage
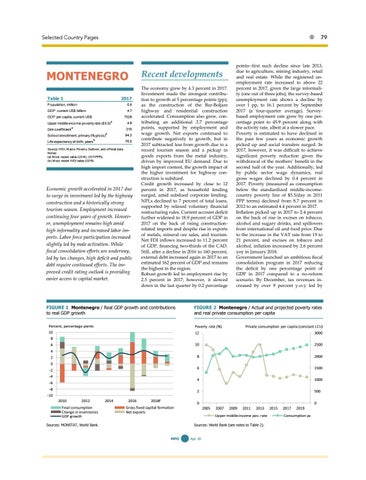
FIGURE 1 Montenegro / Real GDP growth and contributions to real GDP growth
points--first such decline since late 2013, due to agriculture, mining industry, retail and real estate. While the registered unemployment rate increased to above 22 percent in 2017, given the large informality (one out of three jobs), the survey-based unemployment rate shows a decline by over 1 pp, to 16.1 percent by September 2017 (a four-quarter average). Surveybased employment rate grew by one percentage point to 45.9 percent along with the activity rate, albeit at a slower pace. Poverty is estimated to have declined in the past few years as economic growth picked up and social transfers surged. In 2017, however, it was difficult to achieve significant poverty reduction given the withdrawal of the mothers’ benefit in the second half of the year. Additionally, led by public sector wage dynamics, real gross wages declined by 0.4 percent in 2017. Poverty (measured as consumption below the standardized middle-incomecountry poverty line of $5.5/day in 2011 PPP terms) declined from 8.7 percent in 2012 to an estimated 4.4 percent in 2017. Inflation picked up in 2017 to 2.4 percent on the back of rise in excises on tobacco, alcohol and sugary drinks, and spillovers from international oil and food price. Due to the increase in the VAT rate from 19 to 21 percent, and excises on tobacco and alcohol, inflation increased by 2.6 percent yoy in January 2018. Government launched an ambitious fiscal consolidation program in 2017 reducing the deficit by one percentage point of GDP in 2017 compared to a no-reform scenario. By December, tax revenues increased by over 9 percent y-o-y led by
FIGURE 2 Montenegro / Actual and projected poverty rates and real private consumption per capita
Percent, percentage points 10
Poverty rate (%)
Private consumption per capita (constant LCU)
12
3000
10
2500
8
2000
6
1500
4
1000
2
500
8 6 4 2 0
-2 -4 -6 -8 -10
2010
2012
Final consumption Change in inventories GDP growth
2014
2016
2018f
0
Gross fixed capital formation Net exports
2005
2007
2009
2011
2013
Upper middle-income pov. rate
Sources: MONSTAT, World Bank.
Sources: World Bank (see notes to Table 2). MPO
66
Apr 18
2015
2017
2019
Consumption pc
0