37
Consider Bulgaria
medium level of structural integration in GVCs, which is slightly worse on the selling side. Table 2A.1 in annex 2A shows buyer-related and sellerrelated measures of structural integration in GVCs, as measured by the Bonacich power index (Bonacich 1987). They are denoted with the terms BONwin and BONwout, respectively. Bulgaria’s overall extent of structural integration in GVCs as a buyer (BONwin) lies in the medium spectrum and is weakest in transport equipment. The country’s overall structural integration in GVCs as a seller (BONwout) lies in the low to medium range across the country sample, and is lowest in agriculture, food and beverages, electrical and optical equipment, and transport equipment. The countries with the highest levels of structural integration in GVCs are China, Germany, and the United States. Minimal spanning trees help in visualizing the complexity and heterogeneity of actors and trade links in GVCs (for the concept of network visualizations, see chapter 6). Figure 1.10 in chapter 1 illustrates a minimal spanning tree based on trade in value-added data (as computed by Santoni and Taglioni 2015). The main root of the tree is Germany, making it the most relevant source of the “imported” value added in other countries’ exports, including Bulgaria, but also in peers such as Poland, Portugal, and Turkey, as well as China. Bulgaria’s structural integration in GVCs is less peripheral compared with Portugal, Romania, and Turkey. From the regional perspective, value-added trade flows between Germany and Poland are the most relevant. Micro Perspective: Firms’ Integration in GVCs A country’s integration in GVCs is the outcome of firms’ GVC links. Domestic firms can become sellers in GVCs by supplying to multinational firms in the country or by exporting inputs or final products to international buyers. Domestic firms can also act as buyers by sourcing intermediates from abroad (for a description of GVC measures based on World Bank Enterprise Surveys, see box 6.2 in chapter 6). Bulgaria’s domestic firms are less well integrated in GVCs on the selling side than are local subsidiaries of multinationals. Whereas 66 percent of the foreign firms sampled in Bulgaria export at least 1 percent, the share drops to 18 percent for domestic firms (figure 2.3). The share of domestic firms that export is higher in Poland (23.1 percent) and Romania (21.1 percent), and almost twice as high in Turkey (35.9 percent). In Bulgaria, domestically owned manufacturing firms tend to source only 65.3 percent of their inputs locally,
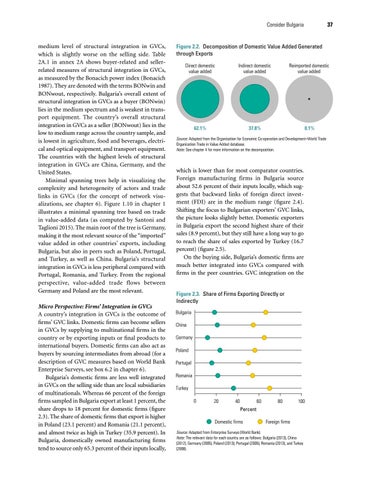
Figure 2.2. Decomposition of Domestic Value Added Generated through Exports Direct domestic value added
Indirect domestic value added
Reimported domestic value added
62.1%
37.8%
0.1%
Source: Adapted from the Organisation for Economic Co-operation and Development–World Trade Organization Trade in Value Added database. Note: See chapter 4 for more information on the decomposition.
which is lower than for most comparator countries. Foreign manufacturing firms in Bulgaria source about 52.6 percent of their inputs locally, which suggests that backward links of foreign direct investment (FDI) are in the medium range (figure 2.4). Shifting the focus to Bulgarian exporters’ GVC links, the picture looks slightly better. Domestic exporters in Bulgaria export the second highest share of their sales (8.9 percent), but they still have a long way to go to reach the share of sales exported by Turkey (16.7 percent) (figure 2.5). On the buying side, Bulgaria’s domestic firms are much better integrated into GVCs compared with firms in the peer countries. GVC integration on the Figure 2.3. Share of Firms Exporting Directly or Indirectly Bulgaria China Germany Poland Portugal Romania Turkey 0
20
40
60
80
100
Percent Domestic firms
Foreign firms
Source: Adapted from Enterprise Surveys (World Bank). Note: The relevant data for each country are as follows: Bulgaria (2013), China (2012), Germany (2005), Poland (2013), Portugal (2005), Romania (2013), and Turkey (2008).