140
Financing Transit-Oriented Development with Land Values
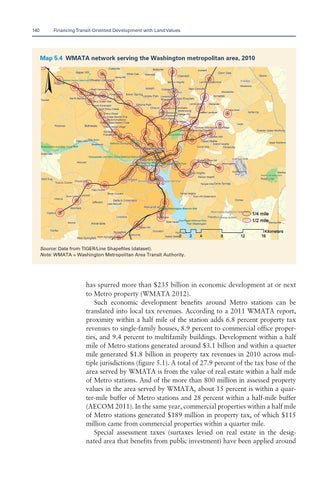
Map 5.4 WMATA network serving the Washington metropolitan area, 2010
Source: Data from TIGER/Line Shapefiles (dataset). Note: WMATA = Washington Metropolitan Area Transit Authority.
has spurred more than $235 billion in economic development at or next to Metro property (WMATA 2012). Such economic development benefits around Metro stations can be translated into local tax revenues. According to a 2011 WMATA report, proximity within a half mile of the station adds 6.8 percent property tax revenues to single-family houses, 8.9 percent to commercial office properties, and 9.4 percent to multifamily buildings. Development within a half mile of Metro stations generated around $3.1 billion and within a quarter mile generated $1.8 billion in property tax revenues in 2010 across multiple jurisdictions (figure 5.1). A total of 27.9 percent of the tax base of the area served by WMATA is from the value of real estate within a half mile of Metro stations. And of the more than 800 million in assessed property values in the area served by WMATA, about 15 percent is within a quarter-mile buffer of Metro stations and 28 percent within a half-mile buffer (AECOM 2011). In the same year, commercial properties within a half mile of Metro stations generated $189 million in property tax, of which $115 million came from commercial properties within a quarter mile. Special assessment taxes (surtaxes levied on real estate in the designated area that benefits from public investment) have been applied around