MALAYSIA (US$ million, unless otherwise indicated) 2000
2005
2007
2008
2009
2010
2011
2012
41,946 37,192 4,573 0 181
52,054 38,679 13,176 0 199
63,091 39,771 23,100 0 220
67,674 44,660 22,800 0 214
69,784 43,979 23,695 0 2,110
85,126 47,977 35,076 0 2,073
94,468 48,697 43,704 0 2,067
103,950 54,894 46,987 0 2,069
37,192 19,125 4,950 14,175 18,067
38,679 22,324 6,542 15,782 16,356
39,771 19,745 4,374 15,372 20,026
44,660 22,742 5,164 17,578 21,918
43,979 22,647 4,092 18,555 21,332
47,977 27,351 3,750 23,601 20,626
48,697 27,156 3,263 23,893 21,541
54,894 27,119 2,468 24,651 27,775
Disbursements Public and publicly guaranteed Official creditors Private creditors Private nonguaranteed
5,921 3,460 1,446 2,015 2,461
6,050 2,182 981 1,201 3,868
5,852 1,373 206 1,166 4,479
5,180 1,942 98 1,844 3,238
8,339 5,319 47 5,271 3,020
14,720 6,014 18 5,996 8,706
12,856 3,311 10 3,301 9,545
14,814 3,439 2 3,436 11,375
Principal repayments Public and publicly guaranteed Official creditors Private creditors Private nonguaranteed
4,146 2,017 840 1,176 2,129
7,192 4,752 1,218 3,534 2,440
7,819 3,646 1,691 1,956 4,172
6,258 1,503 820 683 4,755
9,793 5,351 1,053 4,298 4,442
11,349 1,863 688 1,176 9,486
8,981 3,608 625 2,983 5,373
7,357 3,304 604 2,701 4,053
Interest payments Public and publicly guaranteed Official creditors Private creditors Private nonguaranteed
2,021 1,159 259 900 862
1,858 1,208 314 894 650
2,035 1,192 202 990 843
2,112 1,058 129 929 1,053
1,746 876 124 752 870
1,708 1,024 97 927 684
1,563 1,017 86 931 545
1,967 1,293 79 1,214 674
337 606 -269 1,170 838 331 -1,439
601 -238 839 -904 -2,333 1,428 1,744
9,331 -1,484 10,815 -482 -789 307 11,297
-1,378 -722 -656 -356 1,161 -1,517 -300
-560 -1,006 446 -448 974 -1,422 895
14,753 -669 15,423 4,041 4,821 -780 11,381
12,503 -614 13,117 4,489 317 4,172 8,628
10,740 -602 11,341 8,058 736 7,323 3,283
3,788 ..
3,925 -1,200
9,071 -669
7,573 -10,716
115 -449
10,886 ..
15,119 ..
9,734 ..
.. 63.1
4.2 71.2
5.8 65.9
4.7 68.7
0.1 78.2
0.1 82.3
0.0 83.0
0.0 85.9
86,182 114,356 342 103,944 7,173 8,488 28,330
137,211 166,725 1,117 142,268 8,330 19,980 69,858
189,484 217,001 1,556 182,563 9,932 29,770 101,019
224,078 242,055 1,329 197,879 13,838 38,914 91,149
198,218 197,562 1,131 160,181 11,119 31,801 95,432
238,591 243,301 1,103 209,534 15,298 26,998 104,884
280,754 281,911 1,211 241,520 18,105 33,508 131,780
292,622 279,255 1,320 254,714 18,385 18,638 137,784
36.7 48.7 5.6 10.9 3.1 67.5 3.3
31.2 37.9 5.6 25.3 1.8 134.2 5.9
29.1 33.3 4.8 36.6 0.7 160.1 6.6
28.0 30.2 3.7 33.7 0.6 134.7 5.5
35.3 35.2 6.1 34.0 0.4 136.8 7.1
35.0 35.7 5.5 41.2 0.3 123.2 6.0
33.5 33.6 3.9 46.3 0.2 139.5 6.5
37.2 35.5 3.5 45.2 0.2 132.5 6.5
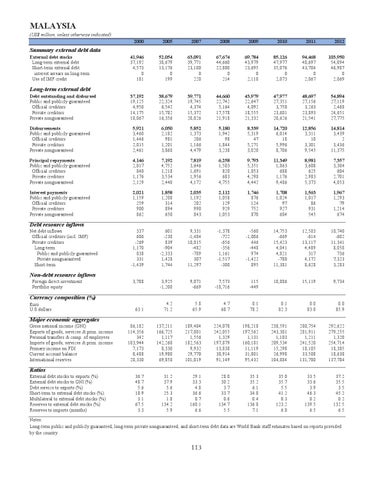
Summary external debt data External debt stocks Long-term external debt Short-term external debt interest arrears on long-term Use of IMF credit
Long-term external debt Debt outstanding and disbursed Public and publicly guaranteed Official creditors Private creditors Private nonguaranteed
Debt resource inflows Net debt inflows Official creditors (incl. IMF) Private creditors Long-term Public and publicly guaranteed Private nonguaranteed Short-term
Non-debt resource inflows Foreign direct investment Portfolio equity
Currency composition (%) Euro U.S.dollars
Major economic aggregates Gross national income (GNI) Exports of goods, services & prim. income Personal transfers & comp. of employees Imports of goods, services & prim. income Primary income on FDI Current account balance International reserves
Ratios External debt stocks to exports (%) External debt stocks to GNI (%) Debt service to exports (%) Short-term to external debt stocks (%) Multilateral to external debt stocks (%) Reserves to external debt stocks (%) Reserves to imports (months)
Notes: Long-term public and publicly guaranteed, long-term private nonguaranteed, and short-term debt data are World Bank staff estimates based on reports provided by the country.
113