120
The Transport Sector
Table 7.3 Projected Macro-Sectoral Shares for Value-Added in Nigeria percent Year
Agriculture
Manufacturing
Mining
Services
2010 2015 2020 2025 2030 2035
43 32 25 23 21 21
1 5 12 17 18 19
36 33 25 21 21 21
19 29 38 39 39 39
Source: Elaborations on Vision 20: 2020 targets.
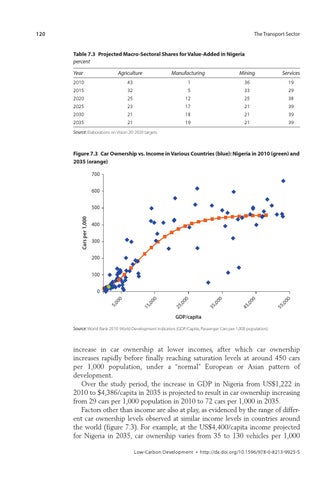
Figure 7.3 Car Ownership vs. Income in Various Countries (blue): Nigeria in 2010 (green) and 2035 (orange) 700 600
Cars per 1,000
500 400 300 200 100
00 ,0 55
00 ,0 45
00 ,0 35
00 ,0 25
00 ,0 15
5,
00
0
0
GDP/capita Source: World Bank 2010: World Development Indicators (GDP/Capita, Passenger Cars per 1,000 population).
increase in car ownership at lower incomes, after which car ownership increases rapidly before finally reaching saturation levels at around 450 cars per 1,000 population, under a “normal” European or Asian pattern of development. Over the study period, the increase in GDP in Nigeria from US$1,222 in 2010 to $4,386/capita in 2035 is projected to result in car ownership increasing from 29 cars per 1,000 population in 2010 to 72 cars per 1,000 in 2035. Factors other than income are also at play, as evidenced by the range of different car ownership levels observed at similar income levels in countries around the world (figure 7.3). For example, at the US$4,400/capita income projected for Nigeria in 2035, car ownership varies from 35 to 130 vehicles per 1,000 Low-Carbon Development • http://dx.doi.org/10.1596/978-0-8213-9925-5