The jobs challenge
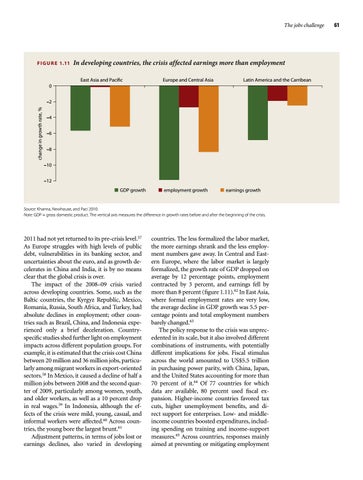
F I G U R E 1.11
0
In developing countries, the crisis affected earnings more than employment East Asia and Pacific
Europe and Central Asia
Latin America and the Carribean
change in growth rate, %
–2 –4 –6 –8 –10 –12 GDP growth
employment growth
earnings growth
Source: Khanna, Newhouse, and Paci 2010. Note: GDP = gross domestic product. The vertical axis measures the difference in growth rates before and after the beginning of the crisis.
2011 had not yet returned to its pre-crisis level.57 As Europe struggles with high levels of public debt, vulnerabilities in its banking sector, and uncertainties about the euro, and as growth decelerates in China and India, it is by no means clear that the global crisis is over. The impact of the 2008–09 crisis varied across developing countries. Some, such as the Baltic countries, the Kyrgyz Republic, Mexico, Romania, Russia, South Africa, and Turkey, had absolute declines in employment; other countries such as Brazil, China, and Indonesia experienced only a brief deceleration. Countryspecific studies shed further light on employment impacts across different population groups. For example, it is estimated that the crisis cost China between 20 million and 36 million jobs, particularly among migrant workers in export-oriented sectors.58 In Mexico, it caused a decline of half a million jobs between 2008 and the second quarter of 2009, particularly among women, youth, and older workers, as well as a 10 percent drop in real wages.59 In Indonesia, although the effects of the crisis were mild, young, casual, and informal workers were affected.60 Across countries, the young bore the largest brunt.61 Adjustment patterns, in terms of jobs lost or earnings declines, also varied in developing
countries. The less formalized the labor market, the more earnings shrank and the less employment numbers gave away. In Central and Eastern Europe, where the labor market is largely formalized, the growth rate of GDP dropped on average by 12 percentage points, employment contracted by 3 percent, and earnings fell by more than 8 percent (figure 1.11).62 In East Asia, where formal employment rates are very low, the average decline in GDP growth was 5.5 percentage points and total employment numbers barely changed.63 The policy response to the crisis was unprecedented in its scale, but it also involved different combinations of instruments, with potentially different implications for jobs. Fiscal stimulus across the world amounted to US$5.5 trillion in purchasing power parity, with China, Japan, and the United States accounting for more than 70 percent of it.64 Of 77 countries for which data are available, 80 percent used fiscal expansion. Higher-income countries favored tax cuts, higher unemployment benefits, and direct support for enterprises. Low- and middleincome countries boosted expenditures, including spending on training and income-support measures.65 Across countries, responses mainly aimed at preventing or mitigating employment
61