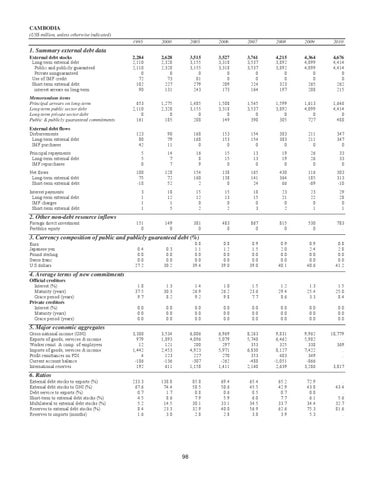
CAMBODIA (US$ million, unless otherwise indicated) 1995
2000
2005
2006
2007
2008
2009
2010
External debt stocks Long-term external debt Public and publicly guaranteed Private nonguaranteed Use of IMF credit Short-term external debt interest arrears on long-term
2,284 2,110 2,110 0 72 102 90
2,628 2,328 2,328 0 73 227 131
3,515 3,155 3,155 0 81 279 243
3,527 3,318 3,318 0 0 209 173
3,761 3,537 3,537 0 0 224 164
4,215 3,892 3,892 0 0 323 197
4,364 4,099 4,099 0 0 265 208
4,676 4,414 4,414 0 0 262 215
Memorandum items Principal arrears on long-term Long-term public sector debt Long-term private sector debt Public & publicly guaranteed commitments
653 2,110 0 161
1,275 2,328 0 185
1,485 3,155 0 208
1,508 3,318 0 149
1,545 3,537 0 390
1,599 3,892 0 305
1,613 4,099 0 727
1,646 4,414 0 488
External debt flows Disbursements Long-term external debt IMF purchases
123 80 42
90 79 11
168 168 0
153 153 0
154 154 0
383 383 0
211 211 0
347 347 0
Principal repayments Long-term external debt IMF repurchases
5 5 0
14 7 7
16 8 9
15 15 0
13 13 0
19 19 0
26 26 0
33 33 0
Net flows Long-term external debt Short-term external debt
100 75 -18
128 72 52
154 160 2
138 138 0
165 141 24
430 364 66
116 185 -69
303 313 -10
Interest payments Long-term external debt IMF charges Short-term external debt
3 1 1 1
18 12 1 5
15 12 0 2
15 13 0 2
18 15 0 3
23 21 0 2
23 22 0 1
29 28 0 1
151 0
149 0
381 0
483 0
867 0
815 0
530 0
783 ..
1. Summary external debt data
2. Other non-debt resource inflows
Foreign direct investment Portfolio equity
3. Currency composition of public and publicly guaranteed debt (%) Euro Japanese yen Pound sterling Swiss franc U.S.dollars
.. 0.4 0.0 0.0 27.2
.. 0.3 0.0 0.0 30.2
0.8 1.1 0.0 0.0 39.4
0.8 1.2 0.0 0.0 39.0
0.9 1.5 0.0 0.0 39.0
0.9 2.0 0.0 0.0 40.1
0.9 2.4 0.0 0.0 40.6
0.8 2.8 0.0 0.0 41.2
1.8 37.5 9.7
1.3 30.3 8.2
1.4 26.9 9.2
1.0 26.2 9.8
1.5 23.6 7.7
1.2 29.4 8.6
1.3 25.4 3.3
1.5 25.0 8.4
0.0 0.0 0.0
0.0 0.0 0.0
0.0 0.0 0.0
0.0 0.0 0.0
0.0 0.0 0.0
0.0 0.0 0.0
0.0 0.0 0.0
0.0 0.0 0.0
3,380 979 12 1,442 4 -186 192
3,534 1,893 121 2,453 123 -136 611
6,006 4,096 200 4,923 227 -307 1,158
6,969 5,079 297 5,971 270 -262 1,411
8,263 5,748 353 6,830 353 -488 2,140
9,831 6,462 325 8,127 403 -1,051 2,639
9,962 5,982 338 7,422 349 -866 3,286
10,779 .. 369 .. .. .. 3,817
233.3 67.6 0.7 4.5 5.2 8.4 1.6
138.8 74.4 1.7 8.6 14.5 23.3 3.0
85.8 58.5 0.8 7.9 30.1 32.9 2.8
69.4 50.6 0.6 5.9 33.1 40.0 2.8
65.4 45.5 0.5 6.0 34.5 56.9 3.8
65.2 42.9 0.7 7.7 33.7 62.6 3.9
72.9 43.8 0.8 6.1 34.4 75.3 5.3
.. 43.4 .. 5.6 32.7 81.6 ..
4. Average terms of new commitments Official creditors Interest (%) Maturity (years) Grace period (years) Private creditors Interest (%) Maturity (years) Grace period (years)
5. Major economic aggregates
Gross national income (GNI) Exports of goods, services & income Worker remit. & comp. of employees Imports of goods, services & income Profit remittances on FDI Current account balance International reserves
6. Ratios
External debt stocks to exports (%) External debt stocks to GNI (%) Debt service to exports (%) Short-term to external debt stocks (%) Multilateral to external debt stocks (%) Reserves to external debt stocks (%) Reserves to imports (months)
98