Kosovo Europe & Central Asia
Lower middle income Country data 2000
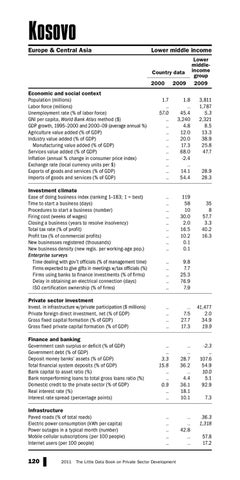
Economic and social context Population (millions) Labor force (millions) Unemployment rate (% of labor force) GNI per capita, World Bank Atlas method ($) GDP growth, 1995–2000 and 2000–09 (average annual %) Agriculture value added (% of GDP) Industry value added (% of GDP) Manufacturing value added (% of GDP) Services value added (% of GDP) Inflation (annual % change in consumer price index) Exchange rate (local currency units per $) Exports of goods and services (% of GDP) Imports of goods and services (% of GDP)
2009
Lower middleincome group 2009
1.7 .. 57.0 .. .. .. .. .. .. .. .. .. ..
1.8 .. 45.4 3,240 4.8 12.0 20.0 17.3 68.0 -2.4 .. 14.1 54.4
.. .. .. .. .. .. .. .. ..
119 58 10 30.0 2.0 16.5 10.2 0.1 0.1
.. .. .. .. ..
9.8 7.7 25.3 76.9 7.9
Private sector investment Invest. in infrastructure w/private participation ($ millions) Private foreign direct investment, net (% of GDP) Gross fixed capital formation (% of GDP) Gross fixed private capital formation (% of GDP)
.. .. .. ..
.. 7.5 27.7 17.3
41,477 2.0 34.9 19.9
Finance and banking Government cash surplus or deficit (% of GDP) Government debt (% of GDP) Deposit money banks’ assets (% of GDP) Total financial system deposits (% of GDP) Bank capital to asset ratio (%) Bank nonperforming loans to total gross loans ratio (%) Domestic credit to the private sector (% of GDP) Real interest rate (%) Interest rate spread (percentage points)
.. .. 3.3 15.8 .. .. 0.9 .. ..
.. .. 28.7 36.2 .. 4.4 36.1 18.1 10.1
-2.3 .. 107.6 54.9 10.0 5.1 92.9
.. .. .. .. ..
.. .. 42.8 .. ..
36.3 1,318
Investment climate Ease of doing business index (ranking 1–183; 1 = best) Time to start a business (days) Procedures to start a business (number) Firing cost (weeks of wages) Closing a business (years to resolve insolvency) Total tax rate (% of profit) Profit tax (% of commercial profits) New businesses registered (thousands) New business density (new regis. per working-age pop.) Enterprise surveys Time dealing with gov’t officials (% of management time) Firms expected to give gifts in meetings w/tax officials (%) Firms using banks to finance investments (% of firms) Delay in obtaining an electrical connection (days) ISO certification ownership (% of firms)
Infrastructure Paved roads (% of total roads) Electric power consumption (kWh per capita) Power outages in a typical month (number) Mobile cellular subscriptions (per 100 people) Internet users (per 100 people)
120
2011
The Little Data Book on Private Sector Development
3,811 1,787 5.3 2,321 8.5 13.3 38.9 25.8 47.7 28.9 28.3
35 8 57.7 3.3 40.2 16.3
7.3
57.8 17.2