About the data
3.8
environment
Energy dependency and efficiency and carbon dioxide emissions Definitions
Because commercial energy is widely traded, its pro-
elemental carbon, were converted to actual carbon
• Net energy imports are estimated as energy use
duction and use need to be distinguished. Net energy
dioxide mass by multiplying them by 3.664 (the ratio
less production, both measured in oil equivalents.
imports show the extent to which an economy’s use
of the mass of carbon to that of carbon dioxide).
• GDP per unit of energy use is the ratio of gross
exceeds its production. High-income economies are
Although estimates of global carbon dioxide emis-
domestic product (GDP) per kilogram of oil equiva-
net energy importers; middle-income economies are
sions are probably accurate within 10 percent (as cal-
lent of energy use, with GDP converted to 2005
their main suppliers.
culated from global average fuel chemistry and use),
international dollars using purchasing power parity
The ratio of gross domestic product (GDP) to energy
country estimates may have larger error bounds.
(PPP) rates. An international dollar has the same
use indicates energy efficiency. To produce compa-
Trends estimated from a consistent time series tend
purchasing power over GDP that a U.S. dollar has
rable and consistent estimates of real GDP across
to be more accurate than individual values. Each year
in the United States. Energy use refers to the use
economies relative to physical inputs to GDP—that
the CDIAC recalculates the entire time series since
of primary energy before transformation to other
is, units of energy use—GDP is converted to 2005
1949, incorporating recent findings and corrections.
end-use fuel, which is equal to indigenous produc-
international dollars using purchasing power parity
Estimates exclude fuels supplied to ships and aircraft
tion plus imports and stock changes minus exports
(PPP) rates. Differences in this ratio over time and
in international transport because of the difficulty of
and fuel supplied to ships and aircraft engaged in
across economies reflect structural changes in an
apportioning the fuels among benefiting countries.
international transport (see About the data for table
economy, changes in sectoral energy efficiency, and
The ratio of carbon dioxide per unit of energy shows
3.7). • Carbon dioxide emissions are emissions from
differences in fuel mixes.
carbon intensity, which is the amount of carbon diox-
the burning of fossil fuels and the manufacture of
Carbon dioxide emissions, largely by-products of
ide emitted as a result of using one unit of energy in
cement and include carbon dioxide produced during
energy production and use (see table 3.7), account
the process of production. The proportion of carbon
consumption of solid, liquid, and gas fuels and gas
for the largest share of greenhouse gases, which are
dioxide per unit of GDP indicates how clean produc-
flaring.
associated with global warming. Anthropogenic car-
tion processes are.
bon dioxide emissions result primarily from fossil fuel combustion and cement manufacturing. In combustion different fossil fuels release different amounts of carbon dioxide for the same level of energy use: oil releases about 50 percent more carbon dioxide than natural gas, and coal releases about twice as much. Cement manufacturing releases about half a metric ton of carbon dioxide for each metric ton of cement produced. The U.S. Department of Energy’s Carbon Dioxide Information Analysis Center (CDIAC) calculates annual anthropogenic emissions from data on fossil fuel consumption (from the United Nations Statistics Division’s World Energy Data Set) and world cement manufacturing (from the U.S. Bureau of Mines’s Cement Manufacturing Data Set). Carbon dioxide emissions, often calculated and reported as
3.8a
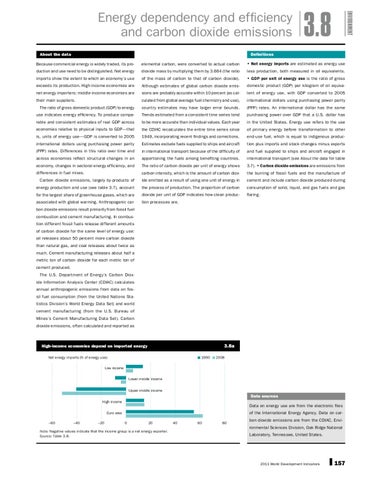
High-income economies depend on imported energy Net energy imports (% of energy use)
1990
2008
Low income Lower middle income Upper middle income
Data sources High income
Data on energy use are from the electronic files of the International Energy Agency. Data on car-
Euro area –60
–40
–20
0
20
Note: Negative values indicate that the income group is a net energy exporter. Source: Table 3.8.
40
60
80
bon dioxide emissions are from the CDIAC, Environmental Sciences Division, Oak Ridge National Laboratory, Tennessee, United States.
2011 World Development Indicators
157