Ju Janl-89 Ju -90 Janl-90 Ju -91 Janl-91 Ju -92 Janl-92 Ju -93 Janl-93 Ju -94 Janl-94 Ju -95 Janl-95 Ju -96 Janl-96 Ju -9 Janl-97 7 Ju -98 Janl-98 Ju -99 Janl-99 Ju -00 Janl-00 Ju -01 Janl-01 Ju -02 Janl-02 Ju -03 Janl-03 Ju -04 Janl-04 Ju -05 Janl-05 Ju -06 Janl-06 Ju -07 Janl-07 Ju -08 Janl-08 -0 9
percent 20 GDP
20
3 03 Q 03 2 –0 4Q 20 1 03 –0 20 4Q 4 04 –0 20 5Q 3 05 –0 20 6Q 06 2 –0 7Q 20 06 1 –0 20 7Q 4 07 –0 20 8Q 3 08 –0 9Q 2 02 –
–0 2Q
4
1
1Q
1Q
percent 25
20
01
20
–0
2
2
0Q
–0
00
20
00
20
1
4
9Q
–9
–0
99
19
98
Q
Q
98
97 –
19 19
98
97 –
19
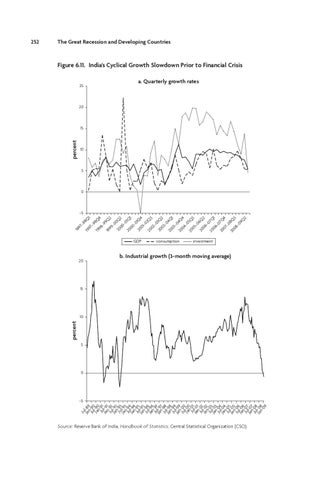
252 The Great Recession and Developing Countries
Figure 6.11. India’s Cyclical Growth Slowdown Prior to Financial Crisis a. Quarterly growth rates
20
15
10
5
0
–5
consumption investment
b. Industrial growth (3-month moving average)
15
10
5
0
–5
Source: Reserve Bank of India, Handbook of Statistics; Central Statistical Organization (CSO).