46
The Cost of Being Landlocked
Table 4.1 Various Transport Times in Mombasa Port and on Transit between Kenya and Uganda, 2005
Port dwell time in Mombasa Transit through Kenya and Uganda
Mode
Median
Mean
95th percentile
4.5 days 3.5 days
8 days 4 days
13 days 5 days
27 days 10 days
Source: Authors’ surveys.
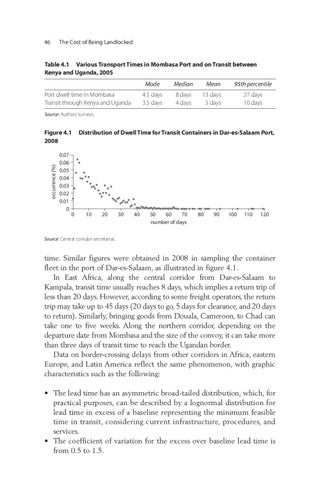
occurrence (%)
Figure 4.1 2008
Distribution of Dwell Time for Transit Containers in Dar-es-Salaam Port,
0.07 0.06 0.05 0.04 0.03 0.02 0.01 0 0
10
20
30
40
50 60 70 number of days
80
90
100
110
120
Source: Central corridor secretariat.
time. Similar figures were obtained in 2008 in sampling the container fleet in the port of Dar-es-Salaam, as illustrated in figure 4.1. In East Africa, along the central corridor from Dar-es-Salaam to Kampala, transit time usually reaches 8 days, which implies a return trip of less than 20 days. However, according to some freight operators, the return trip may take up to 45 days (20 days to go, 5 days for clearance, and 20 days to return). Similarly, bringing goods from Douala, Cameroon, to Chad can take one to five weeks. Along the northern corridor, depending on the departure date from Mombasa and the size of the convoy, it can take more than three days of transit time to reach the Ugandan border. Data on border-crossing delays from other corridors in Africa, eastern Europe, and Latin America reflect the same phenomenon, with graphic characteristics such as the following: • The lead time has an asymmetric broad-tailed distribution, which, for practical purposes, can be described by a lognormal distribution for lead time in excess of a baseline representing the minimum feasible time in transit, considering current infrastructure, procedures, and services. • The coefficient of variation for the excess over baseline lead time is from 0.5 to 1.5.