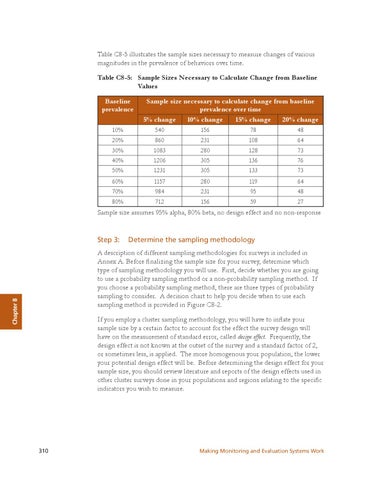
Table C8-5 illustrates the sample sizes necessary to measure changes of various magnitudes in the prevalence of behaviors over time. Table C8-5: Sample Sizes Necessary to Calculate Change from Baseline Values Baseline prevalence 10%
Sample size necessary to calculate change from baseline prevalence over time 5% change 10% change 15% change 20% change 540
156
78
48
20%
860
231
108
64
30%
1083
280
128
73
40%
1206
305
136
76
50%
1231
305
133
73
60%
1157
280
119
64
70%
984
231
95
48
80%
712
156
59
27
Sample size assumes 95% alpha, 80% beta, no design effect and no non-response
Step 3:
Determine the sampling methodology
Chapter 8
A description of different sampling methodologies for surveys is included in Annex A. Before finalizing the sample size for your survey, determine which type of sampling methodology you will use. First, decide whether you are going to use a probability sampling method or a non-probability sampling method. If you choose a probability sampling method, there are three types of probability sampling to consider. A decision chart to help you decide when to use each sampling method is provided in Figure C8-2. If you employ a cluster sampling methodology, you will have to inflate your sample size by a certain factor to account for the effect the survey design will have on the measurement of standard error, called design effect. Frequently, the design effect is not known at the outset of the survey and a standard factor of 2, or sometimes less, is applied. The more homogenous your population, the lower your potential design effect will be. Before determining the design effect for your sample size, you should review literature and reports of the design effects used in other cluster surveys done in your populations and regions relating to the specific indicators you wish to measure.
310
Making Monitoring and Evaluation Systems Work