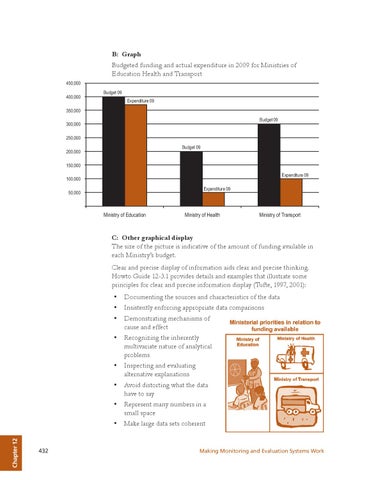
B: Graph Budgeted funding and actual expenditure in 2009 for Ministries of Education Health and Transport 450,000 Budget 09 400,000
Expenditure 09
350,000 Budget 09
300,000 250,000 Budget 09
200,000 150,000
Expenditure 09
100,000 Expenditure 09
50,000
Ministry of Education
Ministry of Health
Ministry of Transport
C: Other graphical display The size of the picture is indicative of the amount of funding available in each Ministry’s budget. Clear and precise display of information aids clear and precise thinking. Howto Guide 12-3.1 provides details and examples that illustrate some principles for clear and precise information display (Tufte, 1997, 2001):
• Documenting the sources and characteristics of the data • Insistently enforcing appropriate data comparisons • Demonstrating mechanisms of cause and effect
• Recognizing the inherently • • •
Chapter 12
•
432
multivariate nature of analytical problems Inspecting and evaluating alternative explanations Avoid distorting what the data have to say Represent many numbers in a small space Make large data sets coherent
Making Monitoring and Evaluation Systems Work