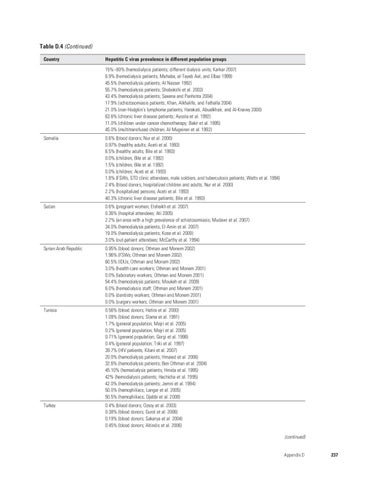
Table D.4 (Continued) Country
Hepatitis C virus prevalence in different population groups 15%–80% (hemodialysis patients; different dialysis units; Karkar 2007) 6.9% (hemodialysis patients; Mahaba, el-Tayeb Ael, and Elbaz 1999) 45.5% (hemodialysis patients; Al Nasser 1992) 55.7% (hemodialysis patients; Shobokshi et al. 2003) 43.4% (hemodialysis patients; Saxena and Panhotra 2004) 17.9% (schistosomiasis patients; Khan, Alkhalife, and Fathalla 2004) 21.0% (non-Hodgkin’s lymphoma patients; Harakati, Abualkhair, and Al-Knawy 2000) 63.6% (chronic liver disease patients; Ayoola et al. 1992) 11.0% (children under cancer chemotherapy; Bakir et al. 1995) 45.0% (multitransfused children; Al-Mugeiren et al. 1992)
Somalia
0.6% (blood donors; Nur et al. 2000) 0.97% (healthy adults; Aceti et al. 1993) 6.5% (healthy adults; Bile et al. 1993) 0.0% (children; Bile et al. 1992) 1.5% (children; Bile et al. 1992) 0.0% (children; Aceti et al. 1993) 1.8% (FSWs, STD clinic attendees, male soldiers, and tuberculosis patients; Watts et al. 1994) 2.4% (blood donors, hospitalized children and adults; Nur et al. 2000) 2.2% (hospitalized persons; Aceti et al. 1993) 40.3% (chronic liver disease patients; Bile et al. 1993)
Sudan
0.6% (pregnant women; Elsheikh et al. 2007) 0.36% (hospital attendees; Ati 2005) 2.2% (an area with a high prevalence of schistosomiasis; Mudawi et al. 2007) 34.0% (hemodialysis patients; El-Amin et al. 2007) 19.0% (hemodialysis patients; Kose et al. 2009) 3.0% (out-patient attendees; McCarthy et al. 1994)
Syrian Arab Republic
0.95% (blood donors; Othman and Monem 2002) 1.96% (FSWs; Othman and Monem 2002) 60.5% (IDUs; Othman and Monem 2002) 3.0% (health care workers; Othman and Monem 2001) 0.0% (laboratory workers; Othman and Monem 2001) 54.4% (hemodialysis patients; Moukeh et al. 2009) 6.0% (hemodialysis staff; Othman and Monem 2001) 0.0% (dentistry workers; Othman and Monem 2001) 0.0% (surgery workers; Othman and Monem 2001)
Tunisia
0.56% (blood donors; Hatira et al. 2000) 1.09% (blood donors; Slama et al. 1991) 1.7% (general population; Mejri et al. 2005) 0.2% (general population; Mejri et al. 2005) 0.71% (general population; Gorgi et al. 1998) 0.4% (general population; Triki et al. 1997) 39.7% (HIV patients; Kilani et al. 2007) 20.0% (hemodialysis patients; Hmaied et al. 2006) 32.6% (hemodialysis patients; Ben Othman et al. 2004) 45.10% (hemodialysis patients; Hmida et al. 1995) 42% (hemodialysis patients; Hachicha et al. 1995) 42.0% (hemodialysis patients; Jemni et al. 1994) 50.0% (hemophiliacs; Langar et al. 2005) 50.5% (hemophiliacs; Djebbi et al. 2008)
Turkey
0.4% (blood donors; Ozsoy et al. 2003) 0.38% (blood donors; Gurol et al. 2006) 0.19% (blood donors; Sakarya et al. 2004) 0.45% (blood donors; Altindis et al. 2006) (continued)
Appendix D
237