130
Table 5. 4
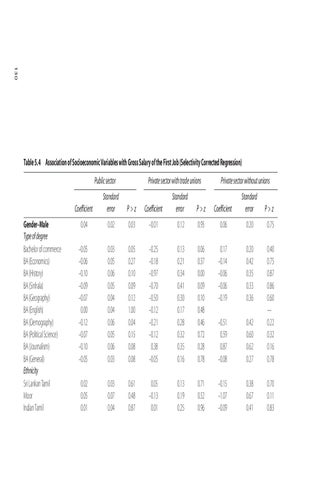
Association of Socioeconomic Variables with Gross Salary of the First Job (Selectivity Corrected Regression) Private sector with trade unions
Public sector
Gender–Male Type of degree Bachelor of commerce BA (Economics) BA (History) BA (Sinhala) BA (Geography) BA (English) BA (Demography) BA (Political Science) BA (Journalism) BA (General) Ethnicity Sri Lankan Tamil Moor Indian Tamil
Private sector without unions
Coefficient
Standard error
P>z
Coefficient
Standard error
0.03
–0.01
0.12
0.95
0.06
0.20
0.75
0.03 0.05 0.06 0.05 0.04 0.04 0.06 0.05 0.06 0.03
0.05 0.27 0.10 0.09 0.12 1.00 0.04 0.15 0.08 0.08
–0.25 –0.18 –0.97 –0.70 –0.50 –0.12 –0.21 –0.12 0.38 –0.05
0.13 0.21 0.34 0.41 0.30 0.17 0.28 0.32 0.35 0.16
0.06 0.37 0.00 0.09 0.10 0.48 0.46 0.72 0.28 0.78
0.17 –0.14 –0.06 –0.06 –0.19
0.20 0.42 0.35 0.33 0.36
–0.51 0.59 0.87 –0.08
0.42 0.60 0.62 0.27
0.40 0.75 0.87 0.86 0.60 — 0.22 0.32 0.16 0.78
0.03 0.07 0.04
0.61 0.48 0.87
0.05 –0.13 0.01
0.13 0.19 0.25
0.71 0.52 0.96
–0.15 –1.07 –0.09
0.38 0.67 0.41
0.70 0.11 0.83
Coefficient
Standard error
P>z
0.04
0.02
–0.05 –0.06 –0.10 –0.09 –0.07 0.00 –0.12 –0.07 –0.10 –0.05 0.02 0.05 0.01
P>z