48
Tiger Economies Under Threat
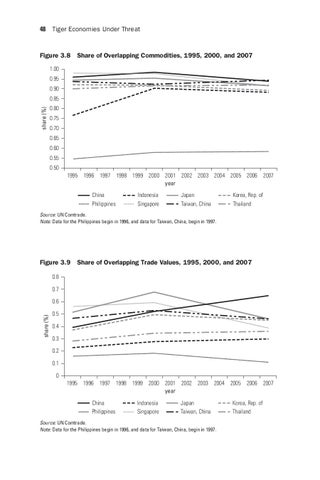
Figure 3.8 Share of Overlapping Commodities, 1995, 2000, and 2007 1.00 0.95 0.90
share (%)
0.85 0.80 0.75 0.70 0.65 0.60 0.55 0.50 1995 1996 1997 1998 1999 2000 2001 2002 2003 2004 2005 2006 2007 year China Philippines
Indonesia Singapore
Japan Taiwan, China
Korea, Rep. of Thailand
Source: UN Comtrade. Note: Data for the Philippines begin in 1996, and data for Taiwan, China, begin in 1997.
Figure 3.9 Share of Overlapping Trade Values, 1995, 2000, and 2007 0.8 0.7
share (%)
0.6 0.5 0.4 0.3 0.2 0.1 0 1995 1996 1997 1998 1999 2000 2001 2002 2003 2004 2005 2006 2007 year China Philippines
Indonesia Singapore
Japan Taiwan, China
Source: UN Comtrade. Note: Data for the Philippines begin in 1996, and data for Taiwan, China, begin in 1997.
Korea, Rep. of Thailand