140
|
ADAMA KONSEIGA
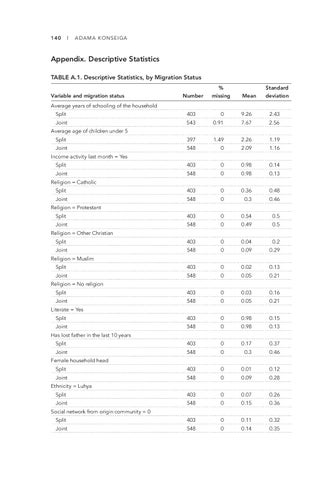
Appendix. Descriptive Statistics TABLE A.1. Descriptive Statistics, by Migration Status Variable and migration status
Number
% missing
Mean
Standard deviation
Average years of schooling of the household Split
403
0
9.26
2.43
Joint
543
0.91
7.67
2.56
Split
397
1.49
2.26
1.19
Joint
548
0
2.09
1.16
Average age of children under 5
Income activity last month = Yes Split
403
0
0.98
0.14
Joint
548
0
0.98
0.13
Religion = Catholic Split
403
0
0.36
0.48
Joint
548
0
0.3
0.46
Religion = Protestant Split
403
0
0.54
0.5
Joint
548
0
0.49
0.5
Religion = Other Christian Split
403
0
0.04
0.2
Joint
548
0
0.09
0.29
Split
403
0
0.02
0.13
Joint
548
0
0.05
0.21
Religion = Muslim
Religion = No religion Split
403
0
0.03
0.16
Joint
548
0
0.05
0.21
Literate = Yes Split
403
0
0.98
0.15
Joint
548
0
0.98
0.13
Has lost father in the last 10 years Split
403
0
0.17
0.37
Joint
548
0
0.3
0.46
Female household head Split
403
0
0.01
0.12
Joint
548
0
0.09
0.28
Ethnicity = Luhya Split
403
0
0.07
0.26
Joint
548
0
0.15
0.36
Social network from origin community = 0 Split
403
0
0.11
0.32
Joint
548
0
0.14
0.35