TECHNICAL REPORT

INVESTIGATION OF ANTIMICROBIAL ACTIVITY OF “UNITOR DUCT AIR TREATMENT”
External organisation: Wilhelmsen Ships Service, Singapore
Chief Investigator: Prof Igor Agranovski (Griffith University)
7 August 2024
1.INTRODUCTION

1.1.
Scope of the project
Griffith University has been commissioned by Wilhelmsen Ships Service to undertake research focused on determination of antimicrobial activities of their product: “UNITOR DUCT AIR TREATMENT” , produced by endemic plants. The research will be focused on conducting experiments in the ~18m2 room over 1 week to determine the effectiveness of the supplied product on naturally occurring bacteria and fungi in the air.
1.2. Background
The potential use of Tea Tree Oil (TTO) as disinfectant has been clearly shown in the literature for treating bacteria (Hayley and Palombo 2009; Carson et al. 2006; Wilkinson and Cavanagh 2005; Salari et al. 2006), fungi (Hammer et al. 2000; Oliva et al. 2003) and viruses (Schnitzler et al. 2001; Cermelli et al. 2008; Garozzo et al. 2011). The antimicrobial activity of TTO is attributed mainly to terpinen-4-ol (35 –45%) and 1,8-cineole (1 – 6%); however other components such as a-terpineol, terpinolene, and a- and cterpinene are also often present and potentially contribute to microbial disinfection (May et al. 2000). TTO was evaluated against several Gram-positive and Gram-negative bacterial strains as well as against various fungal and viral species and showed different degrees of efficiency (Pyankov et al., 2012) Tea tree oil was challenged as aerosols and vapours and demonstrated very promising capabilities on inactivation of pathogenic airborne microbes over short periods of time (Usachev et al., 2013).
2. MATERIALS AND METHODS
The experiments of the stage 4 of the project were undertaken in 18.24 m2 room (3.8 m × 4.8 m) with the
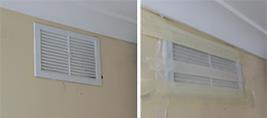
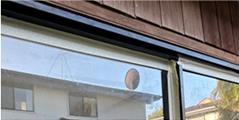
height of the ceiling – 2.23 m. To eliminate any air exchange, all air intakes and discharges, as well as the sliding entry door were hermetically sealed (Figures 1 and 2). The product supplied by the by Wilhelmsen Ships Service 2kg (Part Number 743466) was unpacked, removed from the silver packing foil and placed
on the aluminium tray at the height of 50 cm above the floor. To ensure efficient release of the disinfecting vapor, according to the recommendation provided by the Wilhelmsen Ships Service, a 70 mm diameter fan was located above the tray and directed as is shown in Figure 3.
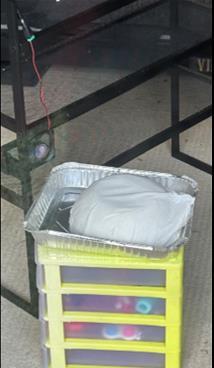
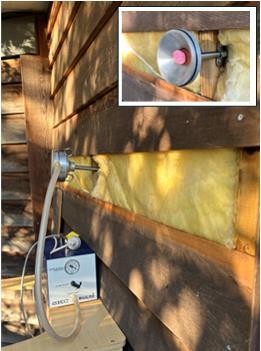
The bioaerosol collection setup is shown in Figure 4. A Single-Stage Viable Bioaerosol Impactor (Cat. No. 225-9611, SKC Eighty Four, PA USA) was used to collect all samples on daily basis.
The air flow at the recommended rate of 28.3 L/min was generated by a BioLite+ vacuum pump (SKC Ltd., Eighty-Four, PA, USA). To ensure that no fresh air reaching the room over the entire experimental procedure, the sampling tube was used to draw the air sample from the outside, as shown in Fig 4. On completion of each run, the tube was plugged as is shown in Fig. 4 (inset).
Before each experimental run, a fresh agar plate was placed into the impactor, and the device was operated for 5 minutes. On completion of each 5 minutes run, the plate was removed and transported to the laboratory for incubation. Five minutes runs’ duration was selected during preliminary experiments as an optimal time to ensure right loading of the collection plates. Alternatively, the plates could either by underloaded (not statistically significant results). Or overloaded making them not countable.
Two types of collecting plates were used; for fungal aerosols: Malt extract agar (MEA) medium (https://www.thermofisher.com/order/catalog/product/CM0059B)
In contrast, for bacterial particles - Oxoid™ Agar Bacteriological (https://www.thermofisher.com/order/catalog/product/LP0011B)
All bacterial plates were incubated over 2 days at the temperature of 37 ºC, and fungal plates at 28 ºC over 4 days period. All plates were inspected daily to eliminate any chances for microbial overgrow, which would make them not countable. On completion of the incubation, colonies were counted, and the concentrations of bacterial and fungal aerosols were presented as Colony Forming Unit (CFU) per m3 . Finally, the inactivation efficiency of supplied product was calculated as:
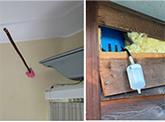
where Cn is the concentration of bioaerosol at day n, and C0 is the concentration of bioaerosol at day 0 (initial concentration of the bioaerosol just before commencement of the 7-days run) To eliminate any possible air intake to replace the volume drawn from the room, a special “breathing tube” was inserted through the wall and equipped with HEPA filter as shown in Figure 5
3. RESULTS
The results of the experiments, obtained on the daily basis are show in Table 1. The upper row shows the average of two experimental repeats for bacterial aerosols and the line below is the results of calculations of the corresponding concentration in the air (based of 5 minutes of the sampler operation at the flow rate of 28.3 LPM) The same procedure was used for calculation of the fungal aerosol concentration and the results are provided in two corresponding rows below.
Table 1. Concentration of bacterial and fungal aerosols over seven days of treatment.
The results on the efficiency of the product are shown in Table 2. As is seen, the highest inactivation has been achieved for both microorganisms over the first 24 hours of the experimental run. Then, the daily inactivation was decreased reaching the highest vales of above 97% at the last day of the experiments
Table 2. Inactivation efficiency of the product