


1 on twitter: #S ot C Copyright © 2010 Gallup, Inc. All rights reserved. overall Knight Soul of the Community 2010 Knight Communities why People love where they live and why it Matters: a national Perspective www.knightfoundation.org
At the Knight Foundation, our mission is to create more informed and engaged communities. We emphasize transformational projects. The Soul of the Community project reflects this mission. This study offers leaders a radically new way to think about their community and invites creative approaches for improvement. The report, based on interviews with residents in 26 Knight communities, proves that a significant connection exists between residents’ levels of emotional attachment to their community and its economic growth. It presents surprising and nearly universal findings about why people form lasting emotional bonds to where they live.
We hope these discoveries inspire renewed engagement in all residents and create lasting, positive change.

 Paula Lynn Ellis, Vice President/Strategic Initiatives
 John S. and James L. Knight Foundation

2 Soulofthe C o MM unity.org
3 on twitter: #S ot C Copyright © 2010 Gallup, Inc. All rights reserved. table of ContentS introduction ....................................................... 4 Community attachment: an emotional Connection ........................ 5 Why Attachment Matters . . . . . . . . . . . . . . . . . . . . . . . . . . . . . . . . . . . . . . . . . . . . . 5 The Relationship to Community Outcomes 6 How Gallup Found the Factors With the Strongest Links to Attachment . . . . . . . . 9 What Matters Most 10 overall findings .................................................. 12 Overall Attachment . . . . . . . . . . . . . . . . . . . . . . . . . . . . . . . . . . . . . . . . . . . . . . . . . 12 Key Drivers of Attachment . . . . . . . . . . . . . . . . . . . . . . . . . . . . . . . . . . . . . . . . . . . 12 Who Is Most Attached . . . . . . . . . . . . . . . . . . . . . . . . . . . . . . . . . . . . . . . . . . . . . . 15 implications for the Knight Communities ............................... 17 Strengths to Leverage . . . . . . . . . . . . . . . . . . . . . . . . . . . . . . . . . . . . . . . . . . . . . . . 17 Opportunities to Prioritize . . . . . . . . . . . . . . . . . . . . . . . . . . . . . . . . . . . . . . . . . . . 17 Snapshots of the Knight Communities ................................. 19 Methodology ..................................................... 35
introduCtion
On behalf of the John S. and James L. Knight Foundation and Gallup, we are pleased to present the third annual Soul of the Community report. This study was conducted over three years in 26 cities across the United States where Knight Foundation is active. It was designed to find out what emotionally attaches people to a community — what makes them want to put down roots and build a life there.
In today’s challenging economic climate, community leaders are seeking new ways to attract and retain people, develop prosperous economies, add intellectual capital, and create jobs. This report provides a fresh perspective about the current driving factors of passion and loyalty in a community. Most importantly, it represents the voice of the residents themselves. Gallup gathered insights from nearly 43,000 individuals, and the resulting picture will help community leaders to answer important questions such as: What makes residents love where they live? What draws people to a place and keeps them there?
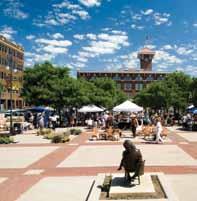
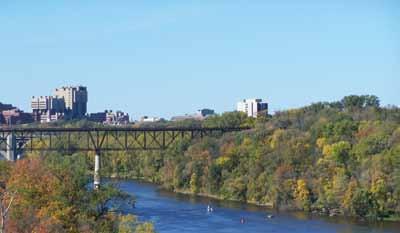
The study provides empirical evidence that the drivers that create emotional bonds between people and their community are consistent in virtually every city and can be reduced to just a few categories. Interestingly, the usual suspects — jobs, the economy, and safety — are not among the top drivers. Rather, people consistently give higher ratings for elements that relate directly to their daily quality of life: an area’s physical beauty, opportunities for socializing, and a community’s openness to all people.

Remarkably, the study also showed that the communities with the highest levels of attachment had the highest rates of gross domestic product growth. Discoveries like these open numerous possibilities for leaders from all sectors to inform their decisions and policies with concrete data about what generates community and economic benefits.
This report is not meant to be prescriptive, but rather to inform and engage leaders in new thinking and action. We hope you will read it, share it, and discuss with others what it might mean for the future of communities across our country. Our hope is that this leads to new conversations and partnerships, and new ways for all of us to work together to increase people’s attachment, to strengthen our cities, and to ensure a brighter future for all people and communities.

4 Soulofthe C o MM unity.org Copyright © 2010 Gallup, Inc. All rights reserved.
Community attachment is an emotional connection to a place that transcends satisfaction, loyalty, and even passion. A community’s most attached residents have strong pride in it, a positive outlook on the community’s future, and a sense that it is the perfect place for them. They are less likely to want to leave than residents without this emotional connection. They feel a bond to their community that is stronger than just being happy about where they live.
why attachment Matters
Over the past three years, the Soul of the Community study has found a positive correlation between community attachment and local GDP growth. Across the 26 Knight communities, those whose residents were more attached saw more local GDP growth. This is a key metric in assessing community success because local GDP growth not only measures a community’s economic success, but also its ability to grow and meet residents’ needs.
Gallup research proving the link between employee engagement in a workplace to business outcomes such as productivity, profitability, and employee retention helps to underscore why emotional attachment matters. Just as actively engaged employees are more productive and committed to the success of their organizations, highly attached residents are more likely to actively contribute to a community’s growth.
5 on twitter: #S ot C Copyright © 2010 Gallup, Inc. All rights reserved. CoMMunity attaChMent: an eMotional ConneCtion
Passion + = Community
-1 0 1 2 3 4 5 6 7 8 Population Growth (2006-2009) GDP Growth (2006-2009) 3.85+ (n=7 communities) 3.71-3.84 (n=9 communities) <3.70 (n=7 communities) CA Correlation to GDP Growth=.411 CA Correlation to Population Growth=.374 GROWTH COMMUNITY ATTACHMENT 0.3% -0.2% 6.7% 2.6% 6.9% 2.1%
Attachment Attitudinal Loyalty
Local GDP Growth by Levels of Community Attachment
GDP and population growth figures available for 23 of the 26 communities.
the relationship to Community outcomes


Precisely how community attachment affects community outcomes is at best a scientific guess at this point. However, the data make clear that highly attached residents are more likely to want to stay in their current communities. When this is true for college graduates and other productive residents, it increases the number of talented, highly educated workers striving to positively affect economic growth.
Highly attached residents are also more likely to see their communities as being open to many kinds of people, including talented, young college graduates and families with young children. Communities that are more open to diversity are better able to compete for talent.
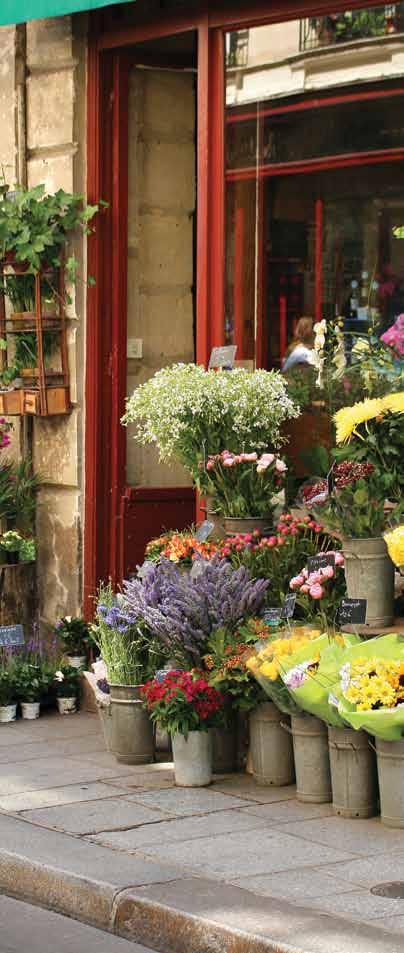
Attachment is also higher when residents agree that their communities provide the social offerings and aesthetics they enjoy. When residents enjoy their community’s offerings, they are more likely to spend their money on local activities and businesses, directly benefiting the local economy.
6 Soulofthe C o MM unity.org Copyright © 2010 Gallup, Inc. All rights reserved.
Grand Forks, ND - MSA Aberdeen, SD - µSA St. Paul, MN - MSA State College, PA - MSA Akron, OH - MSA Detroit, MI - MSA Gary, IN - MD Fort Wayne, IN - MSA Lexington, KY - MSA Myrtle Beach, SC - MSA Charlotte, NC - MSA Columbus, GA - MSA Milledgeville, GA - µSA Columbia, SC - MSA Palm Beach, FL - MD Bradenton, FL - MSA Tallahassee, FL - MSA Biloxi, MS - MSA Wichita, KS - MSA Boulder, CO - MSA San Jose, CA - MSA City of Long Beach, CA - MD Very High Urban Density - Very Large Population Community boundaries are based on government geography definitions. MSA = Metropolitan Statistical Area MD = Metropolitan Division µSA = Micropolitan Statistical Area Very High Urban Density - Large Population Very High Urban Density - Medium Population High Urban Density - Medium Population Medium/Low Urban Density - Medium/Low Population
Knight
Foundation works in 26 communities where the Knight brothers owned newspapers.

Highly attached residents are more likely to see their communities as being open to many kinds of people.


how gallup found the factors with the Strongest links to attachment
To find out what drives attachment, Gallup asked residents five questions examining their level of attachment to their community and then asked them to rate various aspects of the community such as basic services, the local economy, social offerings, and openness.
Gallup then analyzed the relationship between the overall level of community attachment and residents’ perceptions of aspects of the community itself to reveal the strongest links. The greater the correlation between attachment and a given factor, the stronger the link. Using this analysis, Gallup ranked the aspects of communities that have the strongest links to attachment, understanding that even small differences can be very meaningful.
*The higher the correlation, the more closely the attribute is related to attachment.
9 on twitter: #S ot C Copyright © 2010 Gallup, Inc. All rights reserved.
Community Attribute Correlation to Attachment* 2008 2009 2010 Social Offerings 0.49 0.52 0.54 Openness 0.53 0.52 0.50 Aesthetics 0.51 0.50 0.49 Education 0.47 0.44 0.47 Basic Services 0.41 0.34 0.42 Leadership 0.41 0.40 0.39 Economy 0.41 0.39 0.36 Safety 0.22 0.19 0.23 Social Capital 0.14 0.16 0.15 Civic Involvement 0.06 0.04 0.04
what Matters Most
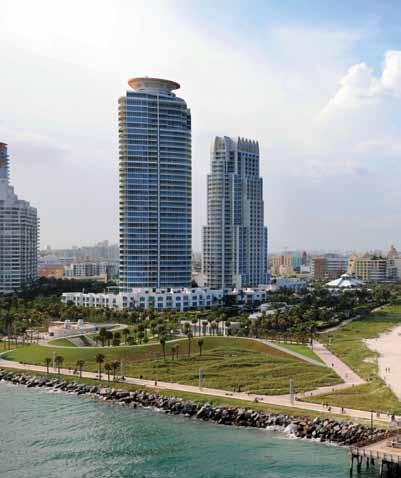
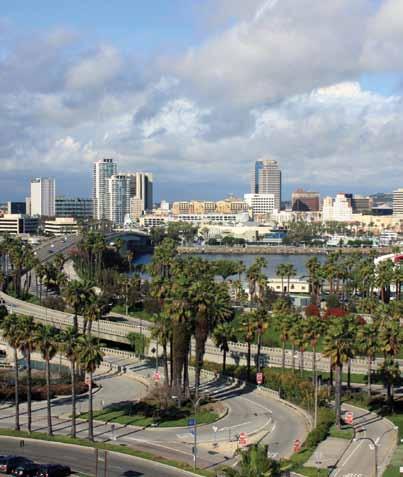
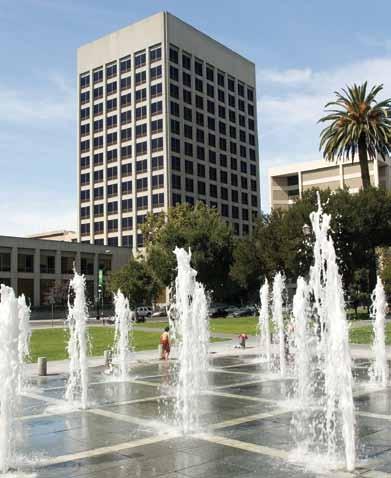
What attaches residents to their communities doesn’t change much from place to place. While one might expect the drivers of attachment would be different in Miami from those in Macon, Ga., in fact the main drivers of attachment differ little across communities. Whether you live in San Jose, Calif., or State College, Pa., the things that connect you to your community are generally the same.
When examining each factor in the study and its relationship to attachment, the same items rise to the top, year after year:
• Social offerings — Places for people to meet each other and the feeling that people in the community care about each other

• openness — How welcoming the community is to different types of people, including families with young children, minorities, and talented college graduates
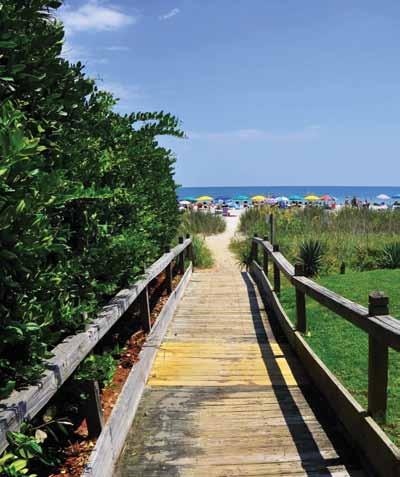
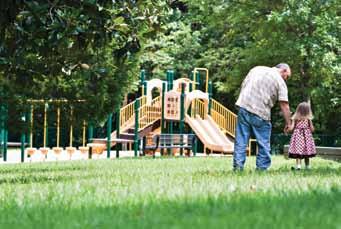
• aesthetics — The physical beauty of the community including the availability of parks and green spaces
10 Soulofthe C o MM unity.org Copyright © 2010 Gallup, Inc. All rights reserved.
Key Drivers of Attachment in 2010 Social o fferings o penness a esthetics Knight Community Attribute Rank in 2010 Overall 1 2 3 Aberdeen, SD 1 3 2 Akron, OH 1 3 1 Biloxi, MS 1 3 2 Boulder, CO 1 3 1 Bradenton, FL 1 3 1 Charlotte, NC 1 3 1 Columbia, SC 1 2 2 Columbus, GA 1 2 2 Detroit, MI 1 2 4 Duluth, MN 1 3 2 Fort Wayne, IN 1 3 2 Gary, IN 1 3 1 Grand Forks, ND 1 3 2 Lexington, KY 1 2 2 City of Long Beach, CA 1 3 1 Macon, GA 1 3 2 Miami, FL 1 2 4 Milledgeville, GA 1 3 2 Myrtle Beach, SC 1 3 2 Palm Beach, FL 1 3 2 Philadelphia, PA 1 2 4 San Jose, CA 1 3 2 St. Paul, MN 1 3 2 State College, PA 1 3 2 Tallahassee, FL 1 2 2 Wichita, KS 1 2 2
While the study also measures perceptions of the local economy and basic services, these three factors are always more important in terms of their relationship to community attachment. This is not to say that communities should focus on building parks when jobs aren’t available. However, it does make it clear that these other factors, beyond basic needs, should be included when thinking about economic growth and development. These seemingly softer needs have an even larger effect than previously thought when it comes to residents’ attachment to their communities.
Generally, demographics are not the strongest drivers of attachment. In almost every community Gallup studied, attachment is more strongly related to certain perceptions of the community than to residents’ age, race, income, or other demographic characteristics. In other words, whether a resident is young or old, wealthy or poor, or black, white, or Hispanic matters less than his or her perceptions of the community. This reality gives community leaders a powerful tool to influence residents’ attachment to the community, no matter who they are.
Key Community attributes
SoCial offeringS INCLUDES PERCEPTIONS OF:
Vibrant nightlife
Good place to meet people
Other people care about each other
Availability of arts and cultural opportunities*
Availability of social community events*
oPenneSS INCLUDES PERCEPTIONS OF:
Good place for older people
Good place for racial and ethnic minorities
Good place for families with young children
Good place for gays and lesbians
Good place for young, talented college graduates looking for work

Good place for immigrants
Good place for young adults without children*
aeSthetiCS INCLUDES PERCEPTIONS OF:
Availability of parks, playgrounds, and trails
Beauty or physical setting
*New in 2010. Not included in overall attribute score to allow for trending to previous years.
11 on twitter: #S ot C Copyright © 2010 Gallup, Inc. All rights reserved.
overall findingS
overall attaChMent
Residents of the Knight communities have expressed a comparable level of overall attachment to their communities in each year of the study. The 2010 mean score of 3.57 out of a possible 5.00 compares with a score of 3.58 in 2009 and 3.56 in 2008. Results reflect surveys conducted in the 26 Knight communities.
For detailed data, visit www.soulofthecommunity.org.
Key driverS of attaChMent
The surveyed communities’ social offerings, openness, aesthetics, and education are, in that order, most likely to influence residents’ attachment to their communities in 2010. Generally, these factors have been in the top four each year of the study.
• Social offerings: Residents rate their communities’ availability of arts and cultural opportunities and social community events highest among social offerings. These are both aspects Gallup asked about for the first time this year. Residents are more positive this year about their communities’ vibrant nightlife, with 3 in 10 rating it positively. They are more negative than positive about whether their communities are good places to meet people, with about 4 in 10 rating this aspect negatively. They have become more negative about their communities as places where people care about each other, with slightly more than 1 in 10 rating this positively.
To see a list of all drivers, turn to page 20.
Social offerings
12 Soulofthe C o MM unity.org Copyright © 2010 Gallup, Inc. All rights reserved.
0 10% 20% 30% 40% 50% 30% 28% 22% 23% 22% 33% 35% 12% 12% 12% 26% 25% 25% 31%
Vibrant Nightlife Good Place
Other
Arts and Cultural Opportunities* Social Community Events* Overall Social Offerings 2008 2009 2010 Percentage of Residents Rating Social Offerings Highly MEAN 2008 2009 2010 1.77 1.76 1.77
*New in 2010. Not included in domain score to allow trending.
to Meet People
People Care About Each Other
openness: Residents’ overall ratings of their communities’ openness in 2010 is on par with results in 2009 and 2008. About one-quarter say their communities are good places for older people, families with young children, young adults without children, and racial and ethnic minorities. Residents are relatively more negative about whether their communities are good places for immigrants and gays and lesbians. However, residents are more likely in 2010 to say their communities are welcoming to gays and lesbians than they were to say so in 2009. They are most negative about whether their communities are good places for talented college graduates looking for work. Almost two-thirds say their communities are not good places for talented college graduates, and these views have grown more negative since last year.
• aesthetics: Residents generally give their communities high marks for aesthetics, and they gave their best ratings this year. Four in 10 residents rate the availability of parks, playgrounds, and trails in their communities positively. They are slightly less positive about the beauty or physical setting of their communities, with more than one-third giving positive ratings.
13 on twitter: #S ot C Copyright © 2010 Gallup, Inc. All rights reserved.
•
0% 10% 20% 30% 40% 50% 24% 24% 20% 21% 20% 25% 20% 19% 16% 18% 22% 21% 20% 25%
openness
Older People Racial and
Minorities Families With Young Children Gays and Lesbians Immigrants Young Adults Without Children* 2008 2009 2010 Percentage of Residents Rating Openness Highly Young, Talented College Graduates Overall Openness 21% 20% 13% 12% 15% 25% 22% 25% aesthetics 0% 10% 20% 30% 40% 50% 36% 38% 35% 36% 35% 40% Parks, Playgrounds, and Trails Overall Aesthetics 2008 2009 2010 Percentage of Residents Rating Aesthetics Highly Beauty or Physical Setting 34% 38% 34% MEAN 2008 2009 2010 1.71 1.72 1.72 MEAN 2008 2009 2010 2.03 2.05 2.08
*New in 2010. Not included in domain score to allow trending.
Ethnic
• education: Education tends to be one of the higher rated key attachment drivers in the Knight communities, with residents almost always rating the quality of colleges and universities higher than the quality of K-12 public schools. Four in 10 residents give their local colleges and universities high ratings, on par with last year. But less than onequarter of residents rate the quality of their communities’ K-12 public schools highly. Nearly half rate their K-12 public schools poorly, and these views have only become more negative since last year.
education
Summary table of Strengths and opportunities
Performance Rating
Drivers positioned farther up are more influential in causing emotional attachment. Drivers positioned farther to the right are rated by respondents as being better performing in a community. A driver that is both influential in causing emotional attachment and not rated as well performing (i.e., one that is positioned in the top left quadrant) represents an area of opportunity as an improvement in performance will have a particularly high impact on improving emotional attachment.
14 Soulofthe C o MM unity.org Copyright © 2010 Gallup, Inc. All rights reserved.
0% 10% 20% 30% 40% 50% 22% 22% 40% 31% 31% 22% Quality of K-12 Public Schools Overall Education 2008 2009 2010 Percentage of Residents Rating Education Highly Quality of Colleges and Universities 39% 31% 40% 1.25 1.45 1.65 1.85 2.05 2.25 2.45 0.0 0.1 0.2 0.3 0.4 0.5 0.6 0.7 Leadership 2010 Economy 2009 Economy 2010 Leadership 2009 Safety 2010 Safety 2009 Basic Services 2010 Basic Services 2009 Social O erings 2010 Social O erings 2009 Openness 2010 Openness 2009 Involvement 2010 Involvement 2009 Social Capital 2010 Social Capital 2009 Aesthetics 2010 Aesthetics 2009 Education 2010 Education 2009 Strength Opportunity
Influence on Community Attachment
MEAN 2008 2009 2010 1.96 1.97 1.96
who iS MoSt attaChed
While demographic characteristics do not have as much effect on attachment as residents’ perceptions of their communities, patterns do emerge among various groups.
• geography: Residents who live within the city limits of their communities tend to have similar attachment to those who live outside the city.
• age: Attachment tends to increase with age. Residents aged 65 and older have the highest attachment scores, on average.
Copyright © 2010 Gallup, Inc. All rights reserved.
1.00 1.50 2.00 2.50 3.00 3.50 4.00 4.50 5.00 3.44 3.64 3.56 3.58 3.56 3.59 City Knight Communities OVERALL 2008 2009 2010 Community Attachment by Geography Non-City 3.55 3.57 3.57 1.00 1.50 2.00 2.50 3.00 3.50 4.00 4.50 5.00 3.46 3.47 3.50 3.58 3.56 3.48 18-34 Knight Communities OVERALL 2008 2009 2010 Community Attachment by Age 35-54 3.52 3.57 3.46 55-64 65+ 3.81 3.81 3.82 3.57 3.59 3.58
• Community tenure: Residents who have lived in the Knight communities for three to five years tend to be the most attached. However, the newest arrivals tend to be the least attached.
• income: Attachment tends to increase with income. Knight community residents with annual household incomes of $75,000 or more tend to be the most attached.
• race and ethnicity: Attachment levels are similar between Hispanics and non-Hispanic whites. However, blacks tend to be less attached than both of these groups.
16 Soulofthe C o MM unity.org Copyright © 2010 Gallup, Inc. All rights reserved. 1.00 1.50 2.00 2.50 3.00 3.50 4.00 4.50 5.00 3.67 3.75 3.59 3.58 3.56 3.62 Hispanic Knight Communities OVERALL 2008 2009 2010 Community Attachment by Race and Ethnicity White Non-Hispanic 3.58 3.57 3.56 Black Non-Hispanic All Other Ethnicities 3.56 3.65 3.66 3.49 3.51 3.43 1.00 1.50 2.00 2.50 3.00 3.50 4.00 4.50 5.00 3.53 3.46 3.68 3.58 3.56 3.49 Less Than 3 Years Knight Communities OVERALL 2008 2009 2010 Community Attachment by Tenure 3-5 Years 3.65 3.57 3.72 6-19 Years 20+ Years 3.55 3.56 3.52 3.63 3.66 3.63
1.00 1.50 2.00 2.50 3.00 3.50 4.00 4.50 5.00 3.47 3.54 3.51 3.58 3.56 3.50 Less Than $25,000 Knight Communities OVERALL 2008 2009 2010 Community Attachment by Annual Household Income $25,000$44,999 3.59 3.57 3.47 $45,000$74,999 $75,000 or More 3.68 3.65 3.66 3.59 3.48 3.50
iMPliCationS for the Knight CoMMunitieS
The implications below reflect the findings from 26 Knight communities, which vary in size and demographics. However, what we learned about the universal importance of three factors — social offerings, openness, and aesthetics — is valuable to leaders anywhere who seek fresh perspectives to improve their communities.
StrengthS to leverage
oPPortunitieS to Prioritize
Residents surveyed continue to be proud of their communities’ parks, playgrounds, and trails. The Knight communities should continue to maintain and promote these offerings, so that even greater numbers of residents feel positively about them. Doing so by way of social offerings that promote diversity could also help communities improve on several dimensions, maximizing the gains for community attachment overall.
Residents continue to give high ratings for their communities’ colleges and universities. The communities should continue to promote higher education offerings among a broader audience and perhaps use these positive perceptions to improve education at the elementary and secondary levels. Doing so could also help communities to attract and retain young adults and families with young children.
Social offerings are an overall positive for the Knight communities, with residents particularly positive about the availability of arts and cultural opportunities and social community events. Further investment in these areas of clear value to residents will help the communities to achieve higher levels of attachment.
Residents’ mixed responses about their communities’ openness could be inhibiting their desires to stay in their community and to recommend it to others. Active and visible efforts to promote tolerance and diversity within the communities could improve the perception that the communities are welcoming places for all groups, which will also help to attract a larger cross section of individuals to the communities.
Because the Knight communities also tend to struggle with the perception that people in the community care about each other, events that bring people together to foster more interaction and understanding are likely to have a compounding effect on community attachment.
Leaders also have much to gain by improving perceptions of the quality of K-12 education in their communities. Not only will this increase attachment overall, but a more positive view of public schools can also help attract families that will help raise the next generation of talent in the communities.
17 on twitter: #S ot C Copyright © 2010 Gallup, Inc. All rights reserved.


SnaPShotS of the Knight CoMMunitieS
The following pages contain brief data highlights for each of the 26 communities in the study. For detailed results by community, please visit www.soulofthecommunity.org.

aberdeen, South daKota
For detailed results for Aberdeen, visit www.soulofthecommunity.org/aberdeen.
aKron, ohio
For detailed results for Akron, visit www.soulofthecommunity.org/akron.
20 Soulofthe C o MM unity.org Copyright © 2010 Gallup, Inc. All rights reserved.
0% 20% 40% 60% 80% 100% 28.3% 43.5% 25.0% 40.7% 31.7% 28.2% 2008 CA Mean Not Attached Neutral Attached Attachment Over Time 41.7% 27.6% 33.3% 2009 2010 3.84 3.91 3.90 0% 20% 40% 60% 80% 100% 50.9% 30.1% 47.4% 34.4% 17.6% 19.0% 2008 CA Mean Not Attached Neutral Attached Attachment Over Time 33.7% 48.0% 18.9% 2009 2010 3.40 3.42 3.41 Community Attribute Rank 2008 2009 2010 Aesthetics 5 3 2 Basic Services 6 6 5 Economy 7 7 7 Education 3 4 4 Involvement 10 10 10 Leadership 4 5 6 Openness 2 2 3 Safety 9 8 8 Social Capital 8 9 9 Social Offerings 1 1 1 Opportunities (strong
to attachment, low performance) Strengths (strong link to attachment, high performance) Community Attribute Rank 2008 2009 2010 Aesthetics 1 2 2 Basic Services 5 5 5 Economy 7 7 7 Education 4 4 4 Involvement 10 10 10 Leadership 6 6 6 Openness 3 3 3 Safety 8 8 8 Social Capital 9 9 9 Social Offerings 2 1 1 Opportunities
low performance) Strengths (strong link to attachment, high performance)
link
(strong link to attachment,
biloxi, MiSSiSSiPPi
For detailed results for Biloxi, visit www.soulofthecommunity.org/biloxi.
boulder, Colorado
For detailed results for Boulder, visit www.soulofthecommunity.org/boulder.
21 on twitter: #S ot C Copyright © 2010 Gallup, Inc. All rights reserved.
0% 20% 40% 60% 80% 100% 32.0% 31.5% 27.3% 24.9% 38.8% 36.5% 2008 CA Mean Not Attached Neutral Attached Attachment Over Time 39.7% 36.2% 33.1% 2009 2010 3.89 3.87 3.79 0% 20% 40% 60% 80% 100% 32.4% 36.1% 27.2% 38.7% 40.5% 31.5% 2008 CA Mean Not Attached Neutral Attached Attachment Over Time 39.0% 20.9% 33.8% 2009 2010 3.84 3.89 3.99 Community Attribute Rank 2008 2009 2010 Aesthetics 5 3 2 Basic Services 6 6 5 Economy 7 7 7 Education 3 4 4 Involvement 10 10 10 Leadership 4 5 6 Openness 2 2 3 Safety 9 8 8 Social Capital 8 9 9 Social Offerings 1 1 1 Opportunities (strong link to attachment, low performance) Strengths (strong link to attachment, high performance) Community Attribute Rank 2008 2009 2010 Aesthetics 1 2 2 Basic Services 5 5 5 Economy 7 7 7 Education 4 4 4 Involvement 10 10 10 Leadership 6 6 6 Openness 3 3 3 Safety 8 8 8 Social Capital 9 9 9 Social Offerings 2 1 1 Opportunities (strong
attachment, low performance) Strengths (strong link to attachment, high performance)
link to
bradenton, florida
For detailed results for Bradenton, visit www.soulofthecommunity.org/bradenton.
Charlotte, north Carolina
For detailed results for Charlotte, visit www.soulofthecommunity.org/charlotte.
22 Soulofthe C o MM unity.org Copyright © 2010 Gallup, Inc. All rights reserved.
0% 20% 40% 60% 80% 100% 34.5% 30.2% 24.6% 34.1% 39.3% 35.4% 2008 CA Mean Not Attached Neutral Attached Attachment Over Time 32.8% 26.6% 42.6% 2009 2010 3.79 4.04 3.98 0% 20% 40% 60% 80% 100% 32.8% 35.8% 31.8% 38.7% 25.8% 31.4% 2008 CA Mean Not Attached Neutral Attached Attachment Over Time 39.3% 35.5% 28.9% 2009 2010 3.74 3.74 3.70 Community Attribute Rank 2008 2009 2010 Aesthetics 1 2 2 Basic Services 5 5 5 Economy 7 7 7 Education 4 4 4 Involvement 10 10 10 Leadership 6 6 6 Openness 3 3 3 Safety 8 8 8 Social Capital 9 9 9 Social Offerings 2 1 1 Opportunities (strong link to attachment, low performance) Strengths (strong link to attachment, high performance) Community Attribute Rank 2008 2009 2010 Aesthetics 2 2 2 Basic Services 7 6 6 Economy 6 7 7 Education 3 3 4 Involvement 10 10 10 Leadership 5 5 5 Openness 4 1 3 Safety 8 8 8 Social Capital 9 9 9 Social Offerings 1 4 1 Opportunities (strong
attachment, low performance) Strengths (strong link to attachment, high performance)
link to
ColuMbia, South Carolina
For detailed results for Columbia, visit www.soulofthecommunity.org/columbia.
ColuMbuS, georgia
For detailed results for Columbus, visit www.soulofthecommunity.org/columbus.
23 on twitter: #S ot C Copyright © 2010 Gallup, Inc. All rights reserved.
0% 20% 40% 60% 80% 100% 33.3% 33.3% 30.6% 32.6% 29.4% 33.4% 2008 CA Mean Not Attached Neutral Attached Attachment Over Time 40.5% 38.0% 28.9% 2009 2010 3.77 3.78 3.69 0% 20% 40% 60% 80% 100% 32.0% 34.1% 32.1% 36.3% 33.2% 34.0% 2008 CA Mean Not Attached Neutral Attached Attachment Over Time 32.7% 30.5% 35.3% 2009 2010 3.80 3.84 3.86 Community Attribute Rank 2008 2009 2010 Aesthetics 3 4 2 Basic Services 5 3 4 Economy 6 7 6 Education 3 5 5 Involvement 10 10 10 Leadership 7 6 7 Openness 2 2 2 Safety 8 8 9 Social Capital 9 9 8 Social Offerings 1 1 1 Opportunities (strong link to attachment, low performance) Strengths (strong link to attachment, high performance) Community Attribute Rank 2008 2009 2010 Aesthetics 3 4 2 Basic Services 5 3 4 Economy 6 7 6 Education 3 5 5 Involvement 10 10 10 Leadership 7 6 7 Openness 2 2 2 Safety 8 8 9 Social Capital 9 9 8 Social Offerings 1 1 1 Opportunities (strong
to attachment, low performance) Strengths (strong link to attachment, high performance)
link
detroit, MiChigan
For detailed results for Detroit, visit www.soulofthecommunity.org/detroit.
duluth, MinneSota
For detailed results for Duluth, visit www.soulofthecommunity.org/duluth.
24 Soulofthe C o MM unity.org Copyright © 2010 Gallup, Inc. All rights reserved.
0% 20% 40% 60% 80% 100% 63.4% 24.8% 58.7% 26.9% 12.4% 11.8% 2008 CA Mean Not Attached Neutral Attached Attachment Over Time 27.6% 60.8% 13.6% 2009 2010 3.02 3.11 3.08 0% 20% 40% 60% 80% 100% 26.9% 42.9% 31.2% 38.0% 31.1% 30.2% 2008 CA Mean Not Attached Neutral Attached Attachment Over Time 40.9% 30.9% 27.9% 2009 2010 3.89 3.79 3.77 Community Attribute Rank 2008 2009 2010 Aesthetics 4 3 4 Basic Services 5 6 5 Economy 7 7 7 Education 3 4 3 Involvement 10 10 10 Leadership 6 5 6 Openness 1 1 2 Safety 8 8 8 Social Capital 9 9 9 Social Offerings 2 2 1 Opportunities (strong link to attachment, low performance) Strengths (strong link to attachment, high performance) Community Attribute Rank 2008 2009 2010 Aesthetics 5 3 2 Basic Services 6 6 5 Economy 7 7 7 Education 3 4 4 Involvement 10 10 10 Leadership 4 5 6 Openness 2 2 3 Safety 9 8 8 Social Capital 8 9 9 Social Offerings 1 1 1 Opportunities (strong link to attachment, low performance) Strengths (strong link to attachment, high performance)
fort wayne, indiana
For detailed results for Fort Wayne, www.soulofthecommunity.org/fort-wayne.
gary, indiana
For detailed results for Gary, www.soulofthecommunity.org/gary.
25 on twitter: #S ot C Copyright © 2010 Gallup, Inc. All rights reserved.
0% 20% 40% 60% 80% 100% 39.6% 36.0% 36.3% 47.6% 25.9% 24.4% 2008 CA Mean Not Attached Neutral Attached Attachment Over Time 46.2% 26.5% 17.4% 2009 2010 3.60 3.64 3.79 0% 20% 40% 60% 80% 100% 65.1% 26.3% 66.9% 17.8% 13.6% 8.7% 2008 CA Mean Not Attached Neutral Attached Attachment Over Time 23.6% 68.6% 9.6% 2009 2010 2.90 2.80 2.80 Community Attribute Rank 2008 2009 2010 Aesthetics 5 3 2 Basic Services 6 6 5 Economy 7 7 7 Education 3 4 4 Involvement 10 10 10 Leadership 4 5 6 Openness 2 2 3 Safety 9 8 8 Social Capital 8 9 9 Social Offerings 1 1 1 Opportunities (strong link to attachment, low performance) Strengths (strong link to attachment, high performance) Community Attribute Rank 2008 2009 2010 Aesthetics 1 2 2 Basic Services 5 5 5 Economy 7 7 7 Education 4 4 4 Involvement 10 10 10 Leadership 6 6 6 Openness 3 3 3 Safety 8 8 8 Social Capital 9 9 9 Social Offerings 2 1 1 Opportunities
low
Strengths
attachment, high performance)
(strong link to attachment,
performance)
(strong link to
grand forKS, north daKota
For detailed results for Grand Forks, visit www.soulofthecommunity.org/grand-forks.
lexington, KentuCKy
For detailed results for Lexington, visit www.soulofthecommunity.org/lexington.
26 Soulofthe C o MM unity.org Copyright © 2010 Gallup, Inc. All rights reserved.
0% 20% 40% 60% 80% 100% 29.9% 41.3% 20.1% 44.2% 35.4% 28.8% 2008 CA Mean Not Attached Neutral Attached Attachment Over Time 43.6% 20.4% 36.4% 2009 2010 3.80 4.03 4.00 0% 20% 40% 60% 80% 100% 26.2% 42.7% 29.9% 39.5% 32.3% 31.1% 2008 CA Mean Not Attached Neutral Attached Attachment Over Time 38.4% 28.2% 31.6% 2009 2010 3.87 3.89 3.85 Community Attribute Rank 2008 2009 2010 Aesthetics 5 3 2 Basic Services 6 6 5 Economy 7 7 7 Education 3 4 4 Involvement 10 10 10 Leadership 4 5 6 Openness 2 2 3 Safety 9 8 8 Social Capital 8 9 9 Social Offerings 1 1 1 Opportunities (strong link to attachment, low performance) Strengths (strong link to attachment, high performance) Community Attribute Rank 2008 2009 2010 Aesthetics 3 4 2 Basic Services 5 3 4 Economy 6 7 6 Education 3 5 5 Involvement 10 10 10 Leadership 7 6 7 Openness 2 2 2 Safety 8 8 9 Social Capital 9 9 8 Social Offerings 1 1 1 Opportunities (strong link to attachment, low performance) Strengths (strong link to attachment, high performance)
City of long beaCh, California
For detailed results for the City of Long Beach, visit www.soulofthecommunity.org/long-beach.
MaCon, georgia
For detailed results for Macon, visit www.soulofthecommunity.org/macon.
27 on twitter: #S ot C Copyright © 2010 Gallup, Inc. All rights reserved.
0% 20% 40% 60% 80% 100% 26.9% 37.6% 24.1% 39.8% 38.5% 35.5% 2008 CA Mean Not Attached Neutral Attached Attachment Over Time 43.1% 21.7% 32.8% 2009 2010 3.91 3.92 3.97 0% 20% 40% 60% 80% 100% 44.4% 32.7% 56.3% 24.5% 19.2% 22.8% 2008 CA Mean Not Attached Neutral Attached Attachment Over Time 25.5% 56.3% 18.2% 2009 2010 3.49 3.22 3.17 Community Attribute Rank 2008 2009 2010 Aesthetics 1 2 2 Basic Services 5 5 5 Economy 7 7 7 Education 4 4 4 Involvement 10 10 10 Leadership 6 6 6 Openness 3 3 3 Safety 8 8 8 Social Capital 9 9 9 Social Offerings 2 1 1 Opportunities (strong link to attachment, low performance) Strengths (strong link to attachment, high performance) Community Attribute Rank 2008 2009 2010 Aesthetics 5 3 2 Basic Services 6 6 5 Economy 7 7 7 Education 3 4 4 Involvement 10 10 10 Leadership 4 5 6 Openness 2 2 3 Safety 9 8 8 Social Capital 8 9 9 Social Offerings 1 1 1 Opportunities (strong link to attachment, low performance) Strengths (strong link to attachment, high performance)
MiaMi, florida
For detailed results for Miami, visit www.soulofthecommunity.org/miami.
Milledgeville, georgia
For detailed results for Milledgeville, visit www.soulofthecommunity.org/milledgeville.
28 Soulofthe C o MM unity.org Copyright © 2010 Gallup, Inc. All rights reserved.
0% 20% 40% 60% 80% 100% 45.0% 32.4% 39.7% 30.9% 23.0% 22.6% 2008 CA Mean Not Attached Neutral Attached Attachment Over Time 32.8% 46.1% 27.4% 2009 2010 3.46 3.62 3.43 0% 20% 40% 60% 80% 100% 39.6% 33.3% 35.9% 21.2% 25.3% 27.1% 2008 CA Mean Not Attached Neutral Attached Attachment Over Time 33.2% 53.5% 30.9% 2009 2010 3.65 3.69 3.38 Community Attribute Rank 2008 2009 2010 Aesthetics 4 3 4 Basic Services 5 6 5 Economy 7 7 7 Education 3 4 3 Involvement 10 10 10 Leadership 6 5 6 Openness 1 1 2 Safety 8 8 8 Social Capital 9 9 9 Social Offerings 2 2 1 Opportunities (strong link to attachment, low performance) Strengths (strong link to attachment, high performance) Community Attribute Rank 2008 2009 2010 Aesthetics 5 3 2 Basic Services 6 6 5 Economy 7 7 7 Education 3 4 4 Involvement 10 10 10 Leadership 4 5 6 Openness 2 2 3 Safety 9 8 8 Social Capital 8 9 9 Social Offerings 1 1 1 Opportunities (strong link to attachment, low performance) Strengths (strong link to attachment, high performance)
Myrtle beaCh, South Carolina
For detailed results for Myrtle Beach, visit www.soulofthecommunity.org/myrtle-beach.
PalM beaCh, florida
For detailed results for Palm Beach, visit www.soulofthecommunity.org/palm-beach.
29 on twitter: #S ot C Copyright © 2010 Gallup, Inc. All rights reserved.
0% 20% 40% 60% 80% 100% 26.0% 32.4% 28.9% 34.5% 34.1% 41.6% 2008 CA Mean Not Attached Neutral Attached Attachment Over Time 31.8% 31.4% 39.3% 2009 2010 3.96 3.87 3.82 0% 20% 40% 60% 80% 100% 30.2% 36.3% 32.5% 33.8% 32.1% 33.4% 2008 CA Mean Not Attached Neutral Attached Attachment Over Time 41.3% 34.1% 26.2% 2009 2010 3.78 3.73 3.80 Community Attribute Rank 2008 2009 2010 Aesthetics 5 3 2 Basic Services 6 6 5 Economy 7 7 7 Education 3 4 4 Involvement 10 10 10 Leadership 4 5 6 Openness 2 2 3 Safety 9 8 8 Social Capital 8 9 9 Social Offerings 1 1 1 Opportunities (strong link to attachment, low performance) Strengths (strong link to attachment, high performance) Community Attribute Rank 2008 2009 2010 Aesthetics 2 2 2 Basic Services 7 6 6 Economy 6 7 7 Education 3 3 4 Involvement 10 10 10 Leadership 5 5 5 Openness 4 1 3 Safety 8 8 8 Social Capital 9 9 9 Social Offerings 1 4 1 Opportunities (strong link to attachment, low performance) Strengths (strong link to attachment, high performance)
PhiladelPhia, PennSylvania
For detailed results for Philadelphia, visit www.soulofthecommunity.org/philadelphia.
San JoSe, California
For detailed results for San Jose, visit www.soulofthecommunity.org/san-jose.
30 Soulofthe C o MM unity.org Copyright © 2010 Gallup, Inc. All rights reserved.
0% 20% 40% 60% 80% 100% 40.8% 36.7% 43.1% 37.4% 21.2% 22.4% 2008 CA Mean Not Attached Neutral Attached Attachment Over Time 38.5% 41.4% 18.5% 2009 2010 3.54 3.52 3.52 0% 20% 40% 60% 80% 100% 28.3% 42.4% 31.6% 43.5% 27.1% 29.3% 2008 CA Mean Not Attached Neutral Attached Attachment Over Time 39.7% 29.3% 28.8% 2009 2010 3.88 3.85 3.84 Community Attribute Rank 2008 2009 2010 Aesthetics 4 3 4 Basic Services 5 6 5 Economy 7 7 7 Education 3 4 3 Involvement 10 10 10 Leadership 6 5 6 Openness 1 1 2 Safety 8 8 8 Social Capital 9 9 9 Social Offerings 2 2 1 Opportunities (strong link to attachment, low performance) Strengths (strong link to attachment, high performance) Community Attribute Rank 2008 2009 2010 Aesthetics 2 2 2 Basic Services 7 6 6 Economy 6 7 7 Education 3 3 4 Involvement 10 10 10 Leadership 5 5 5 Openness 4 1 3 Safety 8 8 8 Social Capital 9 9 9 Social Offerings 1 4 1 Opportunities (strong link to attachment, low performance) Strengths (strong link to attachment, high performance)
St. Paul, MinneSota
For detailed results for St. Paul, visit www.soulofthecommunity.org/st-paul.
State College, PennSylvania
For detailed results for State College, visit www.soulofthecommunity.org/state-college.
31 on twitter: #S ot C Copyright © 2010 Gallup, Inc. All rights reserved.
0% 20% 40% 60% 80% 100% 29.9% 38.7% 28.5% 43.4% 30.7% 31.4% 2008 CA Mean Not Attached Neutral Attached Attachment Over Time 42.8% 25.9% 28.7% 2009 2010 3.82 3.82 3.90 0% 20% 40% 60% 80% 100% 24.2% 46.5% 18.5% 33.8% 43.8% 29.2% 2008 CA Mean Not Attached Neutral Attached Attachment Over Time 46.0% 22.5% 35.5% 2009 2010 3.90 4.00 4.08 Community Attribute Rank 2008 2009 2010 Aesthetics 2 2 2 Basic Services 7 6 6 Economy 6 7 7 Education 3 3 4 Involvement 10 10 10 Leadership 5 5 5 Openness 4 1 3 Safety 8 8 8 Social Capital 9 9 9 Social Offerings 1 4 1 Opportunities (strong link to attachment, low performance) Strengths (strong link to attachment, high performance) Community Attribute Rank 2008 2009 2010 Aesthetics 5 3 2 Basic Services 6 6 5 Economy 7 7 7 Education 3 4 4 Involvement 10 10 10 Leadership 4 5 6 Openness 2 2 3 Safety 9 8 8 Social Capital 8 9 9 Social Offerings 1 1 1 Opportunities (strong link to attachment, low performance) Strengths (strong link to attachment, high performance)
tallahaSSee, florida
For detailed results for Tallahassee, visit www.soulofthecommunity.org/tallahassee.
wiChita, KanSaS
For detailed results for Wichita, visit www.soulofthecommunity.org/wichita.
32 Soulofthe C o MM unity.org Copyright © 2010 Gallup, Inc. All rights reserved.
0% 20% 40% 60% 80% 100% 35.0% 34.8% 31.9% 34.9% 32.5% 30.2% 2008 CA Mean Not Attached Neutral Attached Attachment Over Time 41.3% 32.6% 26.9% 2009 2010 3.72 3.78 3.83 0% 20% 40% 60% 80% 100% 33.6% 42.6% 45.4% 35.6% 30.2% 23.8% 2008 CA Mean Not Attached Neutral Attached Attachment Over Time 35.0% 34.2% 19.6% 2009 2010 3.73 3.50 3.73 Community Attribute Rank 2008 2009 2010 Aesthetics 3 4 2 Basic Services 5 3 4 Economy 6 7 6 Education 3 5 5 Involvement 10 10 10 Leadership 7 6 7 Openness 2 2 2 Safety 8 8 9 Social Capital 9 9 8 Social Offerings 1 1 1 Opportunities (strong link to attachment, low performance) Strengths (strong link to attachment, high performance) Community Attribute Rank 2008 2009 2010 Aesthetics 3 4 2 Basic Services 5 3 4 Economy 6 7 6 Education 3 5 5 Involvement 10 10 10 Leadership 7 6 7 Openness 2 2 2 Safety 8 8 9 Social Capital 9 9 8 Social Offerings 1 1 1 Opportunities (strong link to attachment, low performance) Strengths (strong link to attachment, high performance)
The 26 Knight communities are grouped based on their population size and density. This section summarizes results for the groups of comparable communities.

COMPARISON GROUP OVERALL
Community Attachment
COMPARISON GROUP OVERALL
Community Attachment
Copyright © 2010 Gallup, Inc. All rights reserved. 0% 20% 40% 60% 80% 100% 41% 37% 61% 32% 18% 21% 46% 31% 23% Not Attached Neutral Attached
VERY LARGE POPULATION — VERY HIGH URBAN DENSITY 27% 50% 12% Philadelphia, PA Miami, FL Detroit, MI Knight Communities OVERALL Note: Due to rounding, the percentages may add up to 100% ± 1%.
0% 20% 40% 60% 80% 100% 26% 43% 29% 41% 29% 31% 36% 39% 26% 34% 34% 32% Not Attached Neutral Attached
LARGE POPULATION — VERY HIGH URBAN DENSITY 44% 30% 27% St. Paul, MN Charlotte, NC Palm Beach, FL San Jose,
Knight Communities OVERALL Note: Due to rounding, the percentages may add up to 100% ± 1%.
CA
2010 3.52 3.43 3.08 3.32 2009 3.52 3.62 3.11 3.37 2008 3.54 3.46 3.02 3.31 2010 3.90 3.70 3.80 3.84 3.83 2009 3.82 3.74 3.73 3.85 3.80 2008 3.82 3.74 3.78 3.88 3.81
34 Soulofthe C o MM unity.org Copyright © 2010 Gallup, Inc. All rights reserved. 0% 20% 40% 60% 80% 100% 28% 41% 31% 25% 39% 32% 31% 35% 34% 23% 34% 44% 54% 21% 25% 20% 44% 35% Not Attached Neutral Attached Community Attachment LOW/MEDIUM POPULATION — LOW/MEDIUM URBAN DENSITY 38% 36% 25% 19% 56% 48% 26% 27% 36% 31% 33% 31% Aberdeen,SDMyrtleBeach,SCStateCollege,PAMilledgeville,GAGrandForks,NDDuluth,MNBiloxi,MSMacon,GAFortWayne,INKnightCommunitiesOVERALL Note: Due to rounding, the percentages may add up to 100% ± 1%. COMPARISON GROUP OVERALL 2010 3.90 3.82 4.08 3.38 4.00 3.77 3.79 3.17 3.79 3.74 2009 3.91 3.87 4.00 3.69 4.03 3.79 3.87 3.22 3.64 3.73 2008 3.84 3.96 3.90 3.65 3.80 3.89 3.89 3.49 3.60 3.77 0% 20% 40% 60% 80% 100% 27% 34% 48% 32% 28% 39% 22% 40% 39% 21% 39% 41% Not Attached Neutral Attached Community Attachment MEDIUM POPULATION — VERY HIGH URBAN DENSITY 34% 41% 18% 69% 18% 14% Bradenton,FL Cityof LongBeach,CA Boulder,CO Akron,OH Gary,IN Knight Communities OVERALL Note: Due to rounding, the percentages may add up to 100% ± 1%. COMPARISON GROUP OVERALL 0% 20% 40% 60% 80% 100% 31% 36% 38% 36% 30% 33% 33% 35% 33% 28% 40% 32% Not Attached Neutral Attached Community Attachment MEDIUM POPULATION — HIGH URBAN DENSITY 33% 34% 35% 31% 34% 29% Columbus,GA Tallahassee,FL Lexington,KY Columbia,SC Wichita,KS Knight Communities OVERALL Note: Due to rounding, the percentages may add up to 100% ± 1%. COMPARISON GROUP OVERALL 2010 3.98 3.97 3.99 3.41 2.80 3.56 2009 4.04 3.92 3.89 3.42 2.80 3.53 2008 3.79 3.91 3.84 3.40 2.90 3.51 2010 3.86 3.83 3.85 3.69 3.73 3.77 2009 3.84 3.78 3.89 3.78 3.50 3.74 2008 3.80 3.72 3.87 3.77 3.73 3.78
Methodology
the gallup study is a 15-minute phone survey conducted in the 26 communities the John S. and James l. Knight foundation serves. the survey is available in english and Spanish, and both landlines and cell phones are called.


each year, a random sample of at least 400 residents, aged 18 and older, is interviewed in each community, with additional interviews conducted in selected resident communities. in 2010, 15,200 interviews were conducted, with 1,000 conducted in eight resident communities. the 2010 study also included 200 interviews among residents aged 18 to 34 in the resident communities to give gallup more information about that age group. overall data were adjusted to ensure an accurate representation of the real demographic makeup of each community based on u.S. Census bureau data.
gallup also used u.S. Census classifications to choose the geographical area included in each community. for the most part, gallup used the Metropolitan Statistical area. however, in a few cases, gallup used other accepted definitions of the community area. these census definitions allow gallup to compare other information such as local gdP and population growth so that gallup can more closely examine community attachment and key community outcomes.
35 on twitter: #S ot C
36 Soulofthe C o MM unity.org Copyright © 2010 Gallup, Inc. All rights reserved.
the
Knight foundation
John S. and James L. Knight Foundation advances journalism in the digital age and invests in the vitality of communities where the Knight brothers owned newspapers. Knight Foundation focuses on projects that promote informed and engaged communities and lead to transformational change. For more, visit www.knightfoundation.org Contact us: soul@knightfoundation.org Join the conversation on Twitter via the hashtag #SOTC
about
John S. and James l.
The
