
Visitors Survey Prepared for:
Downtown West Palm Beach On-site


2 Table of Contents Background & Objectives 3 Methodology 4 How To Read This Report 5 Summary of Findings 6 Visitation 9 Characteristics of Visit 16 Image 21 Ratings of Downtown West Palm Beach 25 Future Visitation 30 Lifestyle 33 Residency 38 Demographics 41

3 Background and Objectives The City of West Palm Beach offers a variety of community events in downtown West Palm Beach. The City seeks to better understand visitors to specific events held in the downtown area (Clematis District and the Waterfront). These events include: • Clematis By Night • West Palm Beach Greenmarket • Screen on the Green • Sunday on the Waterfront Specific informational goals for each event include: • Motivations to attend • Sources of event information (TV, radio, newspaper, online, WOM, etc.) Satisfaction (overall and specific components such as entertainment, food, beverage, etc.) Visitor lifestyle (media, visit locations, other events, etc.) Visitor demographic profile (age, income, race/ethnicity, presence of children, etc.) Visitor residency (County vs. Out-of-County, Full-time vs. Part-time) • Economic impact to the area


4 Methodology Who? What? Where? When? 2021: 158 visitors to Downtown West Palm Beach 15 minute personal intercept Chancesurvey to win one of five $100 gift card to downtown business offered to promote participation Rotation across locations throughout each area Locations: • The Square • Clematis District • Greenmarket • Sunday on the Waterfront • Screen on the Green
Saturday, December 4, The Square (10am to 2pm) Thursday, December 16, Clematis District (5pm to 9pm) Friday, December 17, Clematis District (10am to 2pm) Saturday, December 18, Greenmarket (9am to 1pm) Sunday, December 19, Sunday on the Waterfront (4pm to 7pm) Friday, January 7, The Square (10am to 2pm) Saturday, January 8, The Square (6pm to 10pm) Friday, January 14, Screen on the Green (6pm to 10pm)


5 How To Read This Report Significance testing has been conducted among the various subgroups presented. Letters denote a significant difference versus the subgroup indicated at the 95% level of confidence. Sampling error of no greater than +/- 7.8% in total at the 95% level of Theconfidence.term“Top 2 Box” refers to respondents providing a 9 or 10 rating (on a 10 point scale) on a particular question/topic. Several subgroups are presented in this report: • Visit Condition (interview conducted during a Special Event, at The Square or in the Clematis District, not during a Special Event) The following subgroups were reviewed (data available in the cross-tabulation reports) and, depending on relevance, may or may not be presented herein: • Trending by Survey Year • The Square/Clematis District Day of Week (Weekday, Weekend) and Time of Day (Lunch, Afternoon, Evening) • Demographics • Top Areas/Zip Codes of Residence
Findings
Summary of


However,
Visitors
Significant
Overall
While
7
Perceptions of the Downtown Area Are Steadily Improving Atmosphere Remains The Main Area Draw to Downtown enjoy the downtown area due to the atmosphere and scenery, and three-quarters would recommend their friends and family visit downtown West Palm Beach. Street and The Square are Becoming More of a Primary Draw while Events are Becoming Less of a Draw increases are seen in reported visitation to Clematis Street and The Square, while visits to Clematis by Night/Concert have dropped significantly compared to 2019. More Events Would Bring More Visitors the visitors we spoke with were visiting for various reasons, many planned to attend an event at some point in the day. And more than two-in-five visitors said more events in general as well as more free events would encourage them to visit the area more often.
Clematis
8 Keep Focusing on Events and Getting The Word Out via Social Media To
Increase Downtown Visitation Even More
Parking Continues to be the Main Weak Point Visitors were more likely to cite parking as a weak point for the area this year. They were also more likely to suggest free parking as something that would encourage them to visit Downtown West Palm Beach more often. Social Media is the Main Source of Information when Learning About What’s Happening
Downtown Area Improvements Are Making an Impact Visitors are significantly more likely to cite the area’s cleanliness and safety as strengths this year and over two-thirds report feeling safe visiting downtown despite the COVID-19 pandemic.
Downtown Social media and other Internet sources are the primary channels used to learn about local goings-on among younger visitors. While its popularity is declining, Facebook, along with Instagram, is the most widely-used platforms among visitors to the area. Despite the adoption of social media rising among older visitors, they still prefer to get their news via TV and print media.
Visitation

10 Special Events The Square Clematis Street A B C (n=58) (n=61) (n=39) The Majority of Those Visiting Downtown Live or Work There and, therefore, are Repeat Visitors First time visitation remains unchanged compared to 2019. Q3b First SignificancevisitTesting at 95% Level of Confidence Between the Columns (ABC) ↑ ↓ Change versus 2019 RepeatTimeFirst9%91% 10% 12% 3% 26% 30% 23% 64% 59% 74% First Time Repeat Live/Work Downtown Total 2021 (n=158) First Time Visitation to West Palm Beach DowntownLive/Work65%
11 Compared to 2019, Significantly More Repeat Visitors Said They’d Visited Downtown West Palm Beach Within the Last Month On average, people come to downtown West Palm Beach every two weeks. However, those visiting the Square tend to frequent the area around once a week. Q3c Time of Past visit / Q3d Number of visits in past year • **Caution Very low base (under 30) Significance Testing at 95% Level of Confidence Between the Columns (ABC) ↑ ↓ Change versus 2019 26% 43% 12% 17% 2% Past week Past month Pastmonthsthree Past year Longer ago than that Visitation History 2021 Analysis By Venue Total SpecialEvents SquareThe ClematisStreet (n=42) (n=15**) (n=18**) (n=9**) A B C How many times would you say you have visited downtown West Palm beach in the past year? (Among those who have visited in the past year but do not live/work in downtown West Palm Beach) Average number of visits 21.2 10.7 34.2 11.4 When was the last time you came to downtown West Palm Beach? (Among repeat visitors who do not live/work in downtown West Palm Beach) Past week 26% 7% 39% 33% Past month 43% 47% 56% 11% Past 3 months 12% 27% 6% Past year 17% 20% 44% Longer ago than past year 2% - - 11% When was the last time you visited downtown West Palm Beach? Among repeat visitors who do not live/work in downtown West Palm Beach (n=42)
12 42% 25% 18% 4% 3% 2% 0% 7% In 2021, The Area Itself is the Main Reason for Visitation What is your MAIN reason for visiting the downtown area today? Top Mentions Total Respondents (n=158) CommunityMunicipal/ Events IceRestaurants/Cream/Coffee Workplacesrelated Entertainment Shopping NightclubsBars/ All others Q4a Main reason for visiting today • **Caution Very low base (under 30) ↑ ↓ Change versus 2019 2021 Top Municipal/CommunityMentions Events Dining Clematis Street (general) Square/TheCityPlace16%/RosemarySquare(general) 15% Greenmarket 9% Clematis by Night/Concert 6% Starbucks Cheesecake2%Factory 1% Rocco's Tacos 1% Grease Burger Bar 1% Special Event Visitors: • 32% of The Square visitors stated that their primary reason for the visit was the Square. (n=38) • 65% of Greenmarket visitors stated that their primary reason for the visit was for the Greenmarket. (n=20**) • 42% of Sunday on the Waterfront visitors stated that their primary reason for the visit was for Sunday on the Waterfront. (n=19**)

13 76% 74% 68% 37% 7% 6% 1% 8% In Addition to the Draw of The Area Itself, Many are Visiting For Dining and Events Total places have visited/will visit today in the downtown area Total Respondents (n=158) CommunityMunicipal/ IceRestaurants/Cream/Coffee Events Entertainment Workplacesrelated Shopping NightclubsBars/ All others Q4a/b/c Events/places/establishments visited on that day Multiple Responses Accepted ↑ ↓ Change versus 2019 2021 Top Municipal/CommunityMentions Dining Events Entertainment Clematis Street (general) 47% Rosemary Square 44% Cheesecake Factory 18% Duffy’s 15% Clematis by Night/Concert Greenmarket30% 27% Muvico 16% Kravis Center for the Performing Arts 15% Improv Comedy Club 12%

14 76% 67% 60% 35% 11% 6% 1% 10% The Dining Scene is Alive and Well, with Most Visitors Going To a Restaurant or Dining Establishment at Some Point During Their Trip The number citing dining, entertainment, as well as the area itself has increased compared to 2019. Total places have visited/will visit today in the downtown area Among those who were surveyed in The Square or Clematis Street1 (n=100) IceRestaurants/Cream/Coffee CommunityMunicipal/ Events Entertainment Work related places Shopping NightclubsBars/ All others Q4a/b/c Events/places/establishments visited on that day 1 excluding those surveyed at special events Multiple Responses Accepted 2021 Top Mentions Dining Municipal/Community Events Entertainment Starbucks 36% Duffy’s 22% The Square 63% Clematis Street 55% Clematis by Night/Concert 48% Greenmarket 35% Muvico 43% Kravis Center for the Performing Arts 31% ↑ ↓ Change versus 2019

15 93% 93% 88% 74% 14% 13% 0% 7% Community and Dining Options are the Two Largest Draws to the Area Rosemary Square and Clematis Street have seen a significant increase in visitors. Total places EVER visited in the downtown area Among those who have visited before but do not live/work in downtown WPB (n=42) IceRestaurants/Cream/Coffee CommunityMunicipal/ Events Entertainment Shopping NightclubsBars/ Workplacesrelated All others Q4a/b/c/d Events/places/establishments EVER visited Multiple Responses Accepted ↑ ↓ Change versus 2019 2021 Top Mentions Dining Municipal/Community Events Entertainment Cheesecake Factory 50% Rocco’s Tacos 45% Rosemary Square 79% Clematis Street (general) 69% Tree Lighting 52% Greenmarket 48% Improv Comedy Club 50% Kravis Center for the Performing Arts 43% Muvico 43%

Characteristics of Visit

17 67% 25% 3% 1% 1% 1% 1% 1% 1% 0% Personal Vehicles are still the Primary Transportation Method when Visiting Downtown The second most popular method, walking, is increasing in popularity, with a quarter of visitors opting to walk when visiting downtown (compared to 15% in 2019) this change could potentially be attributed to an increase of visitors that work and live downtown and the recent improvements to walkability. Methods of Travel to Downtown Area Total Respondents (n=158) Car Walk Ride (Uber/Lyft)share Bicycle Brightline Taxi Motorcycle/Scooter Tri Rail Bus Other Q5 Transportation / Q5a Preferred Transportation ↑ ↓ Change versus 2019 Preferred Methods of Travel to Downtown Area Total Respondents (n=158) 60% 24% 4% 3% 3% 3% 1% 1% 1% 1% Mycar/truckpersonal Walk Ride (Uber,shareLyft) Bicycle Bus Taxi Motorcycle/scooter Brightline Tri-rail Other

18 Typically, Visitors Usually Spend About 4 Hours in the Area Q7 Time spent on site Significance Testing at 95% Level of Confidence Between the Columns (ABC) ↑ ↓ Change versus 2019 Characteristics of the Visit 2021 Analysis By Venue Total Special Events RosemarySquare ClematisDistrict (n=158) (n=58) (n=61) (n=39) A B C Approximately how much time in total do you plan on spending here today? Average 4 hrs 4 hrs 4 hrs 5 hrs
19 Parties Have About 2 People on Average, and Most Do Not Include Children Q1a Number in party Significance Testing at 95% Level of Confidence Between the Columns (ABC) 2021 Analysis By Venue Total 2021 Special Events The Square Clematis District (n=158) (n=58) (n=61) (n=39) A B C Adults in Party 1 42% 45% 36% 46% 2 39% 31% 46% 39% 3 10% 16% 5% 8% 4 8% 7% 10% 5% 5 or more 3% 2% 3% C 3% Mean 1.9 1.9 2 1.8 Children in Party No Children 79% 78% 84% 72% Total With Children 22% 22% 16% 28% 1 13% 17% 8% 13% 2 7% 3% 7% 13% 3 2% 2% 2% 3% 4 0% 0% 0% 0% 5 or more 0% 0% 0% 0% Mean (including No Children) 0.3 0.3 0.3 0.5 Mean (excluding No Children) 1.5 1.3 1.6 1.6 Total Party Size (Adults + Children) 1 35% 40% 33% 33% 2 35% 29% 41% 36% 3 10% 12% 7% 10% 4 15% 16% 15% 15% 5 or more 4% 3.4% 5% 5% Mean 2.3 2.2 2.3 2.3


20 Overall Spend per Party is Up Compared to 2019 Q6 Travel Duration / Q7 Time spent on site/ Q8a/b Amount spent in dollars during that visit Significance Testing at 95% Level of Confidence Between the Columns (ABC) *Added in 2019 ↑ ↓ Change versus 2019 Characteristics of the Visit 2021 Analysis By Venue Total Special Events RosemarySquare ClematisDistrict (n=158) (n=58) (n=61) (n=39) A B C About how much, in total, will your party have spent in the downtown West Palm Beach area during this visit? Average Spend Per Party $88.10 $86.70 $104.20C $66.00 Average Spend Per Person* $41.15 $44.08 $45.53 $30.02 Compared to 2019, the average spend per person has almost doubled ($25.98 in 2019) this change is mostly driven by increase in spend at Special Events.
Image
22 78% 67% 56% 44% 4% The Atmosphere, The Scenery, Dining Options, and Cleanliness, among other reasons, are all increasingly cited as area’s strong points What would you say are the area’s strong points? Total Respondents (n=158) atmosphereThe The scenery restaurantsThe organized/Clean/safe The events It is friendlyfamily The stores Many things to placesdo/to go The fountain entertainmentTheoffering Other Q10a Downtown STRENGTHS Multiple Responses Accepted ↑ ↓ Change versus 2019 39% of downtown visitors with kids say being ‘Family Friendly’ is a strength of the area Visitors also mentioned the area’s convenience as a strength


23 37% 24% 17% 16% 10% 9% 10% Parking Related Complaints Have Increased Significantly What would you say are the area’s weak points? Total Respondents (n=158) Parking is a hassle Parking is too expensive It's expensive (in general) Too much traffic Notstoresenough Not Events/ActivitiesEntertainment/enough It’s crowded Other Nopointsweak Q10b Downtown WEAKNESSES Multiple Responses Accepted ↑ ↓ Change versus 2019 Other common complaints include the area’s homeless population and the ongoing construction There were also increases in complaints about cost and a lack of stores and entertainment/things to do.


24 Special Events The Square Clematis District A B C (n=58) (n=61) (n=39) Visitors That Have Children Have Split Opinions on the Amount of Child-Friendly Activities Downtown Q12e Have children / Q12f Sufficient activities for children **Caution Very low base (under 30) Significance Testing at 95% Level of Confidence Between the Columns (ABC) 25%Yes 75%No 26% 16% 39% 74% 84% 62% Yes No Total 2021 (n=158) 45%Yes 43%No Refused13% 67% 30% 33% 20% 70% 47% 13% 0% 20% Yes No Don't Know/Refused Special Events The Square Clematis District A B C (n=15**) (n=10**) (n=15**)(n=40) Have downtownforSufficientChildrenactivitieschildren (Among those who have children) Those visiting The Square agree that the area does not have sufficient activities for children.
Ratings of Downtown West Palm Beach

26 2021 Analysis By Venue Total Special Events The Square ClematisDistrict (n=158) (n=58) (n=61) (n=39) A B C Atmosphere 71% 72% 72% Cleanliness 74% C 75% C 54% Safety during the day 66% 75% 56% Accessibility (getting to your destination) 53% 75% AC 54% Safety during the evening/at night 50% 59% 51% Quality of restaurants 40% 62% A 59% Quality of shopping establishments 50% 59% 49% Ease of finding way around 41% 62% A 49% Restaurant choices 45% 54% 51% Special events 41% 51% 51% Entertainment 43% 49% 49% Variety of shopping establishments 43% 49% 41% Availability of parking 35% C 34% C 13% Parking fees 31% C 23% 10% Parking Remains at the Bottom of the Ratings Pack; however, Ratings for Parking-Related Measures Have Seen Significant Gains Since 2019 Ratings for accessibility has increased in 2021 (mainly driven by those visiting The Square). Q11 Ratings of Downtown WPB- Summary table T2B Significance Testing at 95% Level of Confidence Between the Columns (ABC) ↑ ↓ Change versus 2019 Ratings of Downtown West Palm Beach Top 2 Box (rating 9 or 10 on a 10-point scale) 23%29%45%47%48%50%51%53%53%54%62%67%70%72%


27 People Feel Generally Safe When Visiting Downtown in Light of the COVID-19 Pandemic In light of the COVID-19 pandemic, how safe do you feel when visiting Downtown?* Top 2 Box score – 4 or 5 out of 5COVID1 Perception of safety given COVID 19 • *Added 2021 Total (n=158) Special Events (n=58)A The Square (n=61)B Clematis District (n=39)C 68% 67% 69% 69%
of the
changes – makes it more inviting.”--
“I have lived in DWPB area it’s nice to see the
clean.” --
the construction around means more investment in the area.” Total (n=158) Special Events (n=58)A The Square (n=61)B Clematis District (n=39)C
28 Many of the People We Spoke With Feel Optimistic About the Future of Downtown West Palm How optimistic are you about the future of downtown West Palm Beach as an urban destination?* Top 2 Box score – 4 or 5 out of 5Q12i Optimism about the future of downtown West Palm Beach as an urban destination / Q21j Why do you say that? • *Added 2021 66% 67% 75% C 49% Clematis District visitors are least likely to feel optimistic about the future of downtown West Palm.
for years and
“It’s safe and
“Is cleaner. Also,
“The surrounding area is developing and the downtown is
and construction show investment in the
“All of the renovation progression area.”
cleaning up.” --
29 Three-Quarters of Visitors are Likely to Recommend Downtown West Palm Beach to a Friend or Colleague How likely are you to recommend downtown West Palm Beach as a dining, shopping, and entertainment destination to a friend or colleague?* 2021 Total Respondents (n=158)NPS Likelihood to recommend downtown West Palm Beach as a dining, shopping, and entertainment destination • *Added 2021 10% 3% 10% 18% A 17% 28% BC 12% 10% 73% 69% 79% 72% Detractor (0 – 6) Promoter (9 – 10) Passives (7 8) Total Special Events The Square Clematis District A B C (n=158) (n=58) (n=61) (n=39) NPS 64 66 69 54 While Special Events visitors are most likely to feel indifferent about recommending West Palm Beach compared to those visiting the Clematis District, their NPS is still high.
Future Visitation

31 Nearly All Visitors to the Area Say They’re Likely to Come Back Again How likely are you to visit downtown West Palm Beach again in the future? Top 2 Box score 9 or 10 out of 10 Total n=158 Special Events (n=58)A The Square (n=61)B Clematis District (n=39)C Q12a Likelihood to visit again Significance Testing at 95% Level of Confidence Between the Columns (ABC) ↑ ↓ Change versus 2019 87% 83% 89% 92%


32 48% 45% 42% 30% 30% 30% 27% 45% 59% 41% 31% 31% 29% 24% 46% 31% 30% 38% 33% 33% 25% 54% 46% 62% 18% 26% 26% 33% 21% 15% 15% 15% 8% 3% 21% 12% 5% 7% 3% 2% 13% 8% 12% 10% 16% 5% 33% 28% 33% 33% 0% 3% Free parking More events in general More free events Restaurant/Bar/Cafe Morevenuesentertainmentingeneral More stores More open/outdoor events Visitors Say They Would Come to Downtown West Palm Beach More Often If There Was Free Parking, More Events In General, and More Free Events The idea of free parking is increasing in popularity a lot more compared to previous years, with mentions increasing significantly compared to 2019 (20%). What would encourage you to visit downtown West Palm Beach more often? More parking spaces More kids/family events Children'svenuesentertainment Children's playground Other Nothing/Don't know Q12b Reasons encouraging to visit again Multiple Responses Accepted *Added Significance2019Testing at 95% Level of Confidence Between the Columns (ABC) ↑ ↓ Change versus 2019 (n=158)Total Special Events (n=58)(A) The Square (n=61)(B) Clematis District (n=39)(C) B B C B B B A

Lifestyle

34 2021 Analysis By Venue What is your favorite shopping area, or location that offers a variety of activities such as shopping, dining, and entertainment? (first mention- unaided) Total Special Events The Square ClematisDistrict (n=158) (n=58) (n=61) (n=39) A B C Clematis Street 41% B 15% 36% B CityPlace/Rosemary Square/The Square* 12% 34% A 18% Boca Town Center 7% 15% Downtown Lake Worth 5% 3% 13% The Gardens Mall 7% 8% 3% Atlantic Avenue 5% 8% 5% Palm Beach Outlets 7% 2% 10% Worth Avenue 3% 7%The Mall at Wellington Green 3% 2% 5% The Boynton Beach Mall 2% 2% 5% Downtown at the Gardens 3% 2% 3% Harborside Place (Jupiter) 2% 2% 2% Grandview Market/Warehouse District - -Other 2% 2%Clematis Street and Rosemary Square Remain Visitors’ Favorite Destinations for Downtown Activities Q14a Favorite location for shopping, dining, arts, culture and entertainment *The Square - added 2021 Significance Testing at 95% Level of Confidence Between the Columns (ABC) ↑ ↓ Change versus 2019 Favorite Shopping/ Dining/ Entertainment Areas 22%30% 0%2%3%3%3%4%6%6%6%6%8%1% Clematis Street in particular is rising in popularity among those attending Special Events compared to 2019.


35 2021 Analysis By Venue What is your favorite shopping area, or location that offers a variety such as shopping, dining, and entertainment? (unaided) What other areas or locations do you frequent that offer a variety such as shopping, dining, and entertainment? (unaided) Total Special Events The Square ClematisDistrict (n=158) (n=58) (n=61) (n=39) A B C Clematis Street 64% 61% 72% CityPlace/Rosemary Square/The Square* 55% 75% AC 46% The Gardens Mall 38% 62% A 46% Palm Beach Outlets 38% 48% 59% A Boca Town Center 35% 56% AC 33% Atlantic Avenue 17% 54% AC 33% Downtown Lake Worth 24% 38% 46% A The Mall at Wellington Green 21% 39% A 39% Worth Avenue 28% 34% 31% Downtown at the Gardens 21% 33% 36% The Boynton Beach Mall 16% 25% 28% Harborside Place (Jupiter) 14% 31% A 18% Grandview Market/Warehouse District 9% 26% A 13% Other 2% 2% 3% Visitation to All Areas Has Significantly Increased This could be attributed to the ease of COVID-19 restrictions - with the pandemic nearing its end people are going out and spending more than before in an attempt to make up for the lost time. Q14a/c Frequented location for shopping, dining, arts, culture and entertainment Multiple Responses Accepted *The Square - added 2021 Significance Testing at 95% Level of Confidence Between the Columns (ABC) ↑ ↓ Change versus 2019 Frequent Shopping/ Dining/ Entertainment Areas 17%22%22%29%31%32%35%35%42%47%49%61%65% 2%


36 2021 Analysis By Venue What sources do you use for local news and information and for information about local events, shopping, dining, and entertainment? (unaided) Total Special Events The Square ClematisDistrict (n=158) (n=58) (n=61) (n=39) A B C Social media (Twitter, Facebook, etc.) 48% 53% 33% TV 48% 34% 51% Newspaper 35% B 13% 18% Newspaper - Palm Beach Post 29% B 13% 18% Newspaper Sun Sentinel 14% C 2% 0% Newspaper Other 0% 0% 0% Internet 2% 18% A 5% Radio 7% B 0% 18% B Magazine 5% 3% 0% Text messages 0% 0% 0% Other Print 3% 7% 0% Other 2% 2% 0% Social Media and TV are Go-to Sources for Local News and Information TV in particular has increased drastically as a source of local news, increasing from 25% in 2019 to 44% this year. Q15b Sources used for local news and information on events, etc. Significance Testing at 95% Level of Confidence Between the Columns (ABC) ↑ ↓ Change versus 2019 Sources of Local News and Information 44%46% 20%22% 0%0%6%9%7%3%4%1% Older visitors rely on TV for local news and information (61% of those ages 50+ cite newspapers as primary source of information) while younger visitors rely on social media (50% of those under age 35 cite social media as primary source of information)


37 2021 Analysis By Venue Total SpecialEvents The Square ClematisDistrict (n=134) (n=50) (n=52) (n=32) A B C 68% 62% 75% 62% 71% 59% 36% 40% 50% 28% 25% 31% 18% 31% 34% 24% 29% 22% 26% 21% 22% 8% 14% 13% 4% 4% 9% Over Three-Quarters of Those Visiting the Downtown Area Use Social Media, With Facebook and Instagram Leading the Pack Instagram keeps increasing its market share, with two-thirds of social media users currently active on it, an increase of 18percentage points from 2019. Facebook, while still the main platform, is significantly less popular compared to 2019 (84%). Q15c Use of Social Media / Q15d Social Media Sites Used *Added Significance2021Testing at 95% Level of Confidence Between the Columns (ABC) ↑ ↓ Change versus 2019 Do you use Social Media? Total (n=158) SpecialEvents (n=58)A RosemarySquare (n=61)B ClematisDistrict (n=39)C 85% 86% 85% 82% 15% 14% 15% 18% NoYes Social Media Sites Used 65%67% Younger5%11%23%25%27%28%41%visitorscontinue to report higher social media use than older visitors, however social media use keeps growing among older visitors **


Residency

39 Special Events The Square Clematis District A B C (n=58) (n=61) (n=39) Most Visitors are Year-Round Residents of Palm Beach County Special Events are more likely to draw seasonal residents compared to the Square and Clematis District. Q16 SignificanceResidencyTesting at 95% Level of Confidence Between the Columns (ABC) ↑ ↓ Change versus 2019 79% 11% 9% 1% 69% 87% 82% 21% 3% 8%9% 8% 10% 2% 2% 0% Year residentround residentSeasonal Not a resident of Palm Beach County No answer Total 2021 (n=158)Yearround resident Seasonal resident Not a resident of Palm Beach County No answer A B
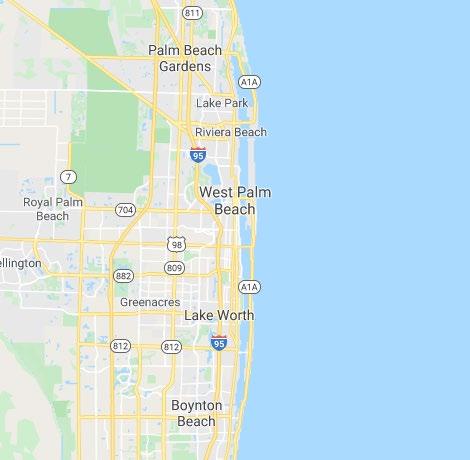
40 Half of Those Visiting Downtown Live in West Palm Beach Q22 Zip code Zip Code of Residence Top Mentions 2021 (n=158) West Palm Beach Lake Worth/Greenacres Ft. WellingtonPalmLauderdaleBeachGardens 47% 5%5%6%8%
Demographics
42DemographicsGender / Q19 Home ownership / Q20 HISPANIC / Q21 ETHNIC BACKGROUND Significance Testing at 95% Level of Confidence Between the Columns (ABC) 2021 Analysis By Venue Total 2021 Special Events The Square Clematis District (n=158) (n=58) (n=61) (n=39) A B C Gender Male 50% 48% 51% 51% Female 50% 52% 49% 49% Home ownership Own 35% 33% 33% 41% Rent 48% 47% 49% 46% Not a resident of Palm Beach County 11% 14% 10% 10% Hispanic Yes 24% 17% 23% 36% A No 70% 69% 75% 62% Refused 6% 14% B 2% 3% Ethnic Background White 58% 47% 66% A 62% Black or African American 20% 19% 16% 28% Asian or Asian/American 6% 9% 7% 3% Other 10% 10% 10% 8% Don’t know/Refused 8% 16% B 3% 5%


43DemographicsQ23 Age/ Q17 Marital Status/ Q18 Number of children Significance Testing at 95% Level of Confidence Between the Columns (ABC) 2021 Analysis By Venue Total 2021 Special Events The Square Clematis District (n=158) (n=58) (n=61) (n=39) A B C Age 18 to 24 13% 9% 21% 8% 25 to 34 21% 31% B 15% 15% 35 to 44 29% 31% 25% 33% 45 to 49 10% 9% 12% 10% 50 to 54 8% 7% 7% 10% 55 to 59 8% 2% 8% 18% A 60 to 64 5% 9% 5% 0% 65 to 74 3% 2% 3% 5% 75+ 1% 0% 2% 0% Refused 2% 2% 3% 0% Mean 40.5 yrs 39.1 yrs 40.0 yrs 43.3 yrs Marital Status Single 47% 59% B 39% 41% Married 30% 26% 28% 39% Living with partner 15% 5% 23% A 15% Separated/divorced 6% 9% 5% 3% Widowed 1% 0% 2% 3% Refused 2% 2% 3% 0% Number of Children 0 71% 69% 77% 64% 1 11% 19% B 7% 8% 2 10% 5% 8% 21% A 3 3% 2% 5% 3% 4 1% 0% 0% 3% 5+ 0% 0% 0% 0%


44 Employment Q24a Employment status/ Q24b Industry/ Q24c Use of Brightline to travel to work Significance Testing at 95% Level of Confidence Between the Columns (ABC) 2021 Analysis By Venue Total 2021 Special Events The Square Clematis District (n=158) (n=58) (n=61) (n=39) A B C Employment status Employed 80% 86% 72% 82% Full time employment 66% 67% 67% 62% Part-time employment 14% 19% B 5% 21% B Homemaker 1% 0% 0% 5% Full time student 3% 0% 7% 0% Part-time student 1% 0% 2% 0% Retired 9% 7% 12% 8% Not currently employed 4% 5% 3% 3% Refused 3% 2% 5% 3% Income Under $35,000 22% 19% 20% 28% $35,000 - $49,999 13% 14% 7% 21% B $50,000 - $74,999 21% 26% 18% 18% $75,000 $99,999 10% 12% 12% 5% $100,000 - $149,999 9% 12% 5% 10% $150,000 and over 11% 10% 15% 5% Refused 11% 7% 16% 8% Don't know 4% 0% 8% 5% Mean $71.9K $73.8K $79K $59.3K


For more information, contact: radiusinsights.com Radius U.S. Radius Europe Radius MEA Radius Asia Clear thinking for a complex world. Mike Jennings Senior Vice President (561) 965-8300 ext. mjennings@radiusinsights.com143 Michelle Burroughs Group Research Manager (561) 965-8300 ext. mburroughs@radiusinsights.com136 Cori Ouellette Research Analyst (561) couellette@radiusinsights.com307-4670
