A GREEN background indicates benchmark attained or exceeded
A RED background indicates benchmark missed or not achieved
Gross Rent Arrears
WGHC’s benchmark for gross rent arrears is 1.30%.
Gross rent arrears are the amount of rent owed by both former and current tenants, not including any payments we expect to receive from housing benefit or universal credit.
Gross rent arrears as of 30th June 2025 were 1.06% this equates to £22,821
Current Tenants @ 0.90%
Former Tenants @ 0.16%
Anti-Social Behaviour
Incidents of ASB should be resolved within 20 working days. The benchmark for WGHC is that 90% of reported ASB incidents will be resolved within the 20 working days
There were 10 allegations of ASB reported within the first quarter. 8 (70%) were resolved within 20 working days.
The remaining 3 (30%) were resolved outside the 20 working days. 3 cases resulted in the issuance of written warnings (with 1 of these progressing to a NOP); 7 cases resulted in informal action.
Overall, this meant our resolution rate compared to benchmark was 70%
Service Complaints
In the period 1st April 2025 to 30th June 2025, WGHC received the following complaints:
11 Complaints logged, 5 @ Stage 1, 6 @ Stage 2. 5 related to departments (Maintenance or HM), 2 to contractors and 4 to staff
Resolution for stage 1 within 5 days, stage 2 within 20 days. All were resolved within SPSO target requirements. 7 were upheld in favour of the complainant 2 were partially upheld Stage 1 average = 1.3 days / Stage 2 average = 18.4 days
Tenant Support Visits
WGHC’s benchmark is to visit 24 tenants per quarter, in terms of offering support, or, from a tenant sustainment perspective.
These can include welfare checks, providing assistance with online claim or portal applications / submissions, post-allocation visits and any other ‘in home’ visit to provide assistance to WGHC tenants.
During the quarter, 39 visits were undertaken, exceeding the benchmark. This is a pleasing achievement for WGHC and benefits our tenants.


Average Days to Relet a Property
WGHC’s benchmark to relet a property is 14 days (average).
Cumulatively, within the reporting period 01st April 2024 to 30th June 2025, we relet 5 properties. On average, it took us 15 days to relet an empty property. In addition, during the period, 6 other properties turned over, with 4 x successions and 2 x mutual exchanges.
Of the 5 relets, all 5 were allocated to homeless households in accordance with EdIndex requirements. These all had either silver or gold priority.
Void Spend (Per Property)
WGHC’s benchmark for void spend, per unit, is £2,500 with an anticipated / budgeted stock turnover of 24 units per year.
Cumulatively, within the reporting period, 6 properties became void and incurred void work costs.
WGHC’s average void spend, within the reporting period, per property, was £1,517.75 which was within the benchmark.
(It should be noted, that although we had 6 voids, actual turnover of tenanted properties was recorded at 11: 4 were tenancy successions and 2 were mutual exchanges) (1 void straddled the reporting period)
Stair Inspections
WGHC’s benchmark for stair inspections is 3 ‘sets’ per quarter. For the reporting period, 3 should have been undertaken.
WGHC has 13 common stairs, so the benchmark requires that each of the 13 stairs (as a ‘set’) are inspected @ 3 times a quarter Within this cumulative reporting period, 3 x full sets of stair inspections were undertaken.
Therefore, 3 x full sets of stair inspections were completed, meeting the required benchmark.
Estate Management Visits
WGHC’s benchmark for estate management visits is 12 per quarter.
This involves staff visiting each of the 17 streets within the WGHC estate and recording actions to be taken including incidents of vandalism, gardens in need of attention, damage to pavements, abandoned vehicles, collapsed drains, overgrown trees etc.
Within this cumulative reporting period, 204 x estate management visits should have been undertaken, 196 were undertaken. This equates to 96%. This is the first time for nearly 2 years this benchmark has not been met.


Bi-Annual Asset Management Visits
WGHC’s benchmark for bi-annual management visits is 48 per quarter, or, 192 per year (over 2 years = all WGHC properties)
This benchmark is to ensure that all WGHC properties are visited at least once, every 2 years to assess their condition both internally and externally.
Since implementation of this benchmark, 144 surveys should have been undertaken. I’m pleased to report that 240 x surveys have been undertaken, exceeding the required benchmark. They are recorded within tenant files, I-Auditor platform and a centralised spreadsheet.
Average DAYS to complete a non-emergency repair
WGHC’s benchmark for attending a request for a non-emergency repair is an average of 5 working days.
Within the reporting period, i.e. 01st April 2024 to 30th June 2025, a total of 239 non-emergency repairs were undertaken. These repairs collectively took 1012 days to complete.
Therefore, the average response time to complete non-emergency repairs was 4.2 working days, which is within the required benchmark.
Average HOURS to attend for an emergency repair
WGHC’s benchmark for attending a callout for an emergency repair is an average of 3 hours.
Within the reporting period, we had a total of 17 emergency repairs. These repairs, collectively, took 30 hours to complete.
On average, we attended to an emergency repair within 1 Hour 46 Minutes which is well within the benchmark requirement.
Repairs Inspections
WGHC’s benchmark for pre or post inspections of repairs is 10% of all repairs carried out per quarter.
During the reporting period, 577 work orders were raised. As a result, at least 58 pre or post-work inspections should have been undertaken.
For the period between 01st April 2024 and 30th June 2025 a total of 107 inspections were undertaken which equates to 18.6% of the total jobs undertaken, which exceeds the required benchmark


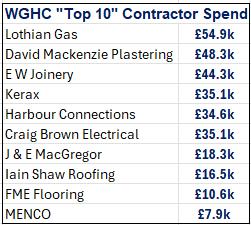
Contractor Management
WGHC’s benchmark for contractor management meetings is 6 per quarter, or 13 per half year. The main purpose of these meetings is to discuss ongoing performance, assess KPIs and maintain working contractual relationships.
We’re pleased to report that all relevant Contractor Management Meetings were undertaken – within July 2025
Reactive Maintenance spend is overspent within Q1 by c. £32k – this relates, primarily, to both the rolling EICR programme and grounds maintenance with Glendale.
Tenant Satisfaction with Quality of home
WGHC survey every tenant in the year, who move into a WGHC property. We ask the tenant how satisfied they are with the quality of their new home. Within reporting period, 6 tenants were surveyed 5 Responded. WGHC’s benchmark for this KPI is 95% of tenants report being satisfied.
PAV results indicate 100% of the new tenants who moved into their home within the reporting period were satisfied with the quality of their home meaning this benchmark has been exceeded.
Void Loss
WGHC’s benchmark for void loss is 0.5%.
This is the amount of rent lost due to properties lying empty as a percentage of the total amount of rents due.
For the reporting period from 01st April through 30th June 2025, WGHC’s void loss was £682.00 – which is £1,588.00 better than budget. (70%)
Therefore, the overall void loss was 0.13% which came in 0.37% under the benchmark.
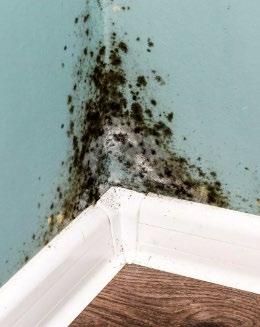
Damp, Mould and Condensation
This is currently not a benchmark for WGHC – but is required by the SHR as of the new reporting year and to comply with the ARC next year.
For the reporting period 01st April 2025 to 30th June 2025, WGHC received 2 reports of mould caused by condensation. Both have been inspected and treated by WGHC contractors using specialist mould remover, primers and paint. One required new shower board panels.
WBG (auditors) have previously audited this area of WGHC performance reporting a “strong” outcome finding.