catchment Evidence Review


Micro
Awliscombe – River Wolf (940) Exploring flood risk potential at the micro catchment scale
This document is an output from the Devon and Cornwall Soils Alliance, delivered by Westcountry Rivers Trust.

2
Executive Summary
Flood risk is a major issue for numerous communities across the South West and with the expected future impacts of climate change, as well as compounding factors such as population growth and development, it is a problem that is becoming all the more urgent. A number of projects are currently underway to understand the causes of flooding and investigate potential solutions. This includes the Upstream Thinking - Rapid Response Catchments project and Devon and CornwallSoils Alliance (more info on page 5).
A mapping exercise was carried out to identify all the micro catchments (5km2 or 10km2)above flood risk properties in Devon and Cornwall. The idea being that Natural Flood Management (NFM) measures and engagement with the local community weremost likely to be effective at this scale. These micro catchments were then prioritised according to a number of factors. The catchment described in this report, the Awliscombe River Wolf, is one of those prioritised micro catchments.
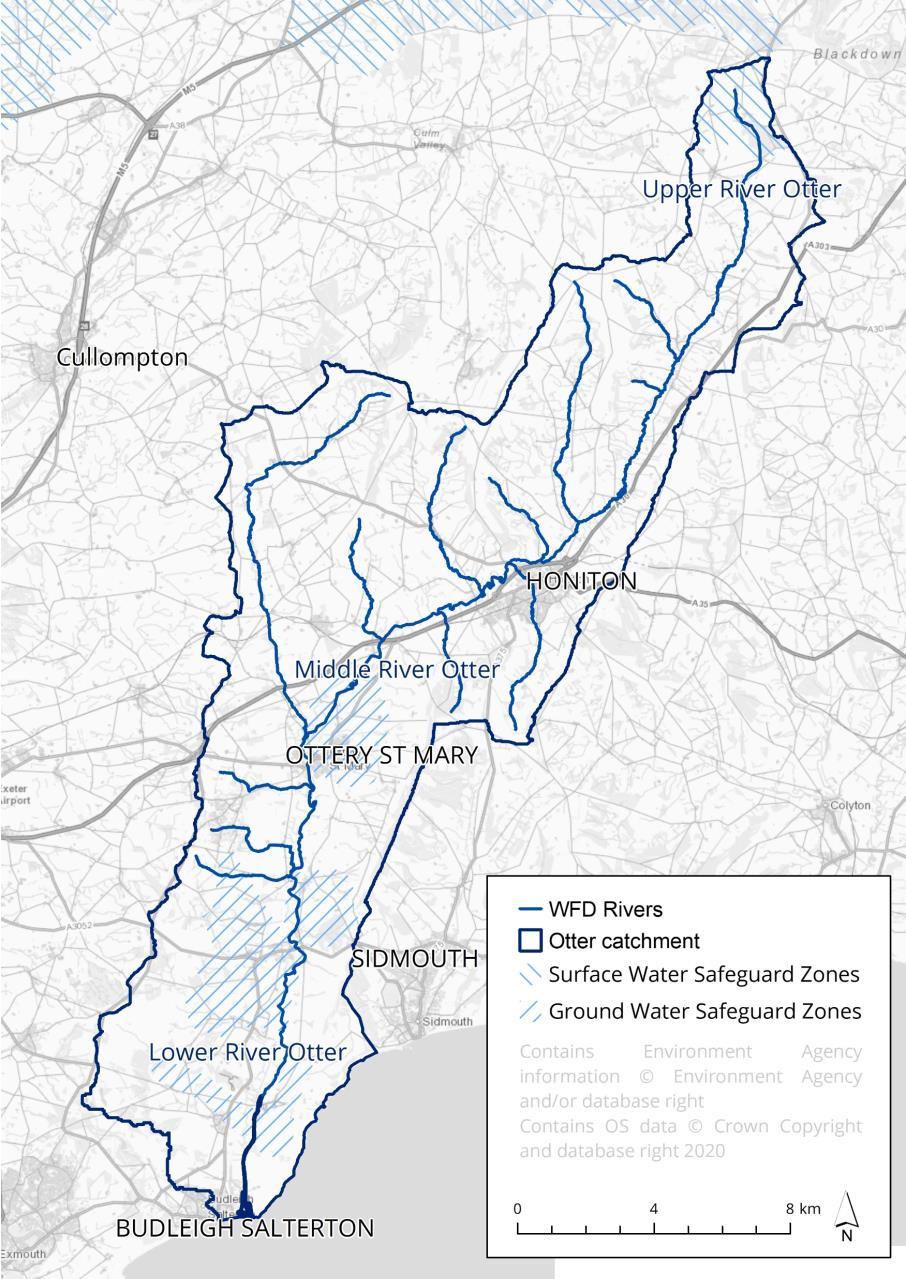
The micro-catchment for the Awliscombe River Wolf is 958ha and highlights 9 properties potentially at riskfrom surface water flooding, many of these are in Awliscombe. There are multiple possible contributing causes of this, including the topography, land use, and scarcity of habitats such as woodland. The catchment is failing Water FrameworkDirective (WFD) regulations on chemical status and is within a Drinking Water Safeguard Zone at risk of contamination by pesticides.
A rapid walkover survey wascarried out by an experienced surveyor from the Westcountry RiversTrust (WRT) to further inform potential issues and opportunities for flood riskmitigation. During the walkover, the micro catchment, displayed anecdotal localised flood risk. There is therefore some opportunity to effect localised flood improvement and the ability to mitigate part of a larger flood risk downstream (less localised) should not be discounted either. Additionally, the walkover presented opportunities to support and deliver or contribute towards WFD (Water Framework Directive) elemental improvement.
Implementation of Natural Flood Management (NFM) measures may have the potential to mitigate some of the flood risk and simultaneously make progress towards reaching “good” WFD status for the wider River Otter catchment that would ultimately benefit the local community. The NFM opportunities identified in this report include riparianwoodland planting and other habitat creation surrounding existing habitats across the catchment to slow surface water flow into watercourses and enhance habitat networks. More areas of land entering into an agri environment scheme agreements may also contribute to improved soil health and biodiversity in the absence of significant habitats. The catchments proximity to the potentially affected community willneed to be considered when designing these NFM measures, although this presents a major opportunity for community engagement to facilitate delivery.
3
4 Contents Overview How this Document Works 5 Introduction 6 Methodology 7 Why this Catchment? 8 Thematic Chapters Micro-catchment Overview Priority Areas and Drivers 12 Existing Natural Assets and their Condition 20 Issues 25 Opportunities 29 Appendicesand Data Sources 36
How this Document Works
This documentisa study for causesof flooding,priorityconsiderations,and opportunitiesforNFMin the micro-catchmentforthe Balland Stream, covering some of the Ashburton urban area in South Devon.
The study is builton multiple layersof mapped environmentalinformationand the results of the walkoversurvey. This informationhasbeenused to explore the current state of the catchmentand its environment, and then map areasfor further investigationand actionsto make improvements.
This micro-catchment scaleassessmentwillbe usedto guide efforts incommunityengagement andNFM.
The study has 5 key chapters,based on the current status of the micro catchmentand whatopportunitiesthere mightbe.
1. Micro-catchmentOverview
2. PriorityAreasand Drivers
• Flooding
• WaterQuality
• WaterQuantity
• Designated Sites
• Tourism and Recreation
3. Existing Natural Assetsand Their Condition
• Habitats
• Soils
• Crops
4. Issues
• Abstraction,Discharges,Pollution,and Runoff
• HydrologicalConnectivity
• Issues identified during Walkovers
5. Opportunities
• Existing Opportunities
• OpportunitiesIdentified during Walkovers
It isnot possible to map all aspectsof the status of the micro catchmentwithexisting datasets,and the true state of the catchmentmay not be fully reflected inthe datasetsforvariousreasons including the age of the data,the resolution, and the level of local knowledge takeninto consideration when the data has beencollected and mapped.
Assessing the qualityand conditionof natural assetsin particularischallenging due to the level of detail required.Nonetheless,the availabledata has beenreviewed and the bestdata currently availablehasbeenused. A full set of referencescan be found on pages52 55.
5 Overview
Flooding isa problem thatis experienced widelyacrossDevonand Cornwall,witha large portionof caseslinked to rivers(fluvial flooding as opposed to surface wateror sea).Riverwaterqualityisalso a key issue in the region,withall 381assessed rivers failing to achieve “good” statusin 2019.One importantreasonfor waterqualityfailure islinked to soil erosion.Soil erosioncan also contribute to increased fluvial flood riskdue to reduced channel capacitiesand blockages.Therefore,waterqualityand floodriskdriversare often interlinked and the solutionsto alleviate these pressures are often multifunctional.Two projectscurrentlyunderwayare aiming to tackle these issues by working withlocal communitiesto deliver small scale,land basedmeasures(“nature basedsolutions”).These projectsare Devonand Cornwall SoilsAlliance (DCSA) and Upstream Thinking
Rapid Response Catchments(UST RRC).
Afteritwas found that over 40%of soilsacrossDevonand Cornwall are degraded,the collaborativeprojectof the DCSA waslaunched inJune 2019. This aimsto build the capacityand capabilityinsoilsadvice forthe projectpartnersacrossthe 2 counties to work towards restoring degraded soils. One significantbenefitof improving soil healthisgreatersurface waterinfiltrationinto the ground before itreachesand overwhelmswatercourses, thereby reducing flood riskand preventing potential pollutantsfrom entering the water.Thisalso has the potential to make considerable Water FrameworkDirective (WFD) improvementsto waterquality.
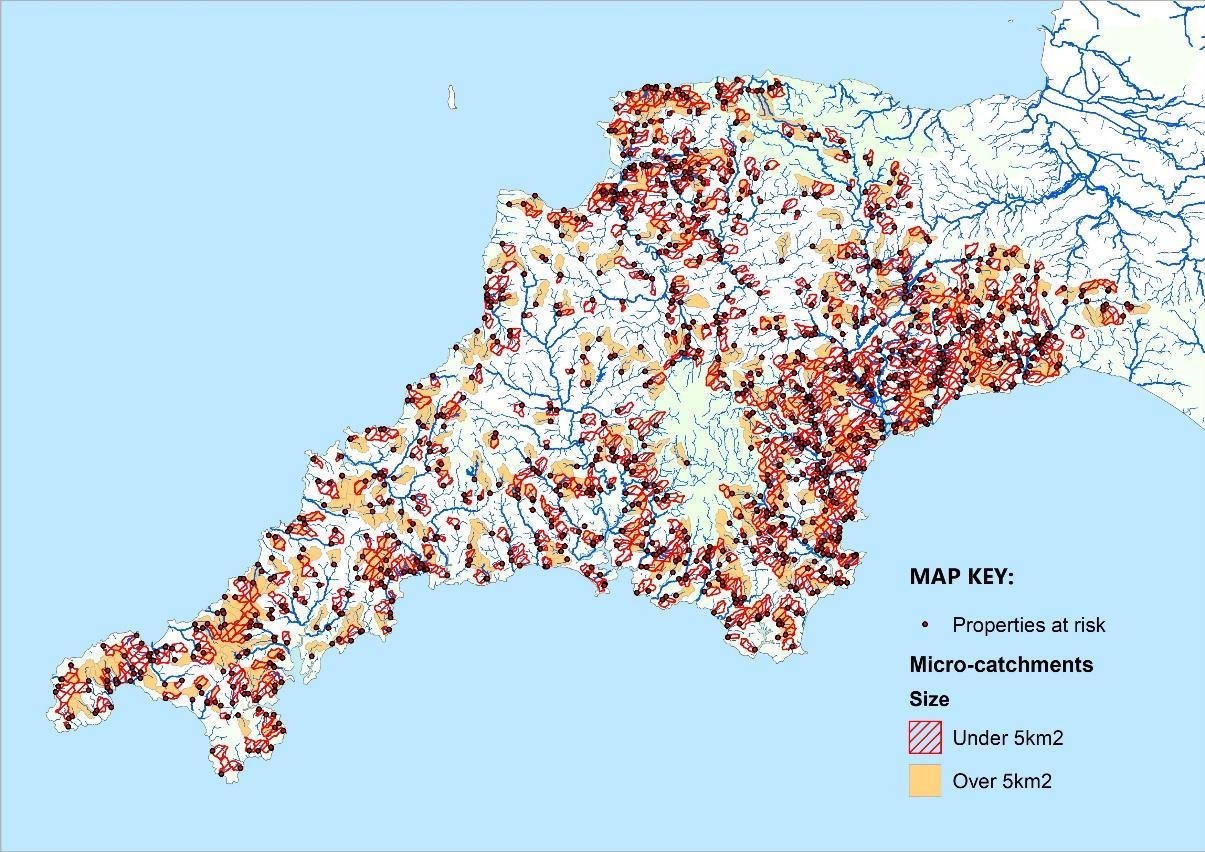
AcrossDevonand Cornwall there are hundreds of Rapid Response Catchmentsthat are characterised byquicklydraining catchmentareasunder 10km2 (and under 5km2) , where during high rainfall eventssurface flowsand overland run off overwhelm small communities(1 50propertiesin flood zone 1).Flood eventshave increased inthese types of catchmentdue to degraded soilsthatno longerhave the infiltrationcapacity,simplified drainage patternsand more variable and extreme weatherpatternsassociated witha changing climate.UST RRCwill focusonworking withsmall communitiesinthese rapid response catchments to help them develop and delivertheirown climate resilience plansbyrestoring some of the hydrological functionalitywithinthe landscape.
The DCSA isworking in partnership with the UST RRCprojectacrossDevonto develop 24preparatoryinvestigationsonprioritised micro catchmentsto identifylikelyareasfornature based solutionsand NFM (Natural Flood Management) interventionswhere land ownership showsa willingnessand waterqualitycanbe improved.Communityengagementwill be criticalwhenimplementing NFMasmeasures need to be numerous and spread out across the catchmentto provide the greatestbenefits.If propertyowners and landownerscan work togetherand share perspectives, then measures canbe designed thatare agreeable to all stakeholdersinvolved.Thisalso helpsto fostera sense of community stewardship overtheir catchmentand NFM measuresthat would enhance theirlongevityand resilience.
Introduction6 Overview
Methodology
OverviewThere may be opportunitieseverywhere forNFM measures and other nature-based solutionsatlow cost that also bring additional benefits to human health,biodiversity,and the aestheticsof the landscape. However,the scattered and fragmented locationsof propertiesat flood riskand the limited accessible fundsrequiresidentifying only the largestclustersof flood riskpropertieswiththe smallestupstream micro catchmentsto deliverthe mostimpactwiththe resources available.
The processof identifying priorityareasforopportunitiesto deliver improved waterqualityand quantityforclimate change resilience wasundertaken in four steps.
1. The South Westareasof Devonand Cornwall were modelled using GIS (Geographic InformationSystems) to identifywhere opportunityareaswere located.

2. The modelled opportunityareaswere ground-truthed in theory using desk based studies
3. The top prioritised opportunityareaswhere ground-truthed physicallyusing rapid walkoversurveys
4. Internal evidence reviews,external evidence reviews,and 2pagers summary documentswill be writtenfor24 trial investigationareas where physical interventionscan take place.
For more informationonthe first 3steps please see the appendix.
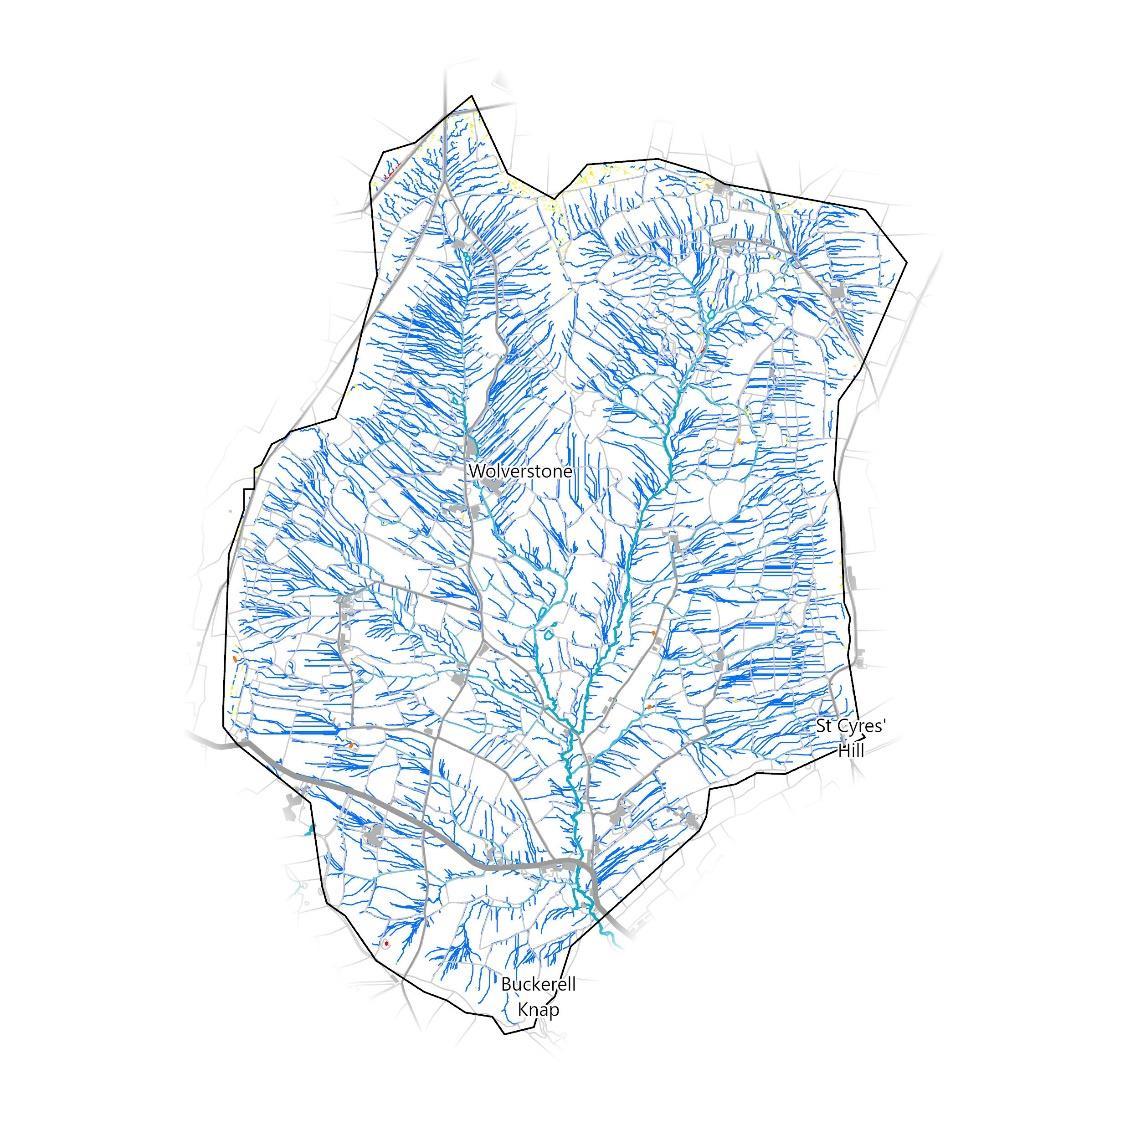
The final 24micro catchments,including the RiverWolf catchmentwhich is shown in red.
7
OverviewWhy this Catchment?
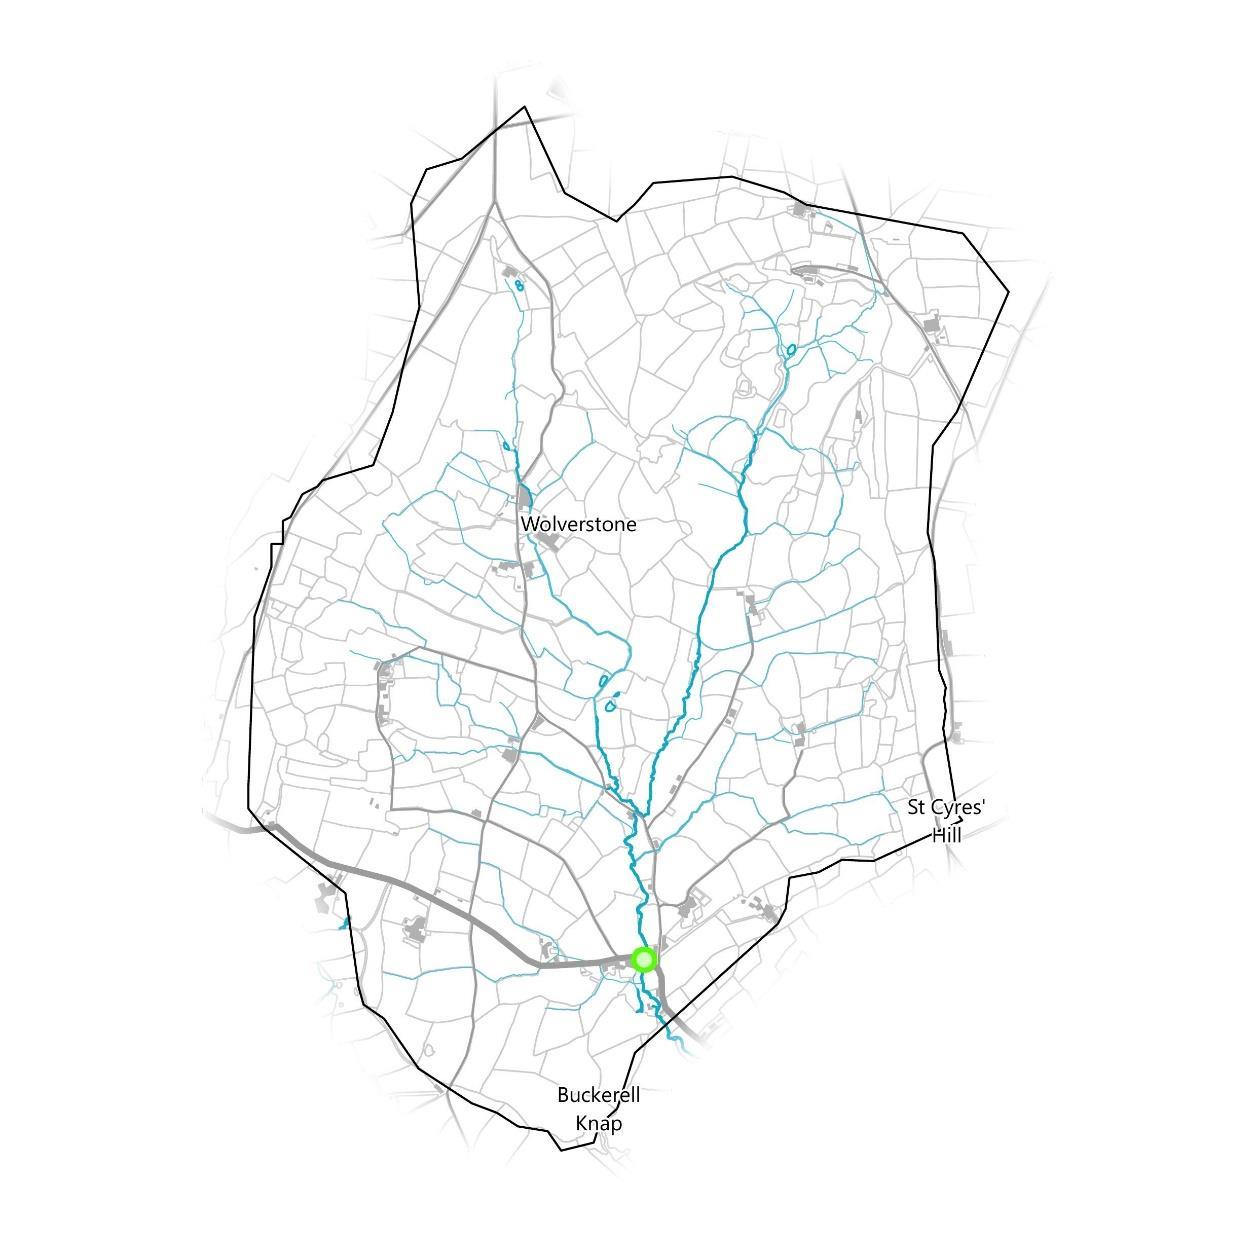
Themicro-catchment was selectedin theGISmodelling step becauseit contains alarge numberof properties near Awliscombethat are potentiallyat flood risk.
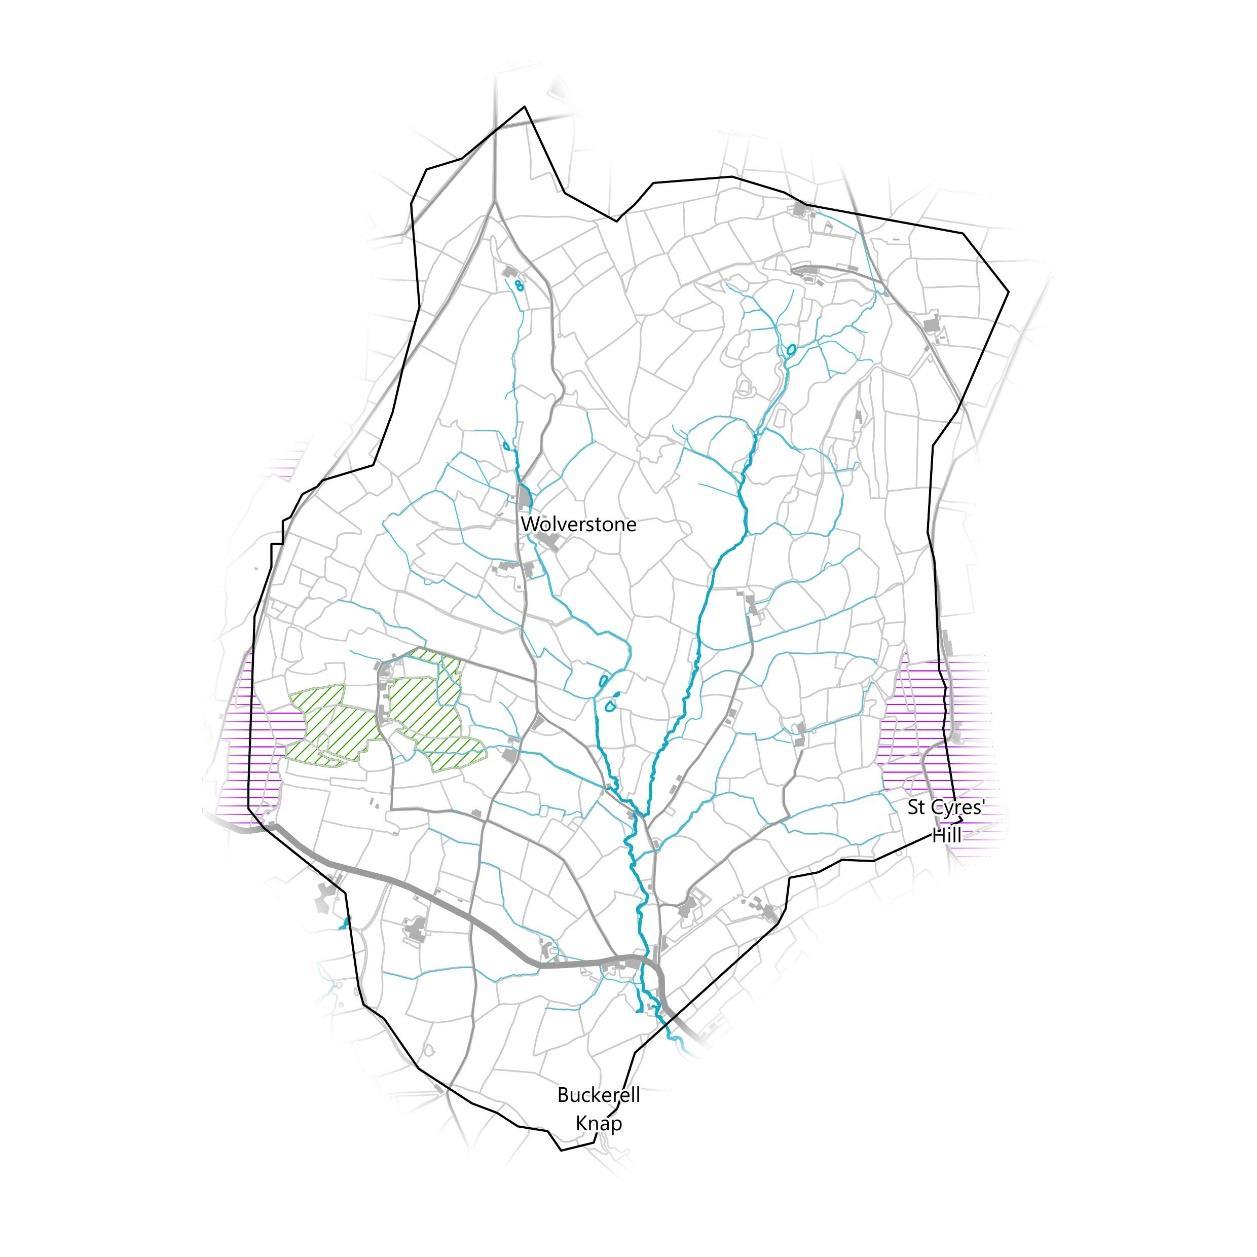
The map below showswhichbuildingsoverlap withthe EA’s modelled “Flood Zone 2” area,specificallyareasatriskof flooding from rivers,as identified during the micro catchmentmapping process.

There are 9 buildingspotentiallyatriskout of 71 in the catchment, approximately12.7%of them.
The catchment’ssize of 9.58km2 givesanarea of 1.06km2 perbuilding atrisk.
The waterframeworkdirective (WFD)statusinthe widerWolf (Otter) waterbodycatchmentisPoor.


If property ownersare willing to workwithland owners and vice versa, then small scale NFMmeasuresupstream in the catchmenthave the potential to benefita large numberof propertiesand improve water quality.

8
Micro-catchment Overview


Topography


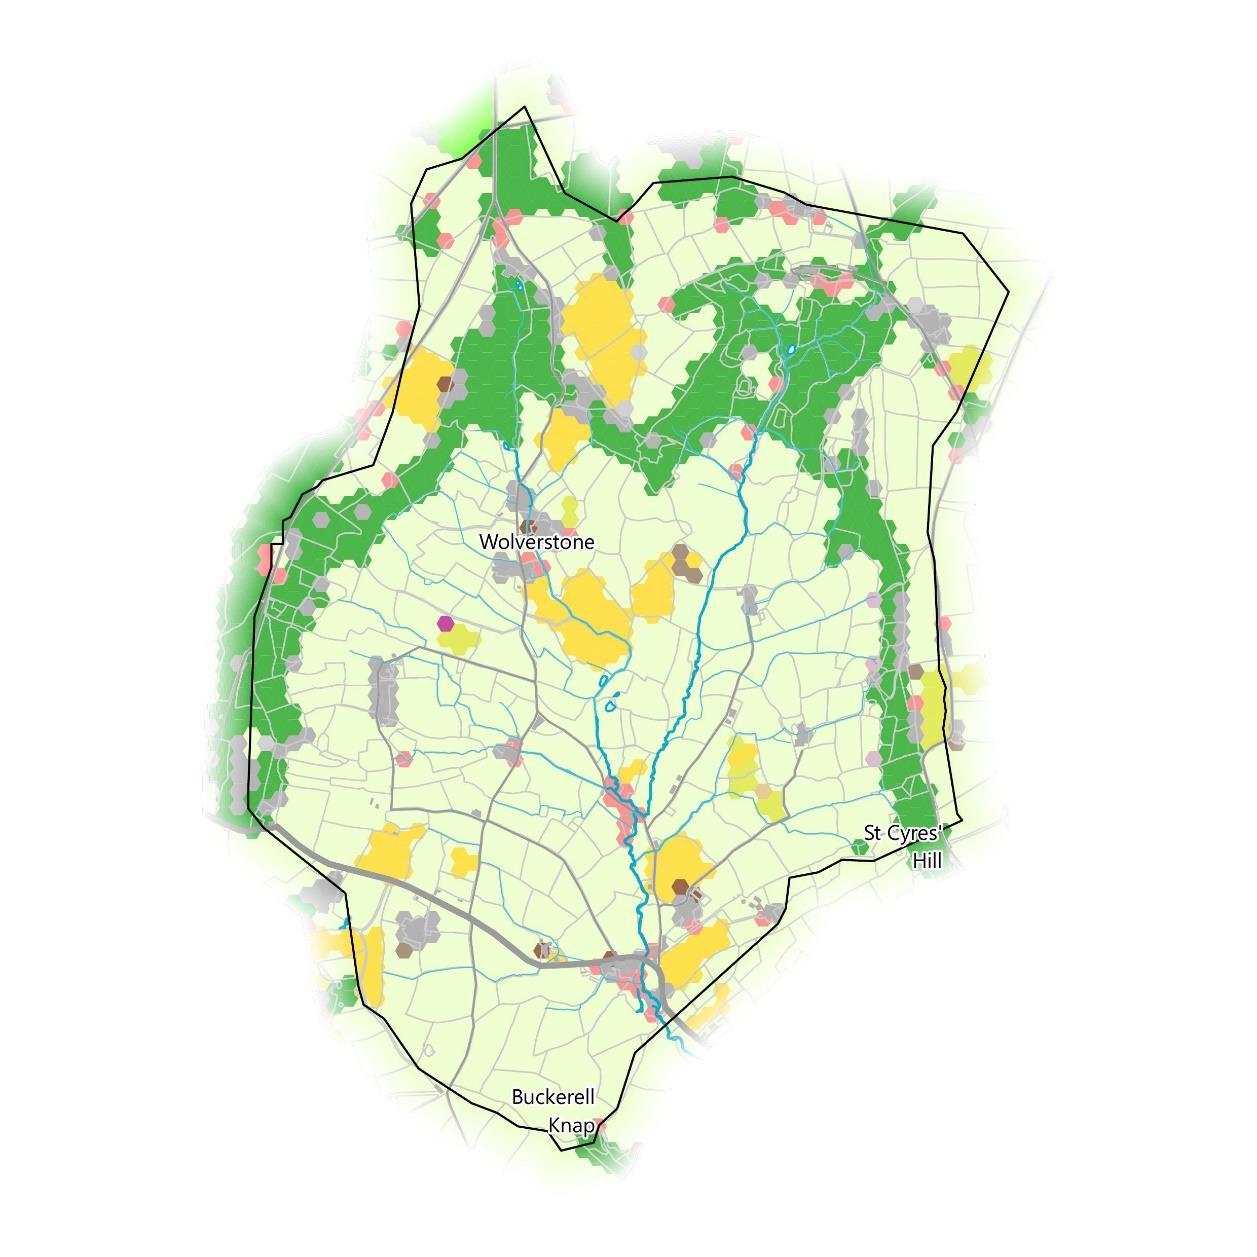
The micro catchment covers the rural area to the north west of Awliscombe and includes several small settlements, including Wolverstone. The A373 runs along the south of the catchment connecting it with Honiton to the East. The micro catchment forms the watershed for the River Wolf that flows southwards through the catchment with several tributary’s feeding in from the east and west. Overall, the micro catchment falls within the Awliscombe County Parish and is administered by Awliscombe Parish Council.
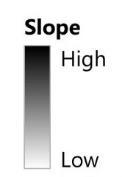
The map on the right shows the steepness of slopes. A plateau with a steep ridge lines the catchment edges to the north, east, and west, while the majority of the catchment forms a bowl with fairly low, uniform slopes, particularly in the south and central areas. The River Wolf runs along the valley bottom.
9
Micro-catchment Overview

Land Cover
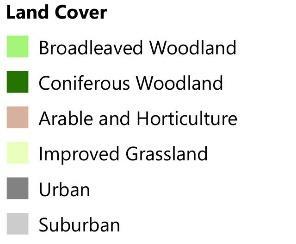
The way the land is used has significant impacts on flood management. Land use has been mapped here using the Centre for Ecology and Hydrology’s (CEH) Land Cover Map 2019. This is a model derived from satellite imagery at 25m resolution.
The land use here is primarily improved grassland, accounting for 67% of the catchment, followed by woodland that covers another 22%. The wooded areas of the catchment are largely broadleaved woodland that follow the ridge line, with some small patches of coniferous woodland in the northwest on top of the plateau. There are also some scattered areas of land used for arable and horticulture.
It should be noted that this land cover map model is not a perfect representation of land use as it simplifies UK land cover into very broad classes.
10
Micro-catchment Overview
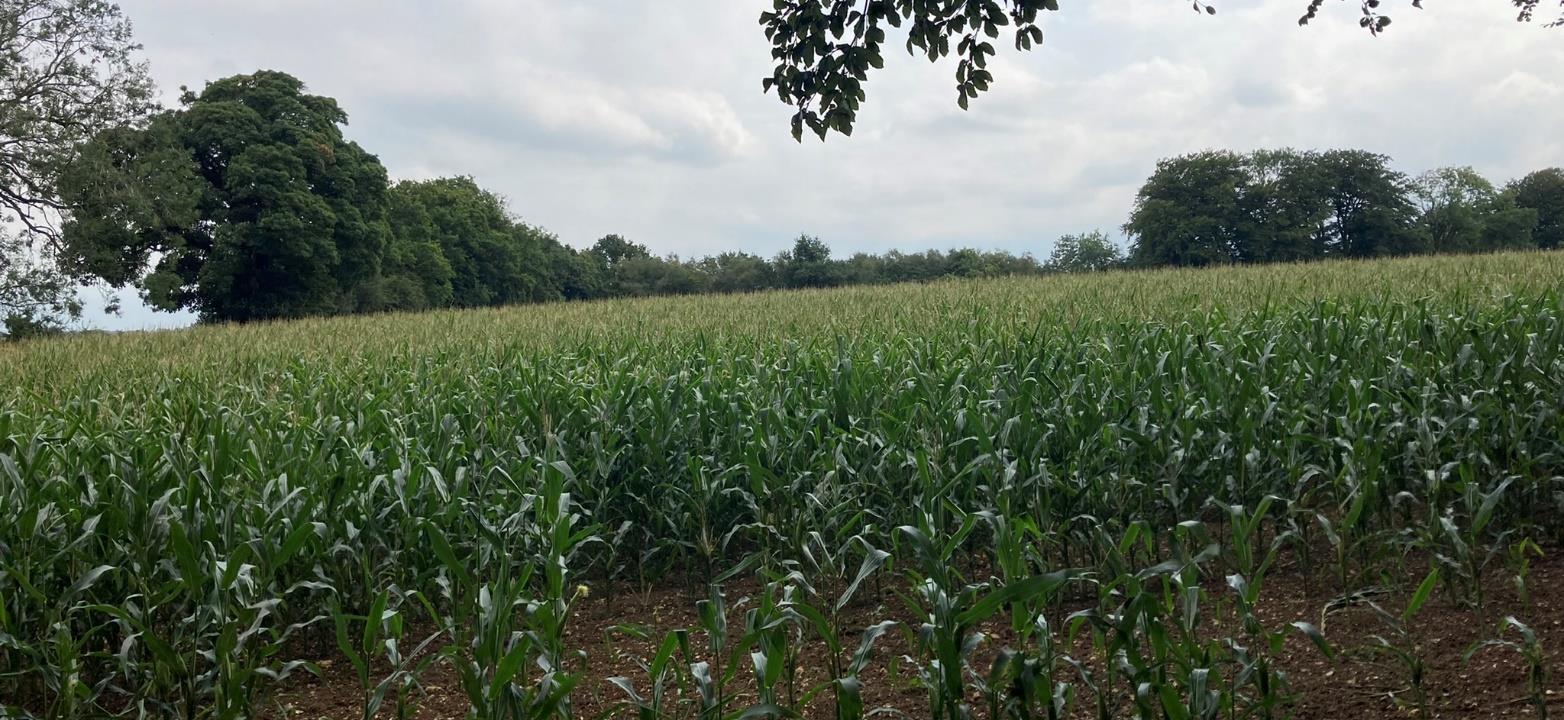
Land Cover Land use observed during the catchment walkover mostly matched the land use mapped here using the Centre for Ecology and Hydrology’s (CEH) Land Cover Map 2019 above.
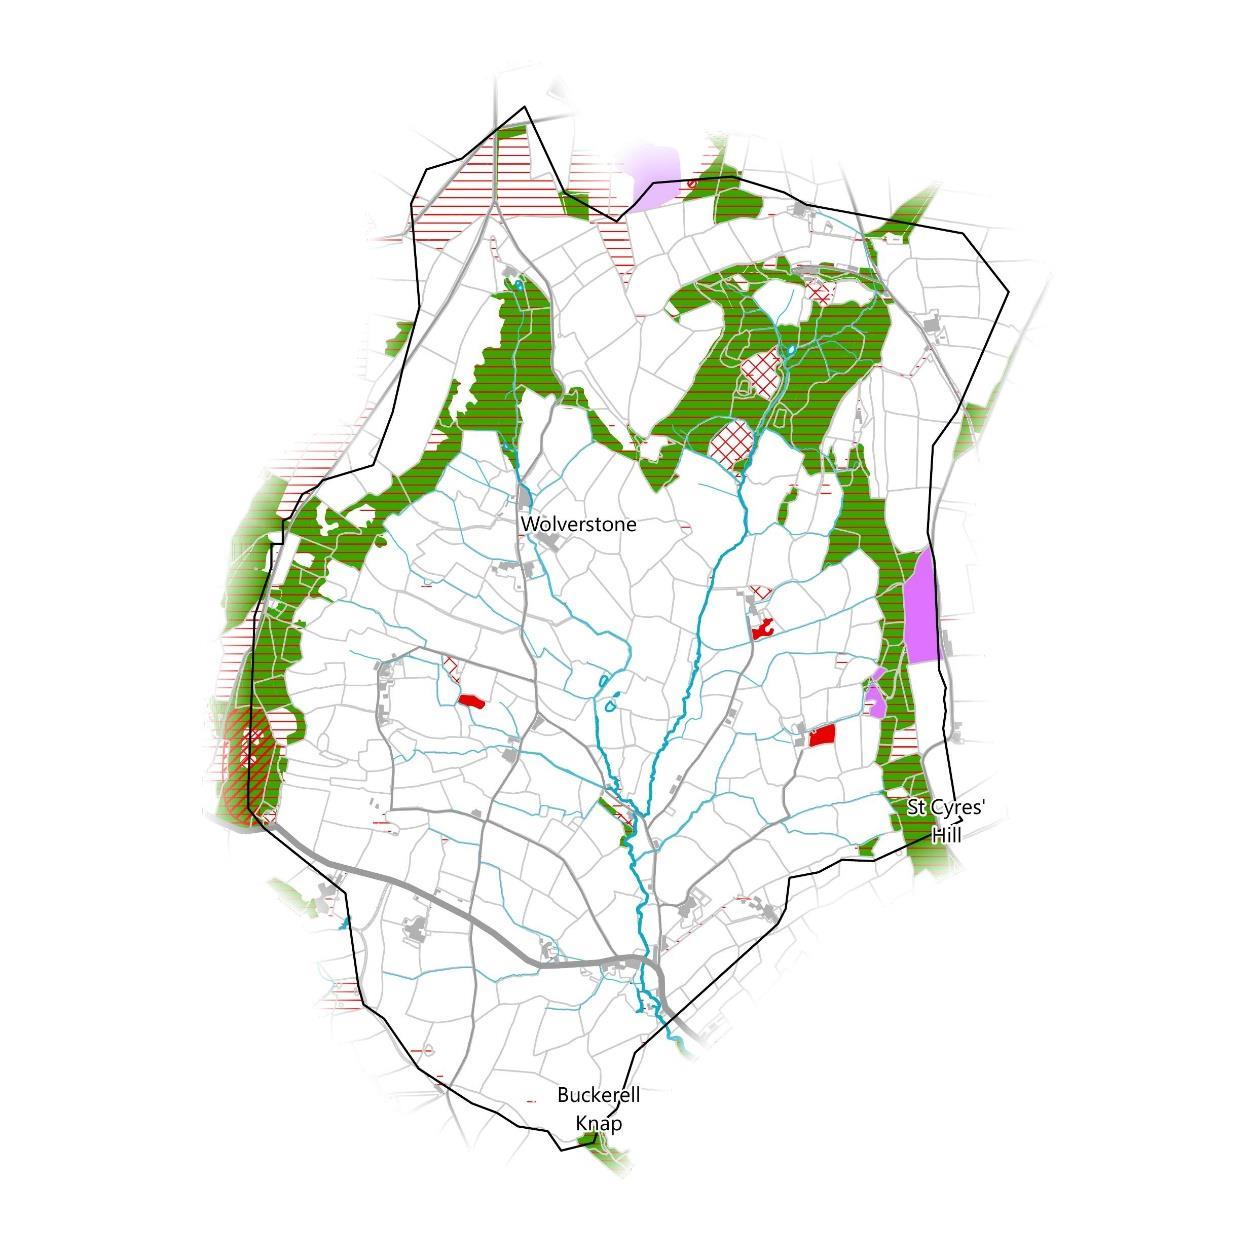
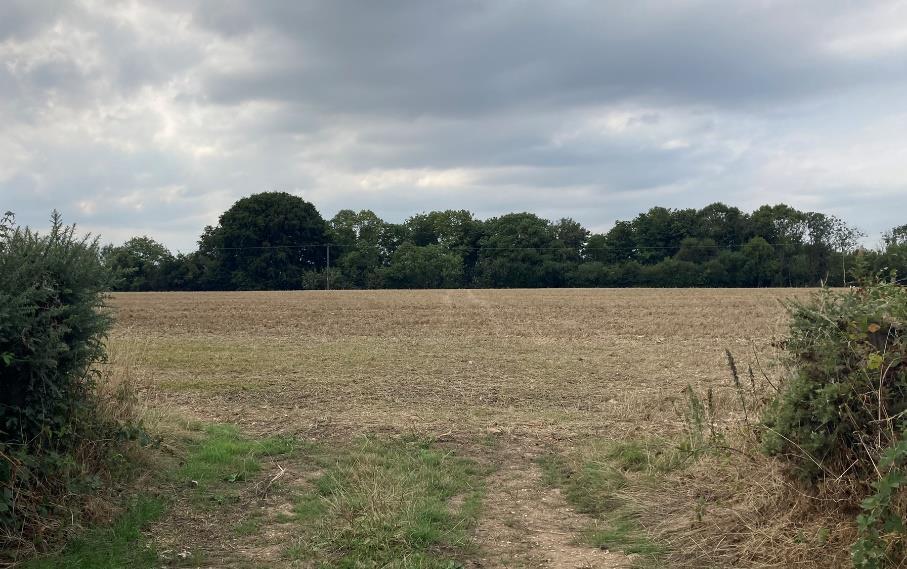
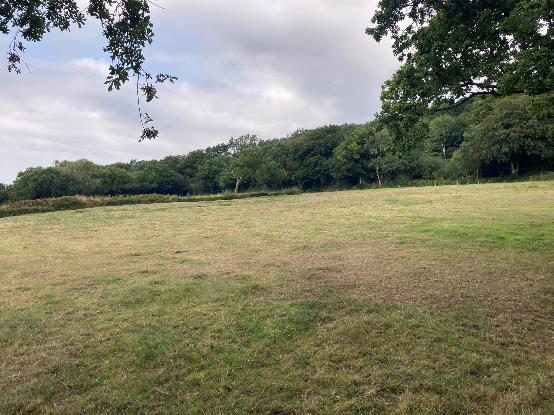
The catchment is mostly pasture and arable (maize at the time of survey) with trees around the upland watershed area as the map depicts.
The Western upper extent, in behind the trees on Wolverstone Moor, appeared to slightly differ from the mapped land use as it was proportionally weighted towards maize production rather than grassland.
The majority of the catchment appears to be supporting dairy herds for milk production.
It was generally observed that a lot of the arable location had a consistent slope, which, if left uninterrupted, lends itself to rapid run off of surface water.
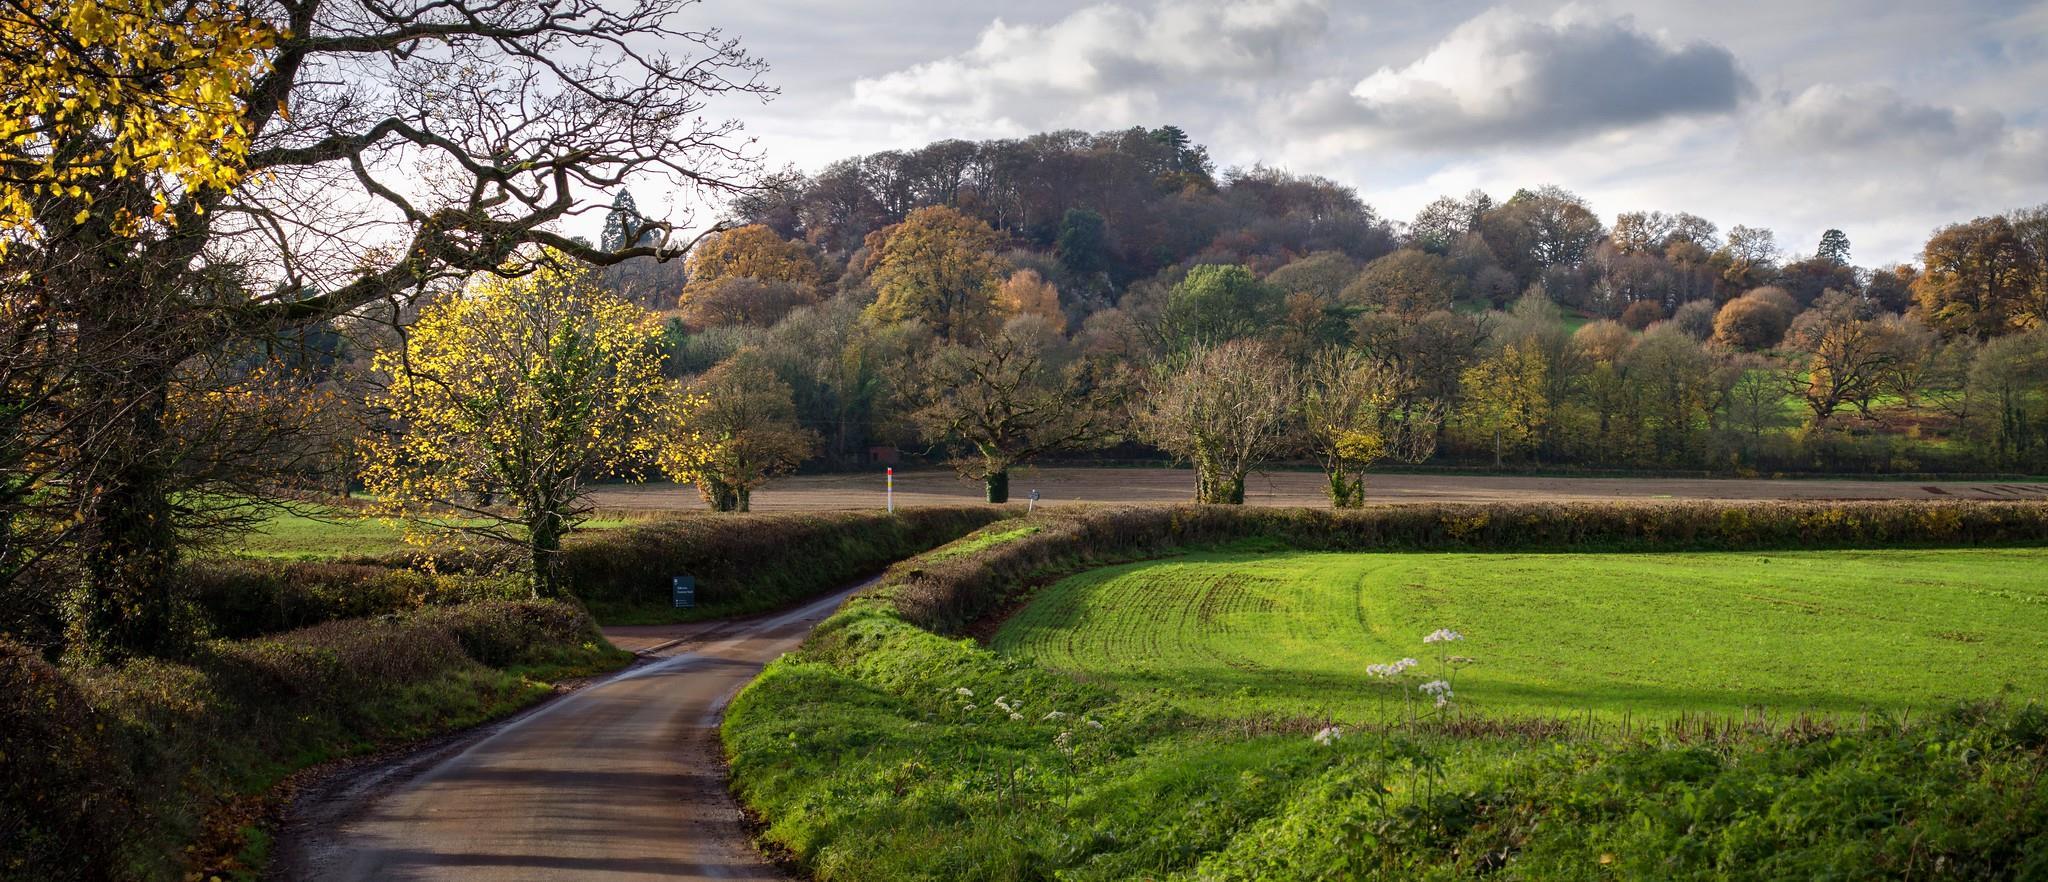
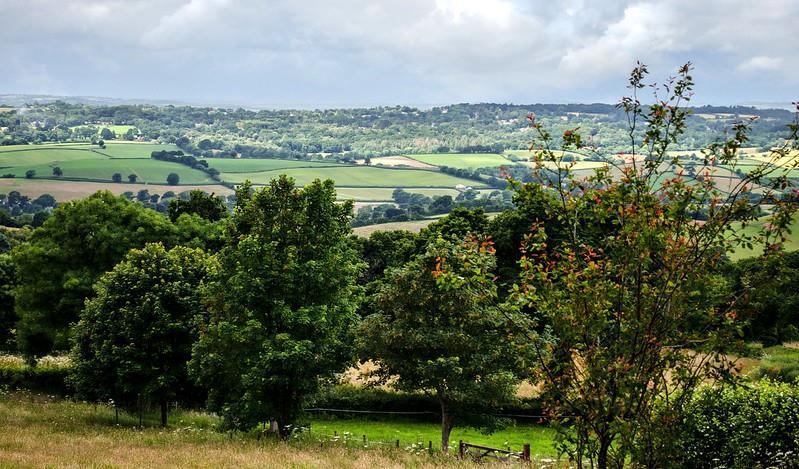
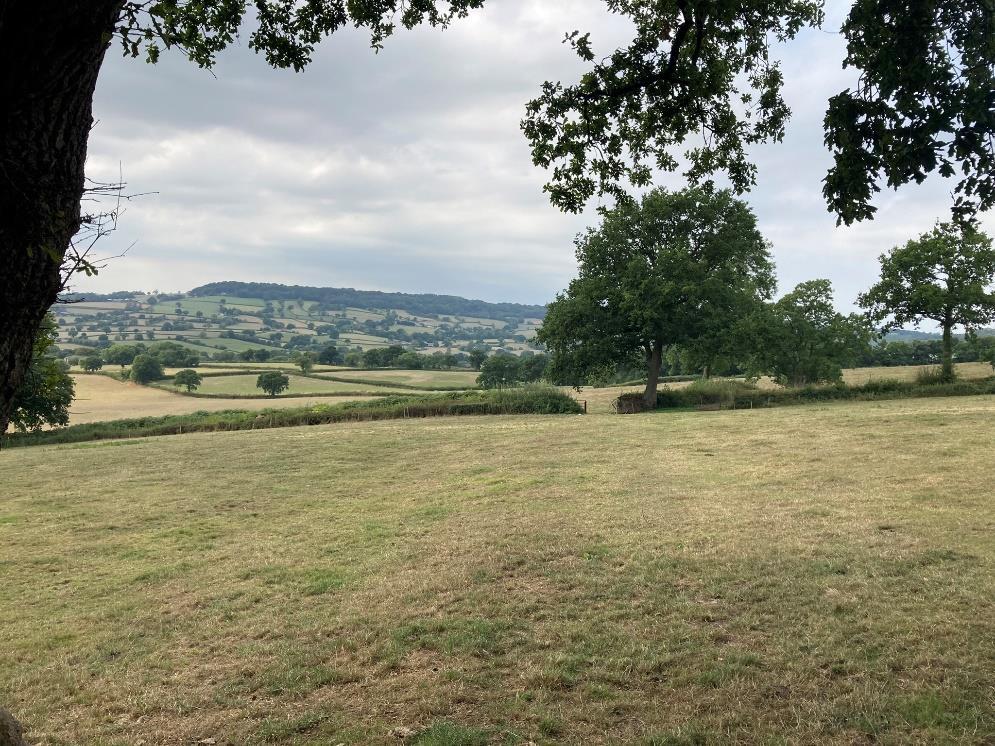
Mid catchment looking South East (downstream) across the valley towards Awliscombe

11
Priority Areas and Drivers
Flooding hasthe potential to negativelyaffectpeople and communities. Byconsidering boththe vulnerabilityof communitiesand the opportunitiesforland managementinterventions,actionscanbe targeted to have a positive impactoncommunitiesmostatrisk.
Flooding isone of a number of natural hazardswhichcan cause harm to people,the environmentand the economy.The primarydriverfor targeting thiscatchment isflooding.However,there are otherpriorityareasand driverswhich will be affected byNFMand candetermine the mostappropriate type of NFM forthe catchment. These are mapped inthe following pages.

12
Priority Areas and Drivers
Flooding
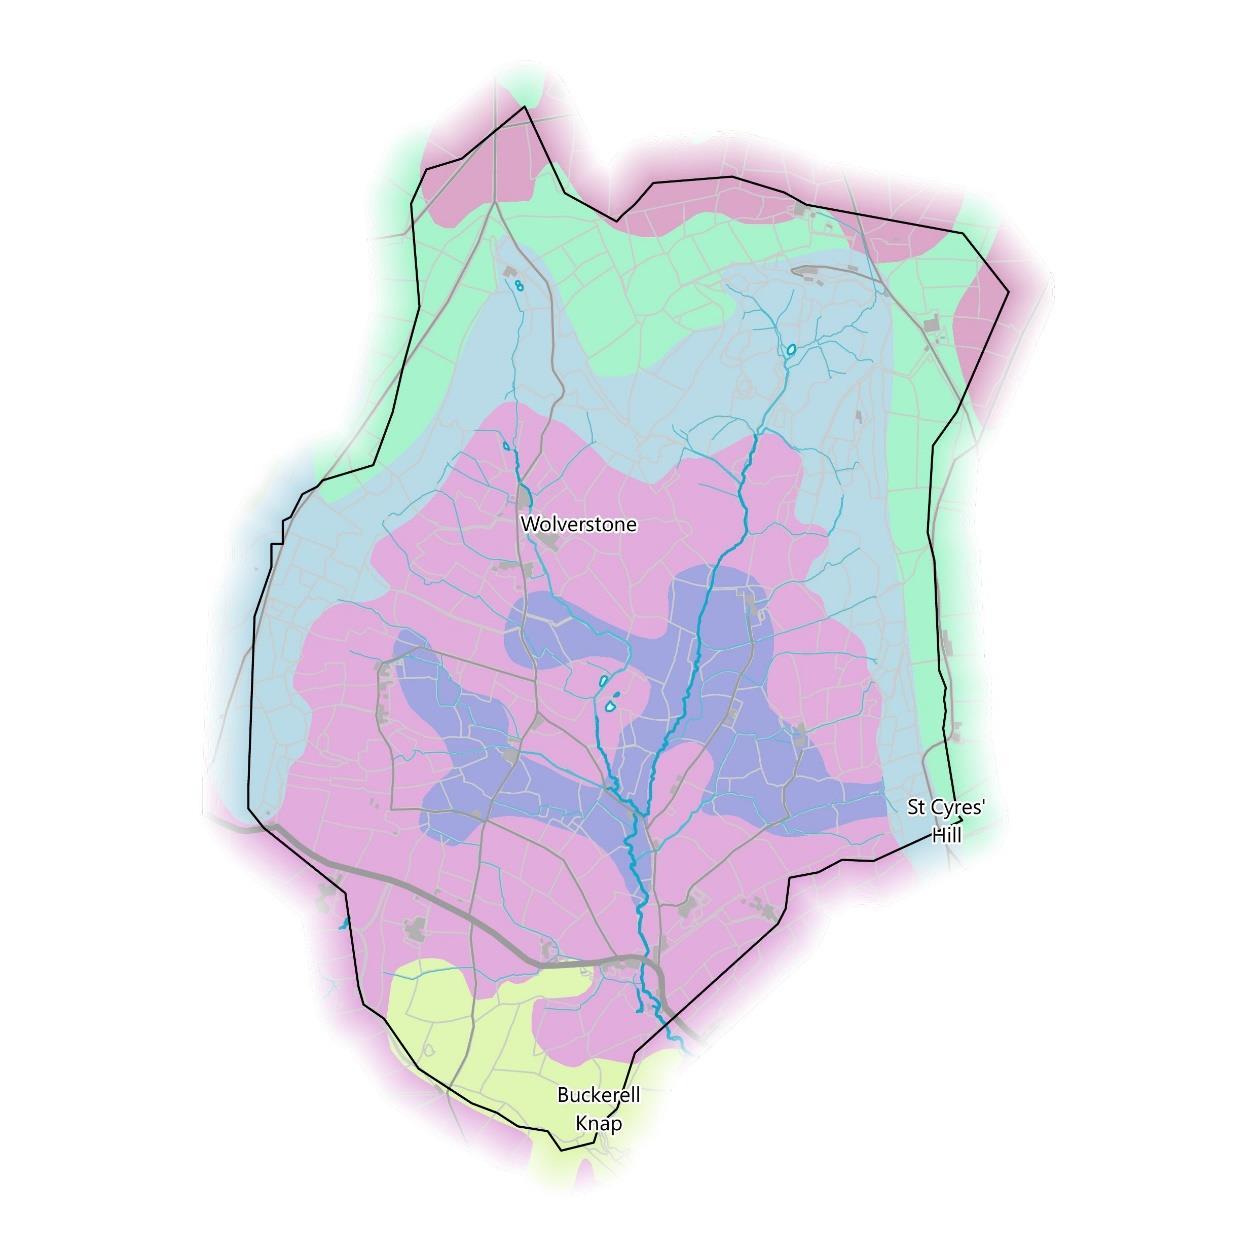
The Neighbourhood Flood Vulnerability Index (NFVI) characterises vulnerability as communities likely to experience losses in wellbeing during flood events. This is based on their susceptibility, preparedness, responsiveness, and ability to recover, all without significant support from emergency services.

Roughly a quarter of the catchment is classed as “Average” in the NFVI, meaning the community are as vulnerable to losses in wellbeing from a flood event as the UK average. The rest of the catchment is classed as “Relatively low”, meaning they are slightly less vulnerable than the UK average.

13
Priority Areas and Drivers
Flooding
The Social Flood Risk Index (SFRI) is a geographic measure of flood disadvantage. It identifies communities who are both exposed to flood risk by living on a flood plain and who are more vulnerable to the effects of flooding, due to factors such as health, preparedness and the availability of community support. Higher numbers of people living in a flood plain coinciding with high social vulnerability result in higher index values. The map highlights neighbourhoods identified as at riskof fluvial flooding higher than the national average. Please note that this is based on flood risk from rivers and the sea, so coastal areas may not be affected by changes in land management upstream.

At present, the north astern quarter of the catchment is classed as “Low” in the SFRI for river and coastal flooding, though this doesn’t increase in future projected scenarios of 2 and 4 degree temperature increases by the 2050s. The rest of the catchment is classed as “exposed” but the NFVI remains below the UK mean in all scenarios.

14
Priority Areas and Drivers
Flooding
When considering flooding, it is necessary to investigate records of previous flood events and combine this with modelled scenarios of what could happen, particularly in the face of the uncertainty of climate change affecting weather patterns.
The River Wolf has previously flooded in July 1968 and more recently in October 2008 where channel capacity was exceeded with no raised defences and there are 7 buildings falling within the recorded flood outlines. There are currently no flood defences in the catchment.
The EA’s modelled fluvial Flood Zone 2 dataset show areas predicted to flood from rivers in a storm event so severe it is likely to occur only once every 1000 years. This is also known as a 0.1% Annual Exceedance Probability. Flood Zone 2 was used to identify buildings potentially at flood risk as shown previously on page 8. This extends half way up the catchment and extends some of the way up the 3 southernmost tributaries
The EA’s Risk of Flooding from Surface Water (RoFSW) dataset shows the extent of flooding caused by rainwater flowing across the ground towards the nearestwater course in a 1 in 1000 year storm event. This overlaps frequently with Flood Zone 2, but also shows depressions in the ground where surface water will accumulate. This covers the whole length of the River Wolf and much of the length of all the tributaries. There is a particularly large area south of Wolverstone spreading across the land around 3 ponds. There are also a series of depressions where surface water accumulates at the confluence of the River Wolf and its main tributary.

15
Priority Areas and Drivers
Flooding
The flood riskmodelled above appears to be accurate as the downstream river valley is more prone to breaking its banks. The greater flood risk is thought to be the village of Awliscombe itself which is immediately downstream of the mapped area and has flooded in the past; particularly in the 2008 extreme rainfall.
The community has an ongoing interest in the wider catchment as part of its concerns about flooding.
The Awliscombe Parish Council website states that it ‘became part of the flood management group involved in discussions with the Environment Agency and higher principal authorities’. No further information on this is available online, but there appears a willingness by the community to acknowledge and respond to the issue.


The Blackdown Hills AONB Nature Recovery Plan also has mention of nature recovery in the upper catchment being used to help alleviate flooding.

16
Priority Areas and Drivers
Water Quality
Clean and plentiful water is vital for a huge variety of our activities, and for supporting healthy ecosystems. Good water quality supports an efficient water supply, healthy natural habitats and cultural ecosystem services. A plentiful water supply is important for drinking water and household use, irrigation, industrial use and for maintaining habitats. Water quality is a key underpinning for the Water Framework Directive.
There are Water Framework Directive monitoring sites in the southeast of the catchment near the A373 main road. The site to the north of the A373 is for monitoring pH and other physico chemical quality elements, whilst the site south of this is for fish and other biological quality elements.
The catchment does not fall within a Nitrate Vulnerable Zone (NVZ) or Drinking Water Safeguard Zone for surface or ground water.
However, the southwestern half of the catchment overlaps with a Ground Water Source Protection Zone III Total Catchment which is defined as the total area needed to support the abstraction or discharge from the protected groundwater source.

For more information on water quality go to slide 26.

17
Priority Areas and Drivers

Water Quantity and Drought Risk
The amount of water available for abstraction is an indicator of how much drinking water is available for people. The catchment sits within an area not currently available for licensed water abstraction (left map) but is bordered to the north by an area where water is available for licensed abstraction. This area also falls just within the catchment boundary on top of the plateau.


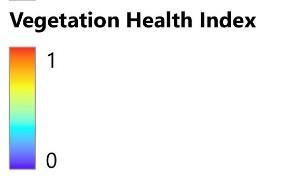
In the context of NFM, it is also necessary to consider water availability for plants and wildlife. Drought can cause vegetation to die back, leaving bare soil exposed and more vulnerable to erosion and runoff when it eventually rains. The Vegetation Health Index (VHI) uses satellite data to combine temperature and vegetation condition to characterise vegetation health. Areas are scored between 0 and 1 with lower values indicating low drought risk to plant health and higher values indicating higher risk. The catchment is scored relatively high at 0.612 on the VHI (right map), indicating relatively high risk to plant life from drought stress. The eastern border of the catchment is scored slightly lower at 0.466, indicating slightly below average risk.
18
Priority Areas and Drivers
Designated Sites
Designated habitat sites, from small local nature reserves all the way up to large national parks, need to be protected for the wealth of benefits they provide to people and the environment, including already providing some degree of NFM. A site being designated can be an indicator of habitat health.
The majority of the catchment (north of the A373) falls within the Black Down Hills Area of Outstanding Natural Beauty. Aside from this, there are no other designated sites for habitats present.

19
Priority Areas and Drivers
Air Quality
Clean air is important for people’s health and for healthy ecosystems. Air quality is the term used to describe the levels of pollution in the air. When air quality is poor, pollutants in the air may be hazardous to people, particularly those with lung or heart conditions. In the past, the main air pollution problem was smoke and sulphur dioxide from fossil fuels such as coal. Now, the major threat to clean air is from traffic emissions. Petrol and diesel motor vehicles emit a variety of pollutants, principally carbon monoxide (CO), oxides of nitrogen (NOx), volatile organic compounds (VOCs) and particulate matter (PMx).
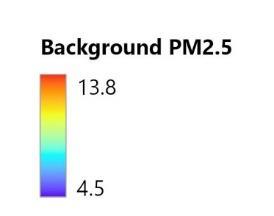
A growing body of researchsuggested that smaller particles, in particular PM less than 2.5μm in diameter (PM2.5), is a metric for air pollution which is closely associated with the adverse health effects of poor air quality. Therefore, this section will use data relating to PM2.5 where relevant.
Improvements to the soil and surrounding environment have the potential to also deliver improvements to air quality through natural filtering processes.
The micro catchment has relatively low concentrations of air particulate matter from emissions with some small areas showing slightly higher concentrations, such as the region in the east, just north of the A373. This measures at 6.85PM2.5, while the lowest recorded measurement of 6.59PM2.5 is directly north of it.
20
Priority Areas and Drivers
Tourism and Recreation
Areas and features important for tourism and recreation may also be at flood risk and it is necessary to protect them for a healthy society and environment.
There is a greenspace featuring a playing field along the eastern boundary of the catchment on top of the plateau.
There is an area of Countryside and Rights of Way (CRoW) Access Land and CRoW Registered Common Land at the northern boundary of the catchment.

A Public Right of Way (PRoW) runs north to south in the eastern side of the catchment from Limers Lane near the greenspace, down the ridge line, through fields to the confluence. Another circular PRoW lies on the western border, just north of the A373.
21
Existing Natural Assets and their Condition
Biodiversity,the varietyof life of earth,is valuable initsown right. Italso supports recreation,food,flood protection and climateregulation. This sectionwill predominantlyexplore whathabitatsand othernatural assetsare presentin the catchmentthat will already be contributing to NFM and could be improved withfurther NFM measures.Water, soilsand crops are natural assets in themselvesand will also be investigated.
22
Existing Natural Assets and their Condition
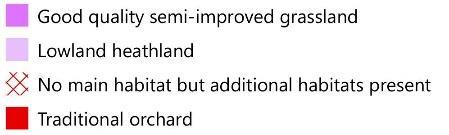
Habitats and their Condition
The natural assets mapped below are habitats which have the potential to support thriving plants and wildlife. Thriving vegetation is very valuable for NFM as it roughens the ground, thereby slowing down surface water flow, meaning water courses are less likely to be overwhelmed in a storm. In addition, plant roots provide structural support for the soil and prevent surface water washing soil into water courses.
Where the assets are present the landscape is likely to be contributing to the provision of habitats, biodiversity and even NFM. Where assets are absent there may be a lack of habitats which contribute to or support thriving plants and wildlife. Assets may still be present however in the form of crops and soils which are mapped in the following pages.
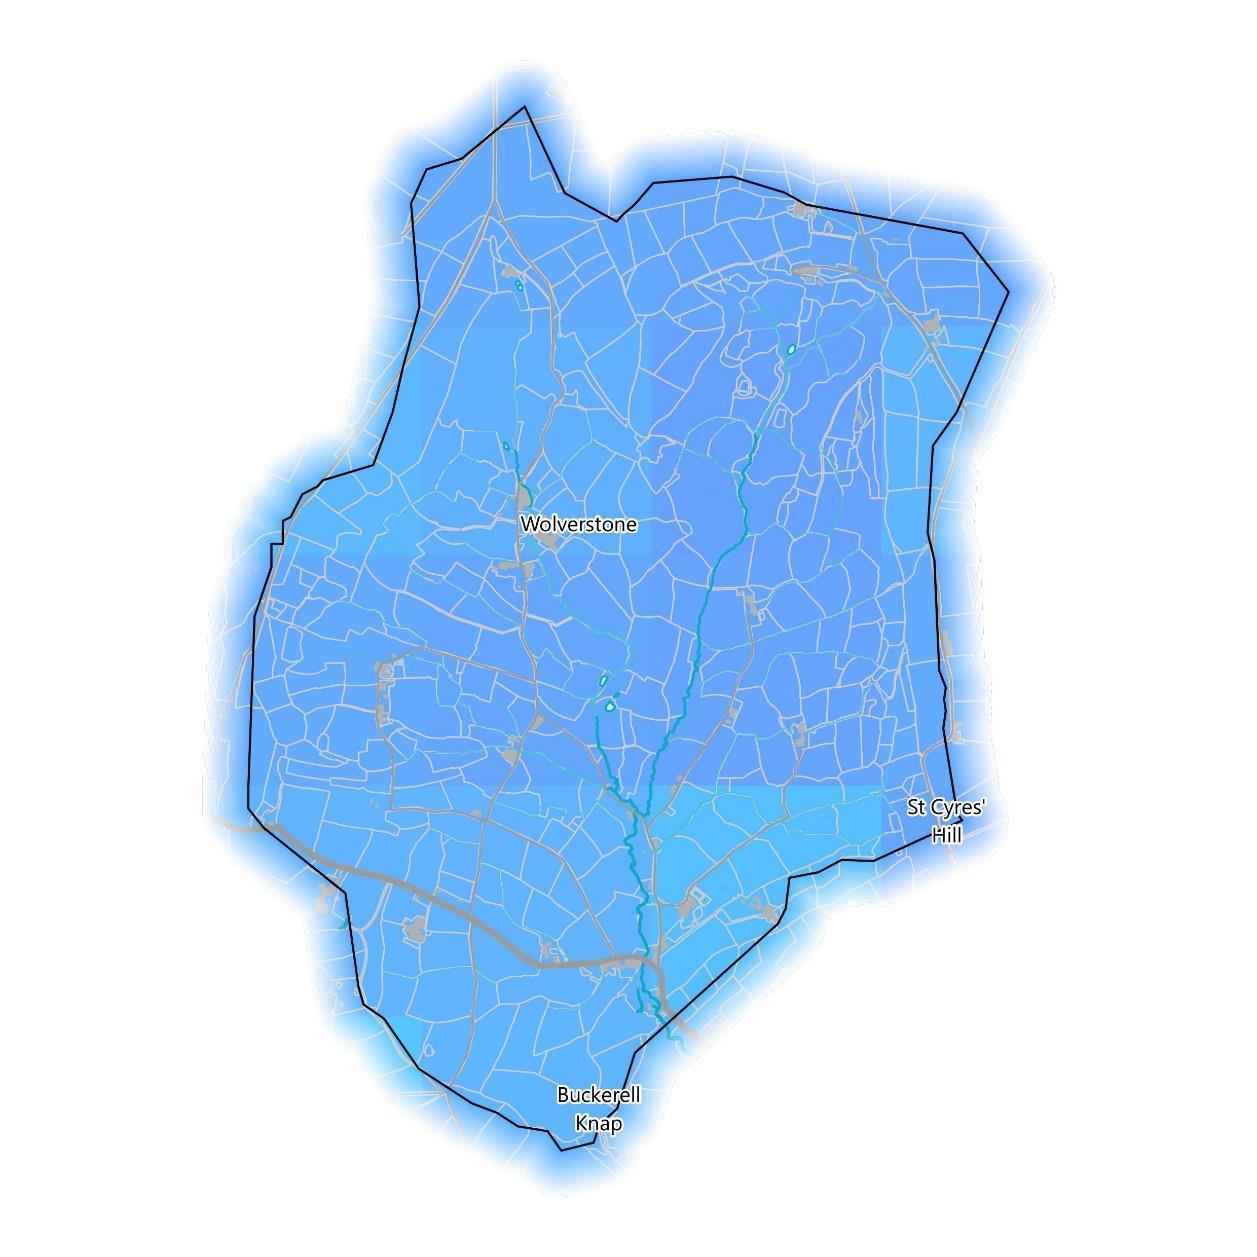
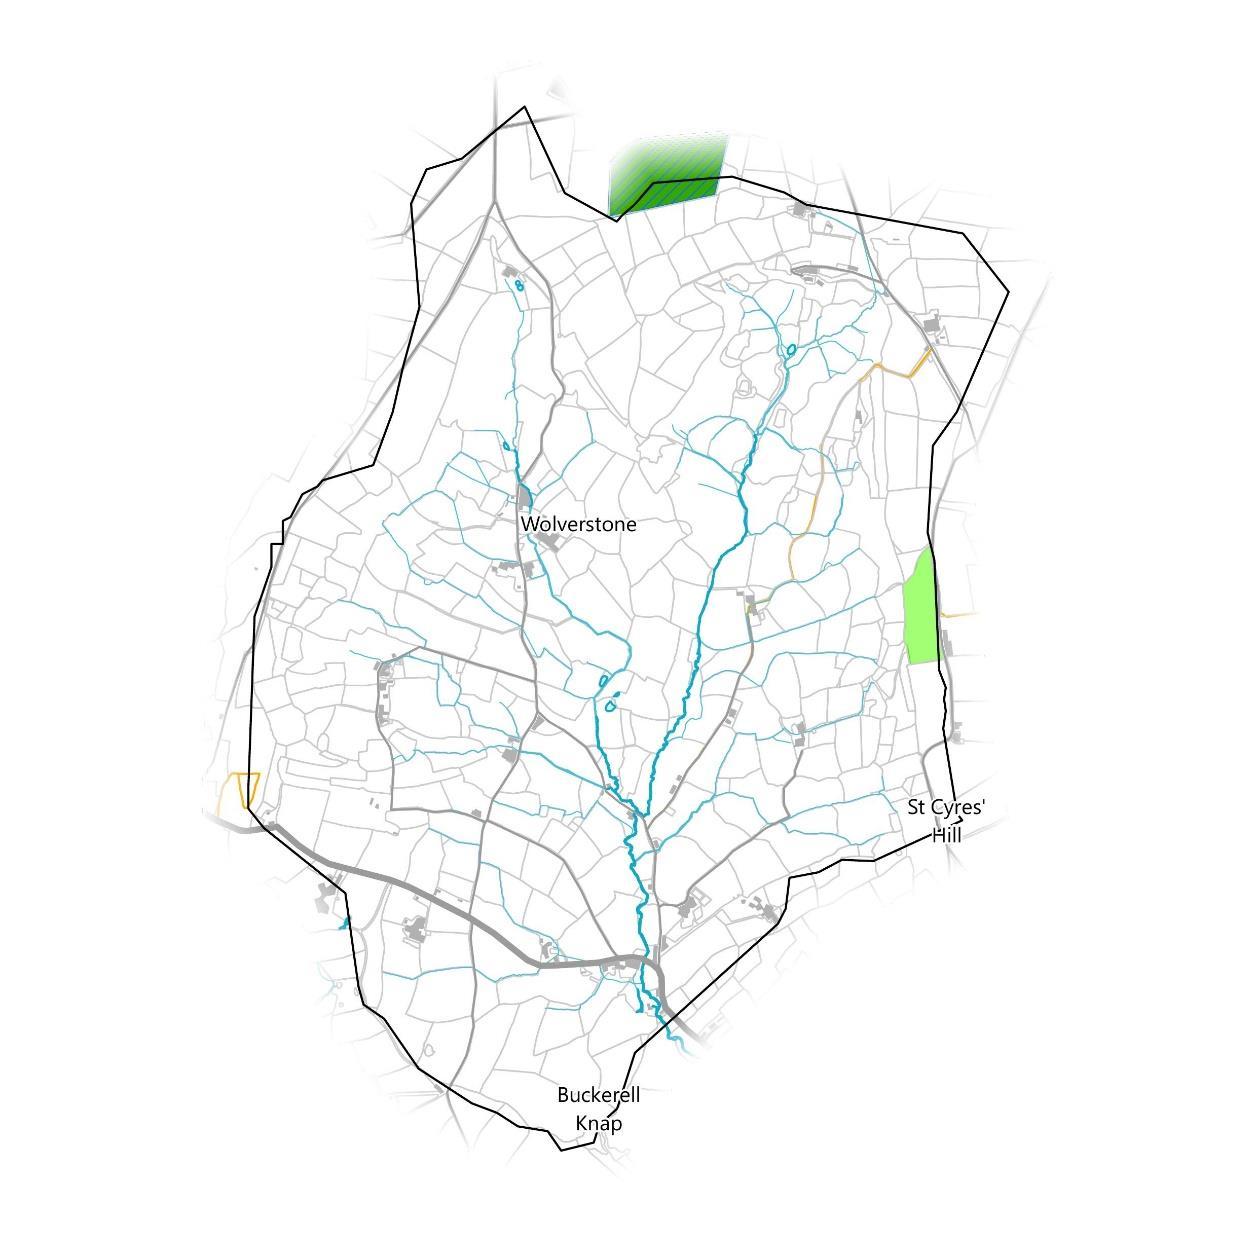
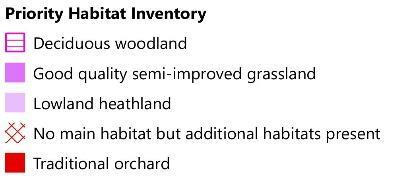
The entire catchment falls within a priority river habitat’s headwater area. There is a large continuous band of broadleaved woodland along the length of the steep ridge in the north, east, and west, all of which is also deciduous woodland priority habitat. The largest area of this in the northeast is also designated ancient woodland. There are areas of mixed and coniferous woodland along the northern and western borders on top of the plateau, as well as three small traditional orchards in the centre of the catchment. At the eastern boundary, the area designated as a greenspace on page 21 is classified as good quality semi improved grassland and there is an area of lowland heathland at the northern border.
The majority of the catchment in the bowl below the ridgeline is comparatively habitat sparse.
23
Existing Natural Assets and their Condition
Water Framework Directive
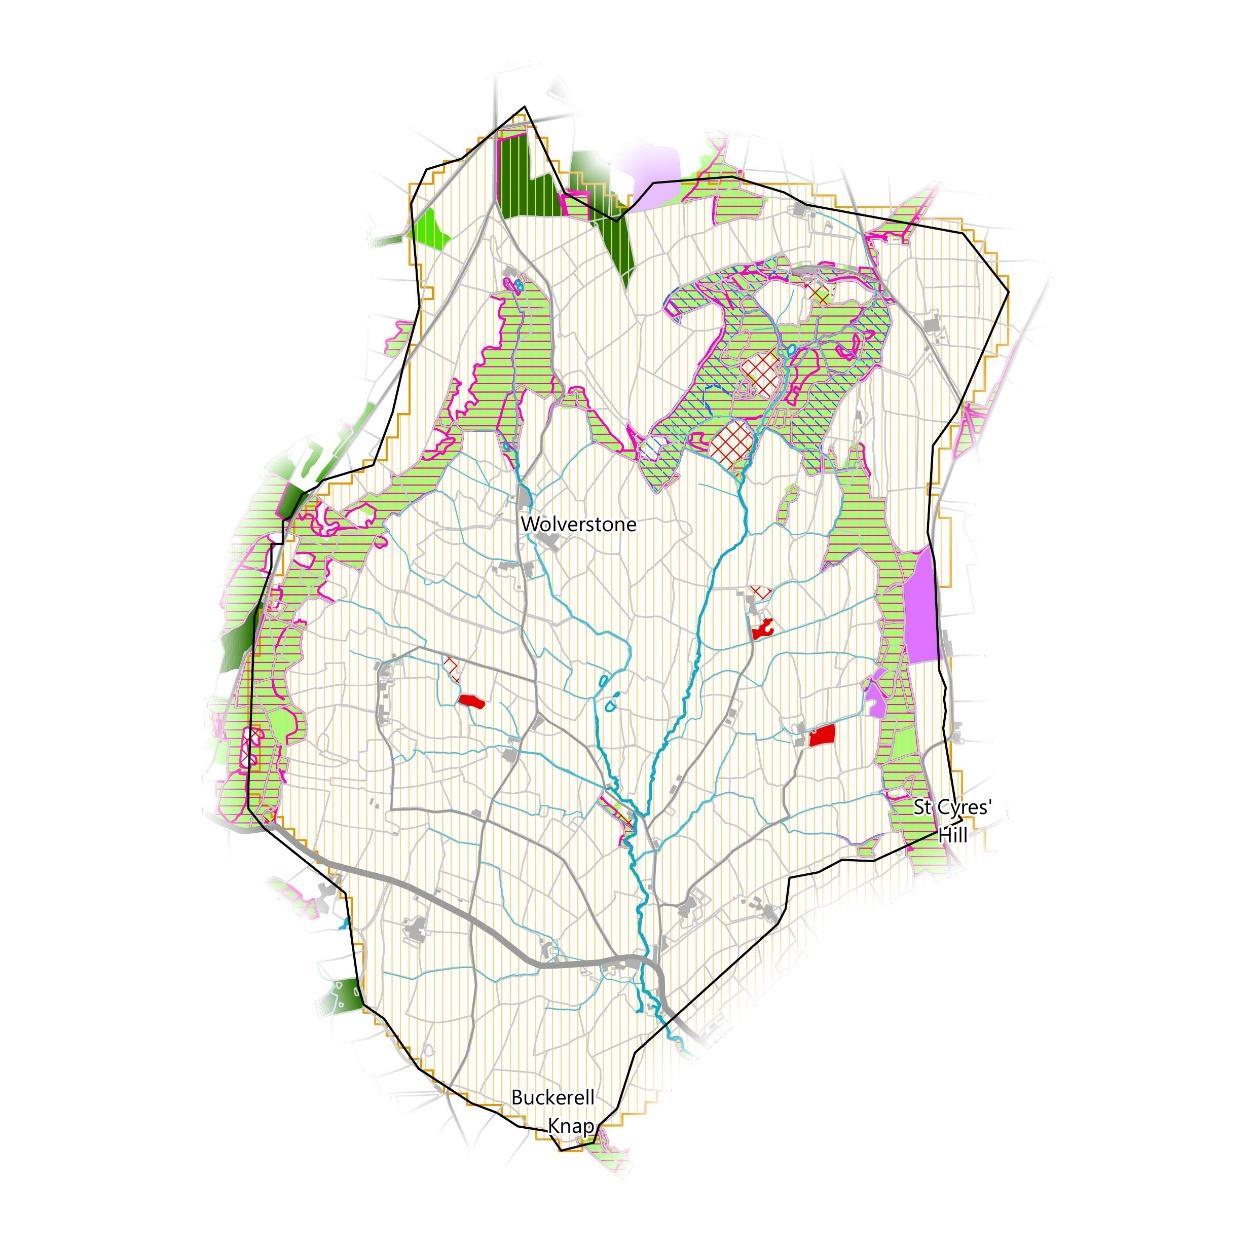
It is important to determine the current condition of water quality. Poor water quality can be detrimental to people, wildlife, and may cause other negative effects during a flood event. Good water quality should always be protected. A key set of evidence used to assess the water quality in a catchment is the Water Framework Directive (WFD). The status of a waterbody is measured using a series of parameters and is recorded on the scale: high; good; moderate; poor; bad (with moderate and worse being regarded as a failure).
The River Wolf (Otter) is a WFD assessed waterbody and is present in this micro catchment. The micro catchment sits within the larger Wolf (Otter) WFD river waterbody catchment, accounting for 74% of it’s area. The Madford river catchment lies just to the north.
The Wolf (Otter) is overall classed as Poor meaning it is failing WFD regulations. It is currently ranked Poor for ecological status and Failing on chemical status. 100% of waterbodies in the UK failed on chemical status after the EA included monitoring “mercury and its compounds” and “Polybrominated diphenyl ethers (PBDE)” into its water quality monitoring methodology.
24
Existing Natural Assets and their Condition
Water Framework Directive
The Wolf (Otter) waterbody is classed as Good for Fish and Good or High for most other ecological quality elements, but is only Moderate for Phosphate and Poor for Macrophytes and Phytobenthos. Its overall ecological status is therefore Poor and consequently failing WFD regulations on ecological grounds.
The reasons for not achieving Good status for Phosphate, Macrophytes, and Phytobenthos are due to poor livestock management.
The waterbody is classed as Good for most chemical classification items, except for the previously mentioned Mercury and its compounds and PBDEs where it is classed as Failing. The waterbody’s overall chemical status is consequently Failing and is therefore failing WFD regulations on chemical grounds as well as ecological.
The are over 60 metrics that the EA can use to monitor waterbody catchment statuses. For more information and a breakdown of this catchment’s status go to https://environment.data.gov.uk/catchment planning/WaterBody/GB108045009190
25
Fish Phosphate Macrophytesand Phytobentos MercuryandIts Compounds Polybrominateddiphenyl ethers (PBDEs) Chemical Status Ecological Status Waterbody: Wolf (Otter) Waterbody ID: GB108045009190
Existing Natural Assets and their Condition
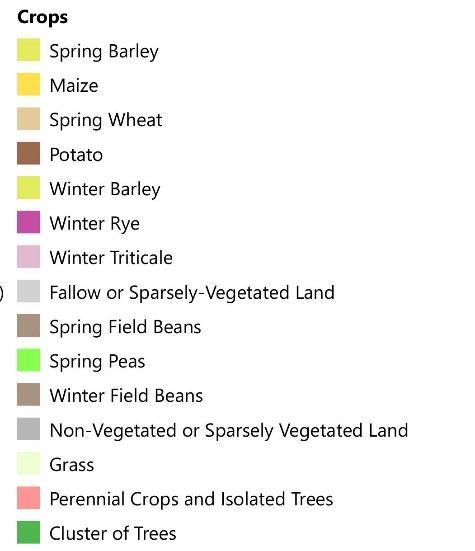
Crops
Crops can be a natural assetin themselves, providing the food we eat and storing carbon. Some crops however, could be considered natural liabilities. One such crop is maize which is planted in wide rows, leaving bare soil exposed and without structural supportfrom roots. Furthermore, it is often harvested in late Autumn when the weather becomes wetter, meaning little to no vegetation can regrow to protect it over Winter. This leaves the soil much more susceptible to being carried away by surface water runoff. Despite this, maize can be successfully managed to grow and harvest while minimising runoff.
The Crop Map of England (CROME) dataset is derived from satellite data and generalised to hexagons. It identifies the majority of the catchment as grass with clusters of trees along the ridgeline and on top of the plateau. There are some large scattered areas where maize and barley are grown as well as several non vegetated areas, including the small urban area of Godford Cross, just south of the A373.
26
Existing Natural Assets and their Condition
Soils
The nature of the soil can determine how much surface water infiltrates into the ground, as well as what plants will growand where. Understanding soils is vital to providing effective NFM and improving water quality. The aim with water quality improvements is to keep the soil on the land and improve groundwater infiltration and recharge, therefore allowing a slower and more naturally filtered water route to the river.
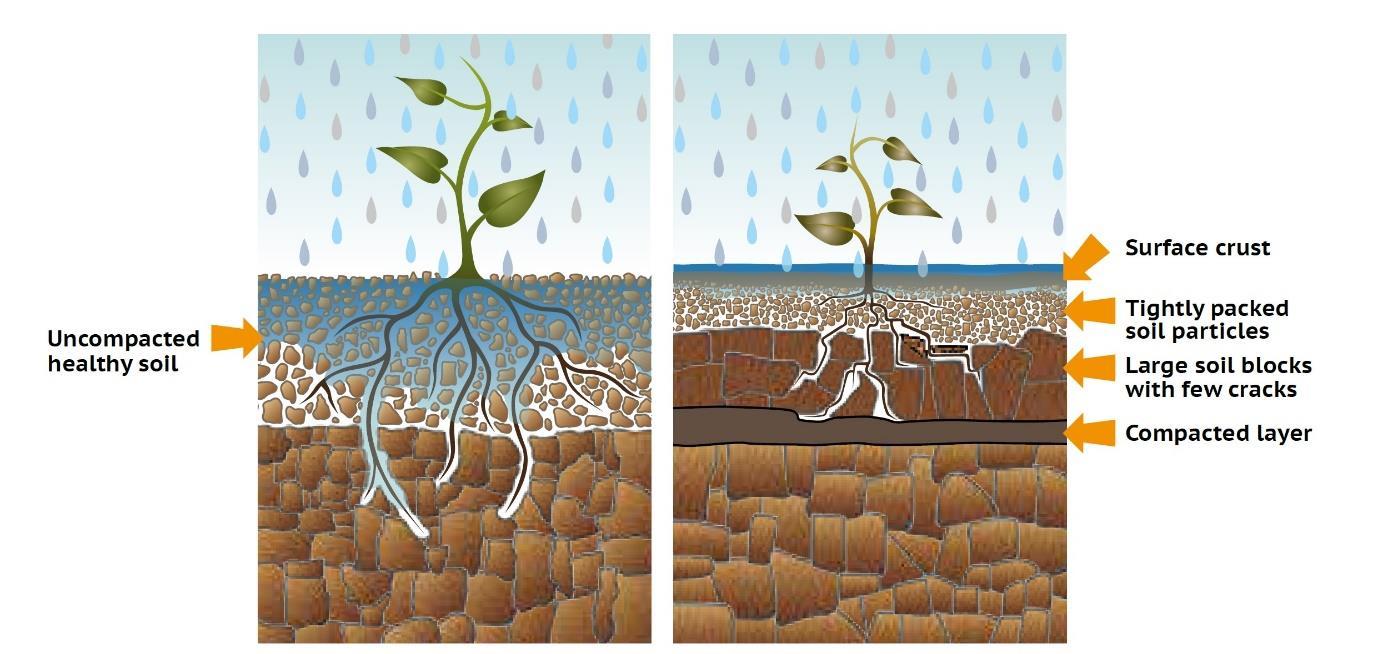
Degraded soil structure, where the soil profile is compacted at shallow depths or capped at the surface and impermeable can lead to excessive unnatural run off of surface water instead of percolation and infiltration. More than 60% of soils in Devon and Cornwall are naturally well drained and should rarely become saturated.
The Farming Rules for Water (FRFW) were introduced at the start of 2018 as legislation to help protect surface water quality. The regulations are designed to help manage cultivated agricultural land well, without over management, nutrient run off, or waste affecting surface water.
The diagram above shows good soil structure on the left and compacted soil structure on the right. In compacted soil, little surface water can infiltrate into the soil subsoil due to surface capping or compacted layers, while vegetation can be deprived of oxygen due to compression of pores that normally transport air and water (sourced from SEPA NFM Handbook).
27
Existing Natural Assets and their Condition
Soils
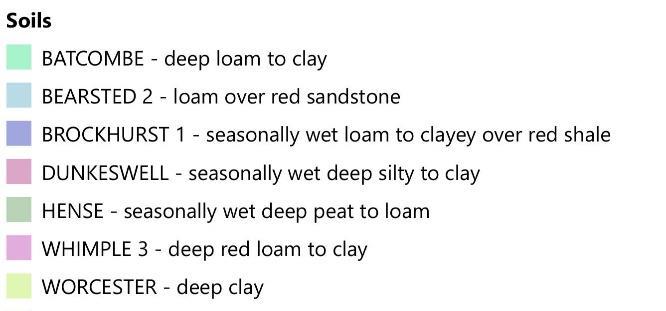
The NATMAP soils dataset from Cranfield University shows that the south of the catchment, below the A373 is comprised of the soil dataset WORCESTER. Above this, a large part of the catchment in the bowl below the ridgeline is DUNKESWELL with an area of BROCKHURST 1 within this. The ridgeline surrounding the bowl is made up of BEARSTED 2 with BATCOMBE on top of the plateau. The northern boundary is largely comprised of WHIMPLE 3.
Soil health in the catchment appeared adequate or poor through general observation and further investigation may be needed to conclusively determine the fertility or if there is underlying issues with compaction.
The initial walkover was not carried out by a soil expert, but there appeared to be some fine clay content in the soil. Soil health in the catchment wasn’t determined as further investigation will be required, but the majority of arable land use appeared to be intensively managed which could suggest it would be advantageous to look closer at soil health for the benefit of food production as well as natural function.
Anecdotal evidence would suggest there could be some soil issues as some colouration of the stream bed was observed, but this could be very difficult to avoid in some areas with steep topography and highly mobile factions of soil.
28
Existing Natural Assets and their Condition
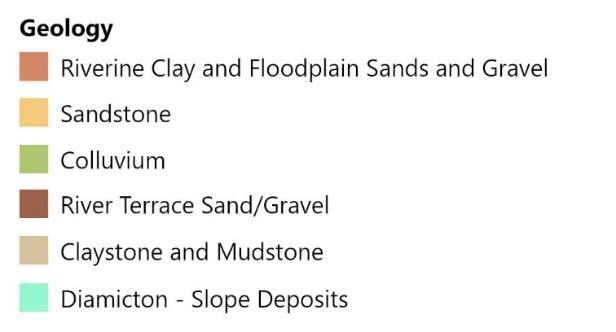
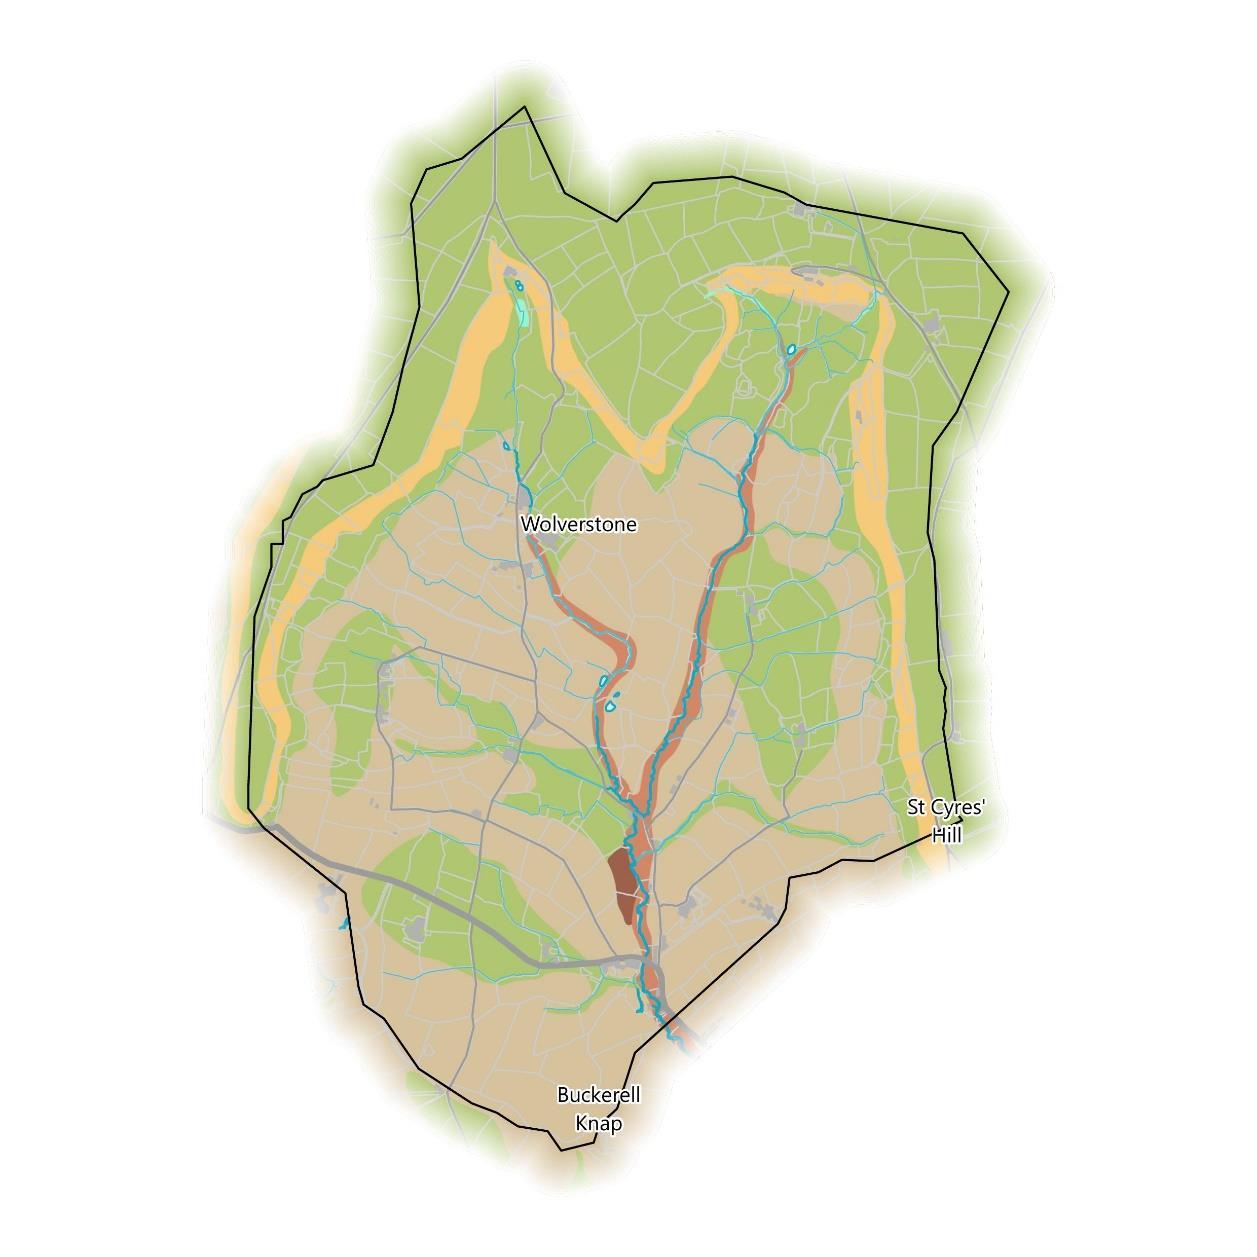
Geology
Geological conditions impacts groundwater and soil type. When rocks are sufficiently permeable it can lead to groundwater flooding. If local flooding is caused be groundwater levels then it is unlikely that changes to land management and NFM will improve flood resilience.
The majority of the south and central bowl of the catchment is comprised of claystone and mudstone with patches of colluvium. The northern ridge is made up of sandstone and to the north and south of this is colluvium. The River Wolf and its largesttributary have underlying river terrace sand/gravel.
29
Issues
Multiple issues have already been mentioned and mapped that could be contributing to flood risk and WFD failures. However, there are further potential issues that may be influential which will be explored in the following pages.
30
Pollution and Abstraction
Pollution incidences themselves will directly affect water quality, but consented discharges into watercourses and chemical runoff from roads exacerbated by rainwater may also be sources of pollution.
There are no recorded pollution incidences in the catchment but there is a consented discharge for treated effluent from a domestic property into a soakaway in the southeast of the catchment.

Licensed water abstraction points may serve as sources of risk to ground water quantity and availability. However, there are no water abstraction points present in this catchment.
Issues 31
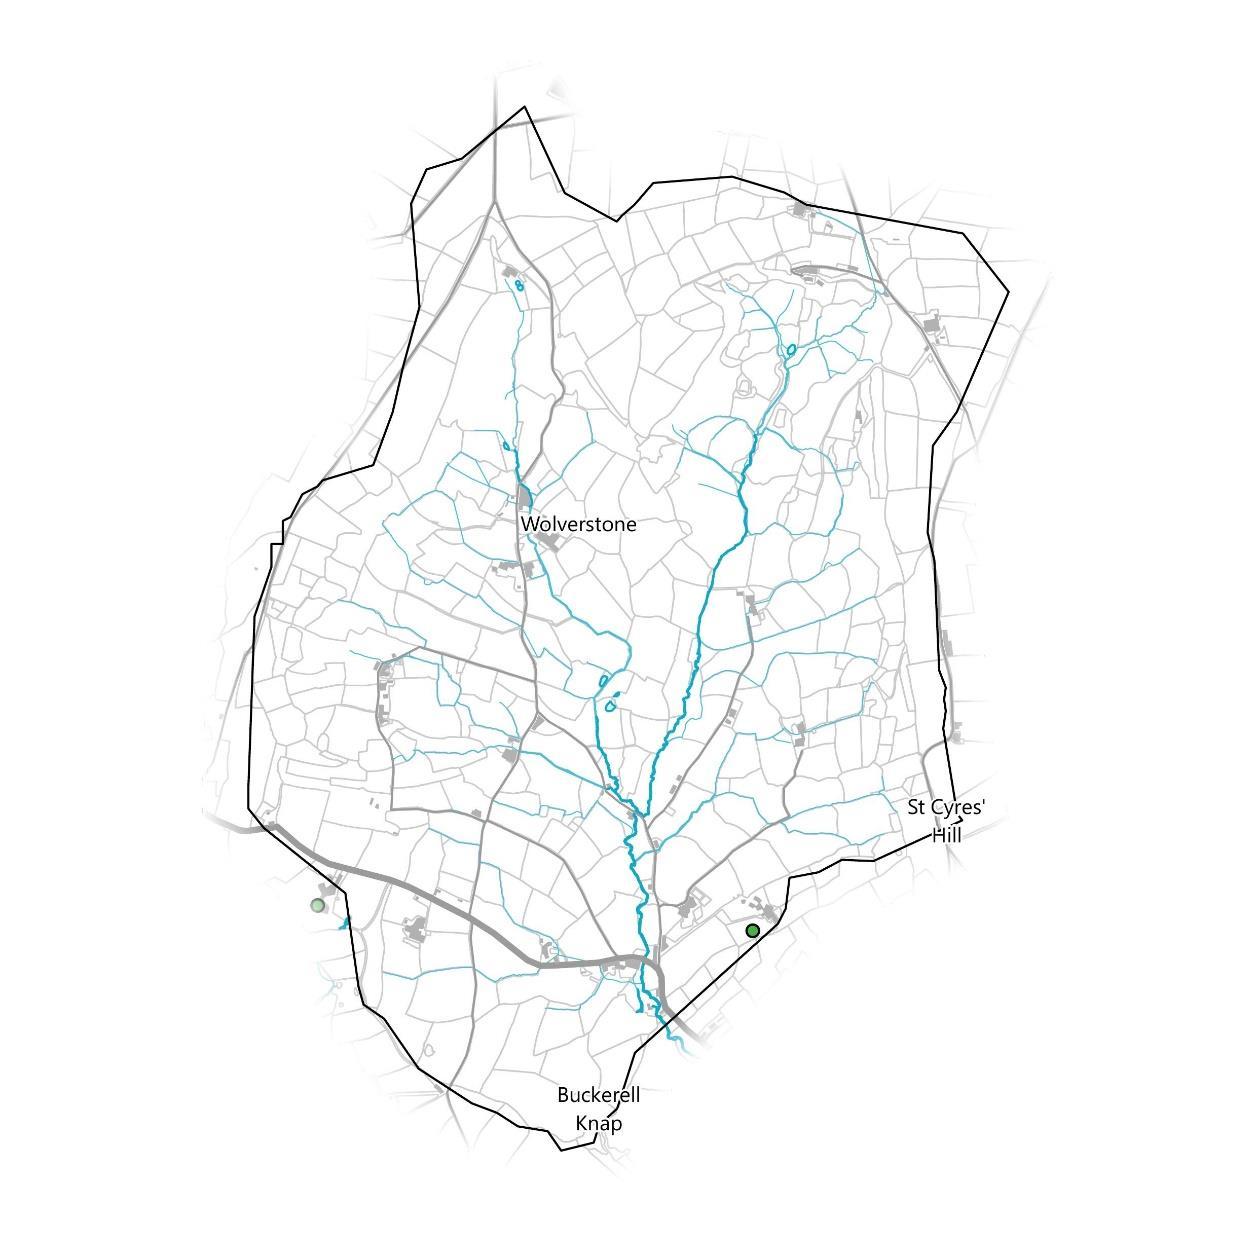
Hydrological Connectivity
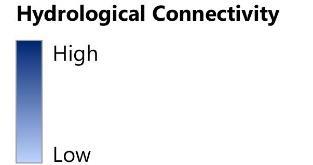
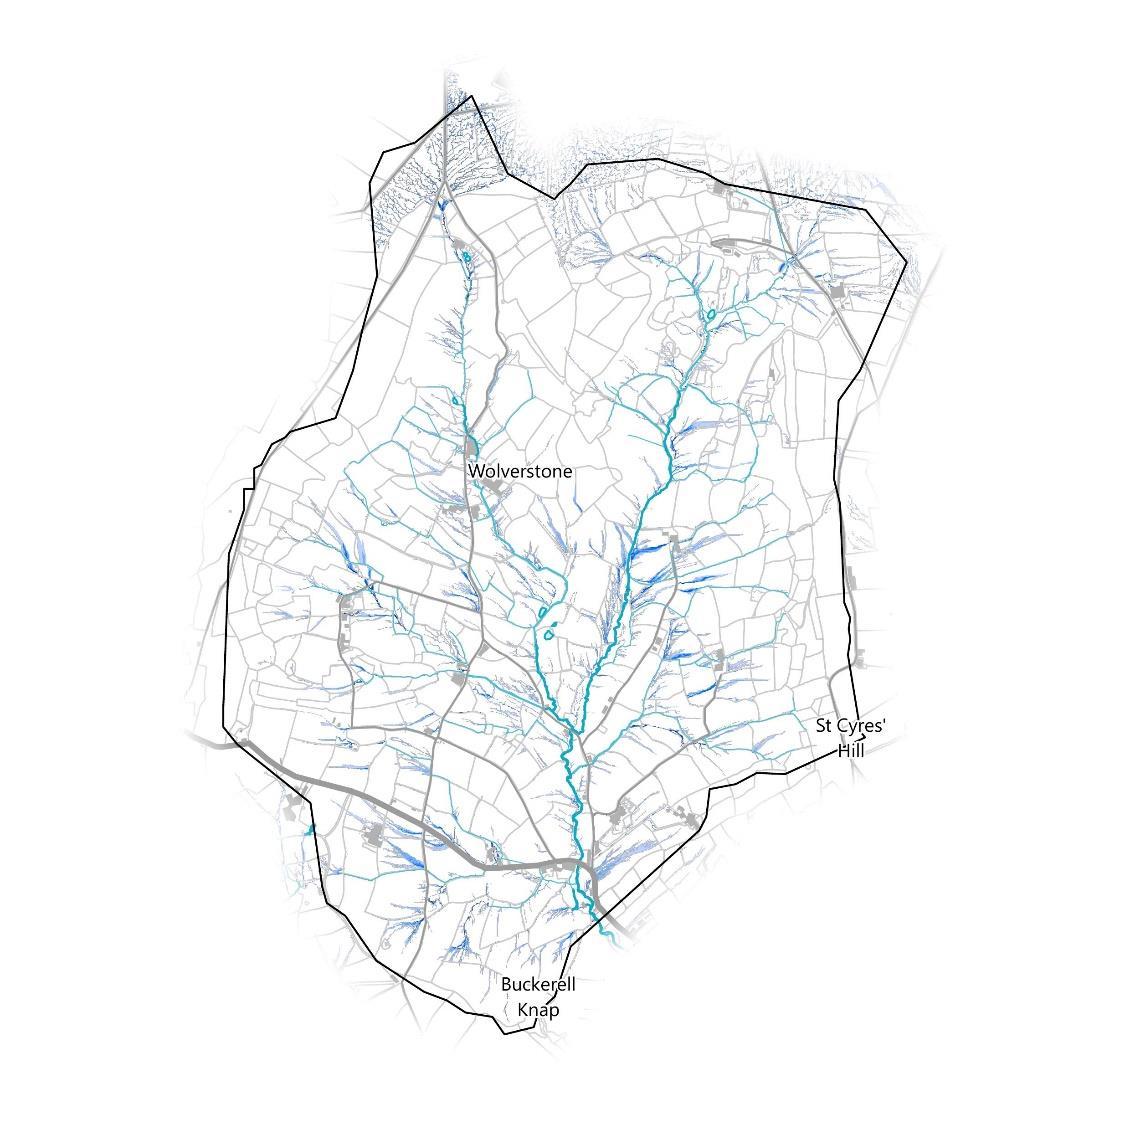
Surface flow pathways are the routes rainwater accumulates and follows when it lands to the nearest depression or watercourse. As it flows, surface water can pick up any number of chemicals, soil, and debris and carry them into the watercourse with it. This serves to demonstrate why community engagement and working with land owners is so important, as the effects of practices upstream in the catchment cascade down via these routes. Pathways have been modelled in 2 different ways here.
The first are modelled using topographic data and software called SCIMAP (left). Only the routes with above average wetness are shown. The flat topography of floodplains can skew the modelling process and any pathways in these areas should be considered unreliable.
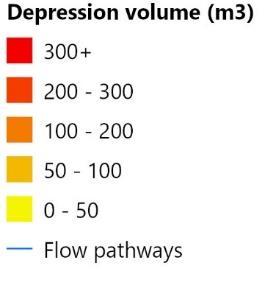
The second method uses SCALGO Live (right). Flow routes with at least 1km2 upstream area are shown. Areas that would be flooded if 15cm of rain were to fall during a storm event are also mapped. Flooded areas are coloured by their water volume from light to dark.
Issues 32
Issues
Issues Identified During Walkover Surveys
During the walkover surveys, experienced surveyors at WRT recorded points of interest and concern, as well as potential natural flood management opportunities.
Maize grown on steep fields can be classed as a high risk land use for the amount of water and for water quality.
This is due to a normally late harvest which leaves soils bare for the winter when wetter, and possibly more extreme, weather would be expected.
The machinery used for whole crop maize is usually large and a frequent problem associated with this crop and soil health is compaction or capping of the soil profile which reduces fertility and doesn’t allow water to infiltrate.
Where soils are presentwith some or high clay content, this can compound the risk of both compaction, and of becoming highly mobile in surface water flow.
High volumes of water on steep ground is likely to wash soil away; compromising water quality, water quantity and soil health, nutrition and natural function.
33
Opportunities
34
Opportunities
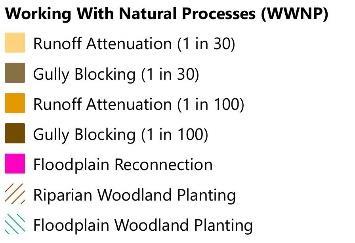
Working With Natural Processes
There are many options to reduce flood and coastal erosion risk across the country which involve implementing measures that help to protect, restore and emulate the natural functions. These options are known as Working With Natural Processes (WWNP) or Natural Flood Management (NFM). These measures increase flood resilience by slowing the flow of water and disperse energy to keep the water at the top of the catchment or to improve groundwater infiltration and recharge, therefore allowing a slower and more naturally filtered water route to the river.
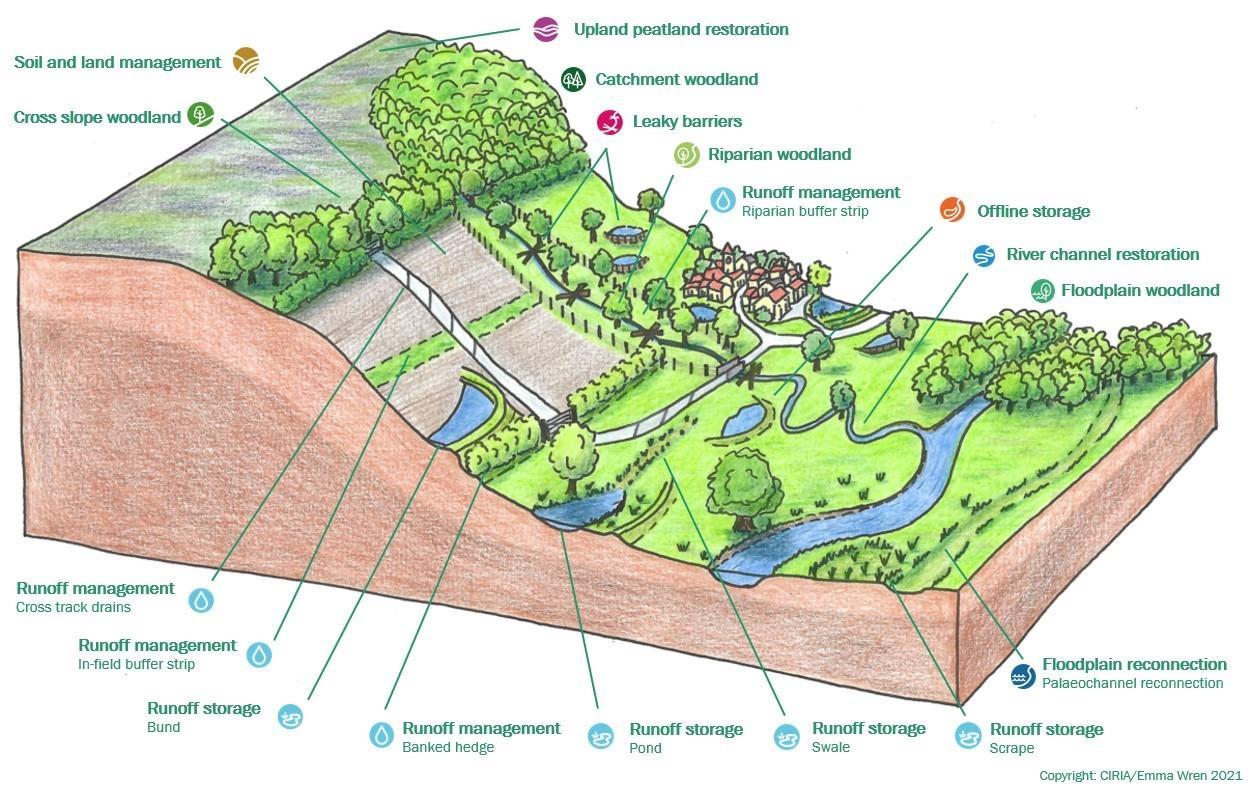
Where rapid surface water run off has been noted there may be opportunities for WWNP to mitigate both water quality and to regulate flow. An example of some NFM interventions are given below. They are intended to slow water, store water, increase infiltration and intercept rainfall.
The illustration above shows various natural flood management techniques (sourced from CIRIA).
35
Opportunities
Working With Natural Processes
The Environment Agency have mapped potential opportunities for WWNP to reduce flood and coastal erosion risk across the country. These include opportunities for different types of woodland planting, floodplain reconnection features like restored riverside wetlands and meadows, and runoff attenuation features which aim to slow pathways of water across the land, like storage ponds or leaky barriers. Anumber of areas are also excluded from the woodland maps such as urban areas and existing woodland. These are mapped separately on page 39.
The greatest opportunity identified by these WWNP datasets for the catchment is riparian tree planting along the length of the River Wolf and all of its tributaries. This could be combined with floodplain woodland planting in the downstream areas of the catchment.
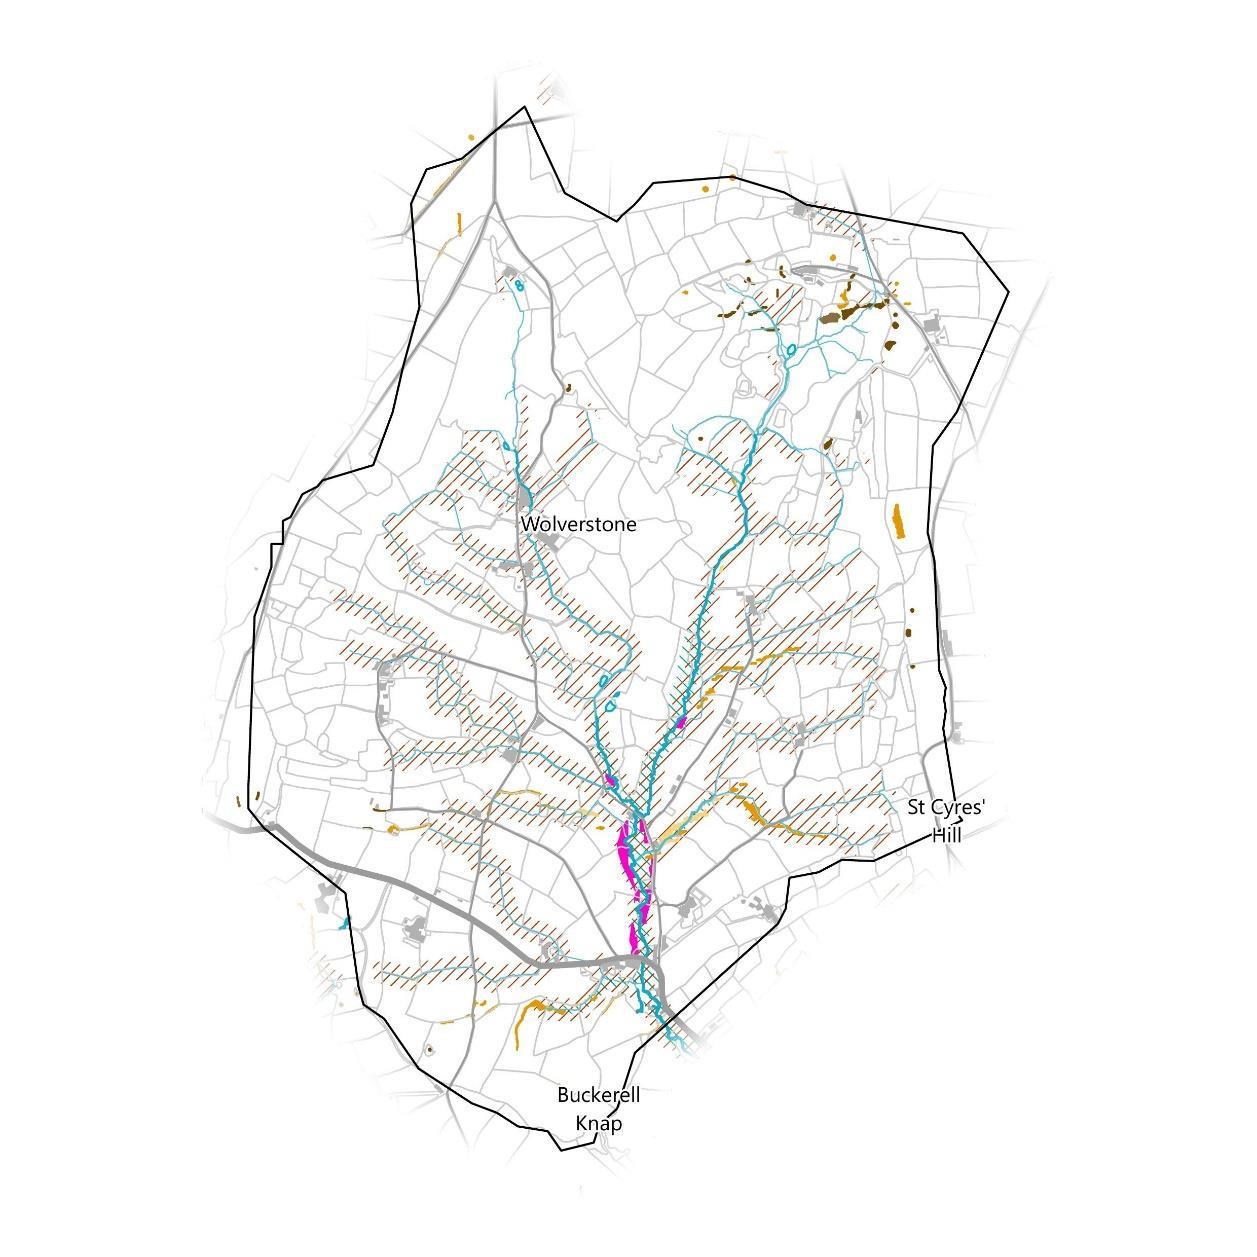
In addition, there are opportunities to construct smaller scale runoff attenuation features along 3 of the smaller streams that are strategically placed to slow the flow of surface water before it reaches the water course, allowing excess water to dissipate rather than flood during a storm event. Some gully blocking might be possible at the source of the River Wolf on the ridge line.
Furthermore, it may be possible to reconnect some small areas of floodplains downstream in the catchment near the A373.
36
Opportunities
Habitat Creation and River Restoration Projects
There may be current habitat creation and river restoration projects where opportunities exist to work together with organisations to provide simultaneous benefits to habitats, rivers, and flood resilience.
Natural England have also identified opportunities to expand on existing habitats to create habitat networks across the landscape.
While there are no recorded habitat creation or river restoration projects in the catchment,there are significant opportunities for expanding habitat networks around existing priority habitats (see page 28).
There are several small areas of Restorable Habitat in the central north region of the micro catchment,definedas “Areas of land, predominantlycomposed of existing semi natural habitat where the primary habitat is present in a degraded or fragmented form, and whichare likely to be suitable for restoration.”
There is a Fragmentation ActionZone just outside the southwestern border. Natural England defines these as “Land immediatelyadjoining existing habitat patches that are small or have excessive edge to area ratio where habitat creation is likely to help reduce the effects of habitat fragmentation.”
There are three large areas classed as Network EnhancementZone 1, defined as “Landwithin close proximity to the existing habitat componentsthat are unlikely to be suitable for habitat re creation but where other types of habitat may be created or land managementmay be enhanced includingdelivery of suitable Green Infrastructure.”
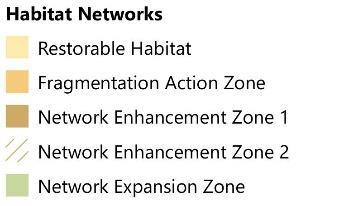
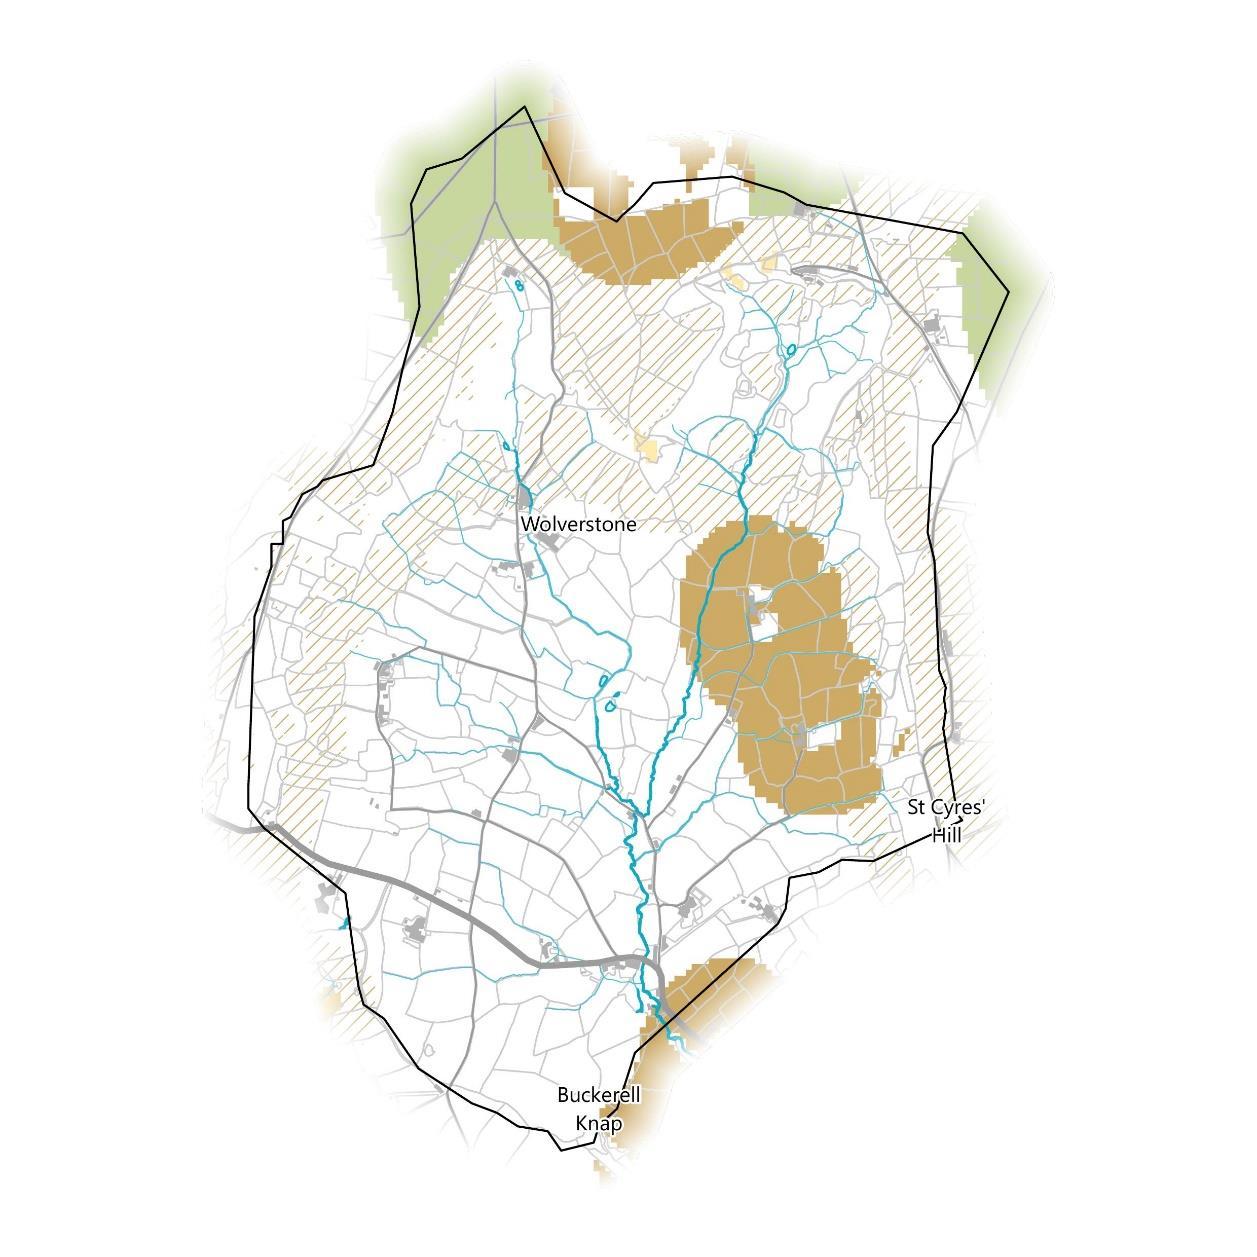
At the northeast and northwest borders of the catchmentis the Network Expansion Zone, defined as “Land withinrelatively close proximity to the Network EnhancementZones that are more likely to be suitable for habitat creation for the particular habitat and identifyingpossible locationsfor connectingand linking up networks across a landscape.”
Running parallel to the north and south of the steep ridge in the north Network EnhancementZone 2, “Land withinclose proximity to the existing habitat componentsthat are unlikelyto be suitable for habitat re creation but where other types of habitat may be created or land management maybe enhanced including delivery of suitable Green Infrastructure.”
37
Opportunities
Agri-environment Schemes
Agri environment schemes are government initiatives that aim to financially compensate farmers for providing benefits to wildlife on their land. Areas under agri environment scheme agreements may provide opportunities simultaneously for the landowner to meet the agreement’s objectives and deliver NFM to benefit the catchment community.
There are land parcels on the southeast and southwestern boundaries which are under Environmental Stewardship Scheme Agreements. In the southwest are two areas under Organic Farming Scheme Agreements.
There may be opportunities for land owners in the rest of the catchment to enter into agri environment schemes. Habitat creation may be facilitated in the Habitat Enhancement and Expansion Zones in the eastand around the ridgeline as identified on page 37 if land owners were to enter into an agri environment scheme.
38
Opportunities
Restrictive Areas
A further consideration for the targeting of NFM via soil improvement, habitat enhancements, restoration or creation is existing areas which may not be suitable for changes in land use or land management. This may be because they are already valuable sites for wildlife (e.g. designated wildlife sites), because the land use is difficult to change (e.g. urban land) or because the land is highly valuable for farming (high grade agricultural land). There may be further historic or natural heritage designations to consider.

The Black Down Hills AONB designation (see page 23) north of the A373 in the catchment may provide administrative challenges, as will the deciduous woodland, good quality semi improved grassland, and traditional orchard priority habitats. However, there is still the opportunity to improve these habitats and designated sites further by getting more partner organisations involved in the process and even access additional sources of funding.
The WWNP woodland constraints dataset highlights any urban areas and existing woodlands (including woodlands not listed as priority habitats not shown here) where additional tree planting may be difficult. This excludes the ridgeline and much of the top of the plateau in the north of the catchment. The centre and southern areas of the catchment on the other hand have few to no constraints.

The agricultural land grade is grade 3 across most of the catchment which is considered average. The ridgeline and immediately adjacent to the River Wolf at the bottom of the bowl is grade 4, which is considered poor. However, there are patches of grade 2, good quality, agricultural land around Wolverstone and the downstream areas around the A373 and Godford Cross. Changing the land use from agriculture to other habitat creation in these areas may prove difficult, but will be less of an issue in the restof the catchment.
There are two scheduled monuments present. Hembury Fort, the larger of the two, straddles the western boundary on the top and edge of the plateau. The other small scheduled monument is called Row Barrow and sits on the northern boundary on the CRoW Access and Registered Common Land.
39
Opportunities
Opportunities Identified During Walkover Surveys
During the walkover surveys, experienced surveyors at WRT identified opportunities for NFM measures and improvements to other key considerations mentioned.
Both sides of the catchment seem to have a small plateau that then drops into the valley through woodland. The plateau is mostly pasture and arable, but either the land use, or the margins, could be considered for holistic habitat restoration or corridors of restoration around the woodland margins to buffer the steeper drop off slopes. The steeper or moderately sloping fields below the woodland line may also lend themselves to features of water interruption or attenuation that can benefit both the farming aims and the environmental gains. There are some interventions that can help attenuate runoff from these fields whilst perhaps providing some stock shelter and drought resilience in the drier months.
A couple of locations lend themselves to attenuation ponds, however these normally require some active management to see them function correctly in an ongoing capacity.
Some cross slope interventions further down the valley may be considered such as an attenuation feature: beetle bank or banked hedge. A slightly wider strip could facilitate trees which would promote infiltration further or provide wind/sun shelter if the field is used for animals.
Crop diversification and undersowing could all help to protect soil health in sloped fields if needed.
The catchment as a whole has minimal agri environment schemes and therefore the above notes could potentially benefit from implementation of NFM features as part of a wider scheme that fits with the business model.
40
Opportunities 41 Soil Opportunities Identified During Walkover Surveys NaturalFlood Management (NFM) or Working withNaturalProcesses (WWNP) Potential benefit in catchment Potential provider identified Locationof opportunity matches GISmaps Improve soil healthand rainfall acceptance potential ✓ ✓ N/A Sub-soil,aeration,ordecompaction ✓ ✓ N/A Contour ploughing or cross slope working ✓ N/A Change land use ✓ N/A Interspersed woodland or agroforestryforinfiltration ✓ N/A Peatland/wetland/culmrestoration ✓ N/A There are some opportunities to improve flood resilience in the Awliscombe River Wolf through changes to soil management. The clay nature of some of the soils, alongside the cultivation method currently used, means that soil loss and compaction can be a high risk or possibility and the catchment would benefit environmentally and productively from intelligent soil management and health.
help slow the
in
where rapid routes exist, and then it is particularly desirable to either arrestthe flow off impermeable surface
as the road and divert it back into a green space with
capacity.
two gates exist at the lowest (most downstream point) of a field and these could be considered for
if the gateway is a rapid surface water pathway.
Opportunities 42 Pathway Interruption Opportunities Identified During Walkover Surveys NaturalFlood Management (NFM) or Working withNaturalProcesses (WWNP) Potential benefit in catchment Potential provider identified Locationof opportunity matches GISmaps Cross-slope planting of treesor hedges ✓ N/A Gatewayrelocation ✓ N/A Cross slope buffer(beetle bankor cross drain) ✓ N/A Timber/stone instream deflectors ✓ N/A There are some opportunities to improve flood resilience in the Awliscombe River Wolf through water pathway interruption. Interruption and divergence will
flow
general
such
attenuating
One or
relocation
During Walkover
in the Awliscombe River Wolf
some opportunities to improve flood
water
floodplain wetland.
majority of space is non floodplain and plenty of opportunities exist to provide features which benefit the agriculture (e.g. shelter for stock) as well as providing an ecosystem function.
is a willingness from the rural community in the catchment to engage with downstream benefits and more potential providers can be identified.
investigation could be made into natural depressions in the landscape for enhancement (e.g. pictured below, West of Wolverstone). Attenuation/wildlife ponds
be considered alongside drought resilience for the farm, or temporary ponds in wetter months when the land isn’t used by stock.
Opportunities 43 Attenuation Opportunities Identified
Surveys NaturalFlood Management (NFM) or Working withNaturalProcesses (WWNP) Potential benefit in catchment Potential provider identified Locationof opportunity matches GISmaps Attenuationpond / farm pond / wildlife pond ✓ ✓ N/A Run off scrape or swale / temporarypond ✓ N/A Run-off bunded storage oroff-line storage ✓ N/A Blind ditching indrainage ditches ✓ ✓ N/A Headwaterdrainage management ✓ N/A There are
resilience
through
attenuation on non
The
There
Further
could
Slow the Flow
Identified During Walkover Surveys
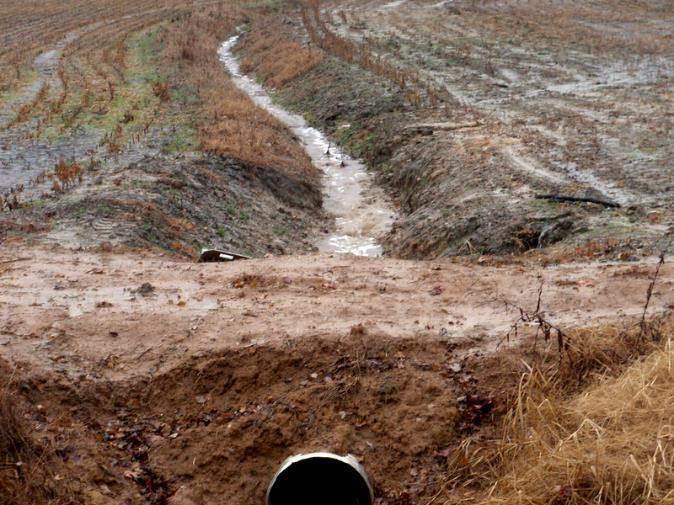
There are some opportunities to improve flood resilience in the Awliscombe River Wolf through increasing channel and floodplain roughness to slow the flow, although given the steep gradient of the river, these opportunities may be limited.
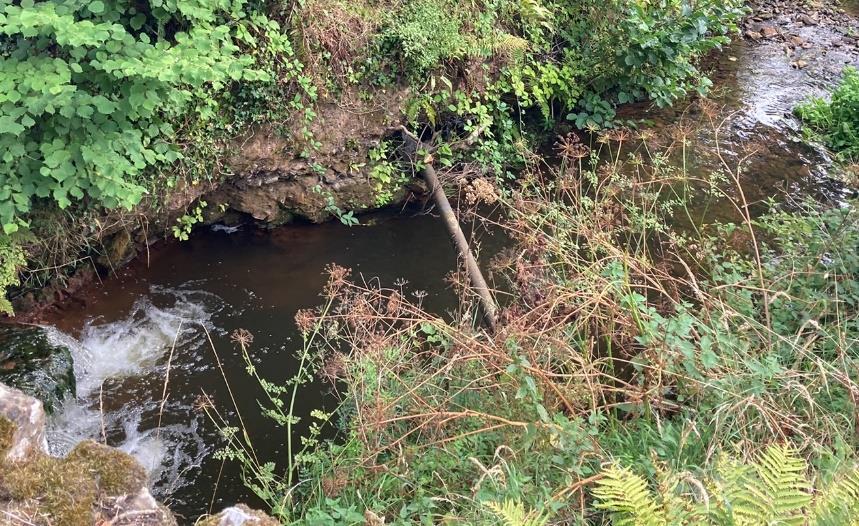
channel can experience downward erosion (pictured below with uncovered pipe) with excessive high flows. Where the river is heavily incised in the rural landscape, there is opportunity to restore the bed level and reconnect the river to the floodplain using natural materials, therefore helping slow the flow and store more water upstream for longer.
Flood Management
withNatural
restoration,sinuosity
woodeddebris
Floodplainreconnection (palaeochannelreconnection)
bufferstrips
woodland (sloped)
woodland orwet woodland
flow
renaturalisation armour/
Opportunities 44
Opportunities
Natural
(NFM) or Working
Processes (WWNP) Potential benefit in catchment Potential provider identified Locationof opportunity matches GISmaps Channel
N/A Large/coarse
introduction ✓ N/A
N/A Riparian
or
✓ ✓ Floodplain
✓ ✓ Peak
leakybarriers ✓ ✓ Bed
gravel augmentation ✓ N/A
The
Engagement
45
Engagement
Current Engagement
There are 33 landowners in the catchment. The 3 largest landowners own 22.6% of the catchment. WRT has engaged with farmers managing 37.95% of the total farm area under every year of UST. WRT has also engaged the catchment community in other projects.
The parish council website states ‘Became partof the flood management group involved with in discussions with the Environment Agency and higher principal authorities’. No further information on this can be easily found online. There does not appear to be any further community engagement surrounding flooding.
WRT’s farm advisors provide advice throughout the Otter catchment under Upstream Thinking 3
46
Engagement
Getting Involved
As well as the opportunities identified in the previous section, there may be opportunities for you to get involved as an individual.
WRT runs a Citizen Science Investigation (CSI) team of volunteers across the south west, whereby volunteers receive a testing kit and training to procure water samples from a watercourse. Westcountry CSI aims to engage people with their local environment, and produce water monitoring data that can identify pollution events quickly and target improvement work.
There is a free CSI sampling site available for anyone to take up in the south of the catchment where the A373 crosses the River Wolf. There may be the potential for more sampling sites along the main River Wolf and its smaller tributary’s if there is suitable access to the water.

For more information about Westcountry CSI, including instructions on what’s involved and how to sign up, visit our website at wrt.org.uk/westcountry csi
Another opportunity for you to get involved in is the Riverfly Partnership’s Anglers’ Riverfly Monitoring Initiative (ARMI). This recognises that anglers are very well placed to monitor river water quality and facilitates communication between them and their local Environment Agency contact.
There are no riverfly survey sites within the micro catchment, but, as with CSI sites, it may be possible to start a new site if there is suitable access to the water and with communication with the Environment Agency.
For more information on ARMI, visit their website at riverflies.org/anglers riverfly monitoring initiative armi
47
Summary and Next Steps
Multiple reasonsforthe possible causesand remediesforflooding inthe micro catchmentforthe Awliscombe RiverWolf have beenmappedin this study, as have otherfactorsthat are key to considerwhen making NFM decisions.
It islikelythat a combinationof causesare at playhere contributing to there being propertiesatflood risk,including the topography,land use and absence of habitatsincertainareasof the catchment.
There is a willingnessfrom those asked in the rural community to engage withdownstream benefitsand therefore the key to successful NFM is finding anavenue that fitswith the business model to achieve mutuallybeneficial aims. Althoughnotmany providershave yet beenidentified, more providersare highly likelywitha successful strategyof implementation.
The nextsteps are to engage and empowerthe communityin the catchmentto discuss and work towardsbuilding flood resilience throughsome of the opportunitiesmapped inthe previouspages.It is imperative thatpropertyownersand landownersshare perspectivesand worktogetherto find solutionsagreeable to all sides.Some opportunitieswillcertainlyprovidesecondarybenefitstowardsimproving the catchment’sWFD ecologicalstatus.
48
Appendix 49
Methodology Details
Step 1: Micro-catchment Mapping Method
The processforidentifying the highest impacting locationsof NFMmeasures acrossDevonand Cornwall involved several stepsin a Geographic InformationSystem (GIS).The first step was to identifywatercourseswithan upstream watershed less than 10km2 and less than 5km2 in size,then to identifypropertiesadjacentto these watercoursesthat overlapped withthe EnvironmentAgency’s (EA) fluvial “Flood Zone 2”dataset.Next,pour pointswere placed onthe watercoursesin front of the furthest downstream flood riskproperties.These pourpoints were thenused to delineate the upstream micro catchmentboundaries.A total of 1270micro catchmentswithpropertiespotentiallyatriskwere identified across the 2counties.
For every micro catchmentidentified,itsarea wasdividedbythe number of flood risk propertieswithinitto calculate the area perproperty atrisk foreach micro catchment.Those withthe lowestarea perpropertyindicated higherpotential forsmall scaleNFMmeasuresto benefitthe greatest number of flood riskproperties.
Lastly,additional factors,suchas WFD classificationsand previousWRT engagementwithfarmers,were considered alongsidethe area perproperty atflood risk toprioritise a small numberof micro-catchmentsto targetcommunityengagementand NFM delivery.
Modelling assumptionsand constraints:
➢
Due to the large geographic extent(Devonand Cornwall)and the manual elementof the mapping (bothcausing the mapping processto be time consuming),the resolution/accuracyof some datasetsmaybe compromised.
➢ The buildingsdataset(OS VectorMap Buildings) isnotasaccurate as OS MasterMap some propertiesare amalgamatedinto a single polygon and very small buildingsare notshown. Therefore propertiesatriskof flooding maybe underestimated.
➢ Potential flood riskisidentifiedbyselecting building polygonsthatintersectthe flood zones;no detailed local information (e.g.drainage or defences) ormodelling hasbeenused.
➢
The spatial resolutionof the topographydata iscoarse (50m).Thisisused to calculate the upstream catchmentarea foreach communityat-risk. Therefore,some errors mayoccur (additionsoromissions) whenidentifying micro-catchments.
➢ The mapping method involvesanelementof manual validation,whichhasthe potential to be subjective and/orpossible errors.
50
Methodology Details
Step 2: Theoretical Ground Truthing
Once catchmentswere modelled and the informationtabulated to show theoretical flood risk in conjunctionwithWFD failures, a systematic approach to ground truthing was adopted.
Catchmentsthat were perceived to have elevated water quality and water quantity risks were discussed with local land management advisors and regulators to determine if the modelled risk was likely to be correct.
Upon a theoretical, or desk based ground truthing,the catchmentswere then surveyed using a rapid walkover survey to observe run off pathways and confirm if useful managed interventions could be implemented to reduce flood risk locallyand improvewater quality in the process.
Step 3: Rapid Walkover Survey
A further modelling process using SCIMAP was undertaken to identify high risk run off pathways of the specific micro catchmentbeingsurveyed to assist the surveyor in locating issues within a <10km2 area.
Where possible, surveyors reacted to high rainfall predictions and went out to observe the catchmentwhen the conditions were right.
Walkover surveys were undertaken noting observations about surface water run offand taking photographs of key areas and issues. All walkovers aimed to provide:
Dry or Wet weather photos,
Identify stakeholder PROVIDERS where NFM can be instigated,
Identify stakeholder BENEFICIARIES by property and number people,
Establish opportunities in each catchmentand feasibility of action.
Georeferenced photos were taken to provide a visualoverview of issues, opportunities, and as general reference notes.
Where issues and opportunities existed, further investigation was made or attempted to establish the realistic chances of further action. This was achieved by either speaking withthe localcommunityor contacting communitygroupsor key landowners.
All 1270 micro catchments with properties potentially at risk were identified across the 2 counties.
51
➢
➢
➢
➢
References and further information
Reference Resourcedescription Link
CIRIA (Slide 43)
The Construction Industry Research and Information Association’s (CIRIA) Natural Flood Management Manual (C802) (PDF)
FRFW (Slide 32)
Statutory guidance for Farming Rules for Water (FRFW) (Webpages)
https://www.ciria.org/Books/Free_publications/C802F.aspx
https://www.gov.uk/government/publications/applying the farming-rules-for-water/applying-the-farming-rules-for-water
SEPA NFM Handbook (Slide 32)
Handbook describing various natural flood management interventions and case studies (PDF)
https://www.sepa.org.uk/media/163560/sepa-natural-floodmanagement-handbook1.pdf
52
Mapping Data Sources
Dataset Source AttributionStatement
Agricultural Land Classification Natural England © Natural England copyright. Contains Ordnance Survey data © Crowncopyright anddatabase right2022.
Air Quality Management Areas UKAIR
© Crown copyright and database rights licensed under Defra's PublicSectorMapping Agreementwith Ordnance Survey(licence No. 100022861) and the Land andProperty Services Department(Northern Ireland) MOU206.
Ancient Woodland Natural England © Natural England copyright. Contains Ordnance Survey data © Crowncopyright anddatabase right2022.
AONB Natural England © Natural England copyright. Contains Ordnance Survey data © Crowncopyright anddatabase right2022.
Areas Benefitting fromFlood Defences EnvironmentAgency
© EnvironmentAgency copyrightand/or database right 2018. Allrights reserved.Some features of this mapare based on digital spatial data from the Centre for Ecology & Hydrology,© NERC (CEH) © Crowncopyright anddatabase rights 2018Ordnance Survey 100024198
Bathing Water Monitoring Locations EnvironmentAgency © EnvironmentAgency copyrightand/or database right 2015. All rights reserved.
Consented Discharges
Country Parks NaturalEngland © Natural England copyright. Contains Ordnance Survey data © Crowncopyright anddatabase right2022.
Countryside StewardshipScheme Agreements
Natural England © Natural England copyright. Contains Ordnance Survey data © Crowncopyright anddatabase right2022.
Crop Map of England Rural Payments Agency © Rural Payments Agency
CRoW Access Land NaturalEngland © Natural England copyright. Contains Ordnance Survey data © Crowncopyright anddatabase right2022.
CRoW RegisteredCommonLand NaturalEngland © Natural England copyright. Contains Ordnance Survey data © Crowncopyright anddatabase right2022.
DetailedRiver Network EnvironmentAgency © EnvironmentAgency Crown copyrightand databse right 2022.
Drinking Water Safeguard Zones (Ground Water)
EnvironmentAgency © EnvironmentAgency and/ordatabase rights. Derivedfrom BGSdigital data under licence from British Geological Surveycopyright NERC.
Drinking Water Safeguard Zones (Surface Water) EnvironmentAgency
© EnvironmentAgency copyrightand/or database right.All rights reserved. Derived fromBGS digitaldata underlicence fromBritish Geological Survey ©NERC. Derived fromCentre
Flood
Flood
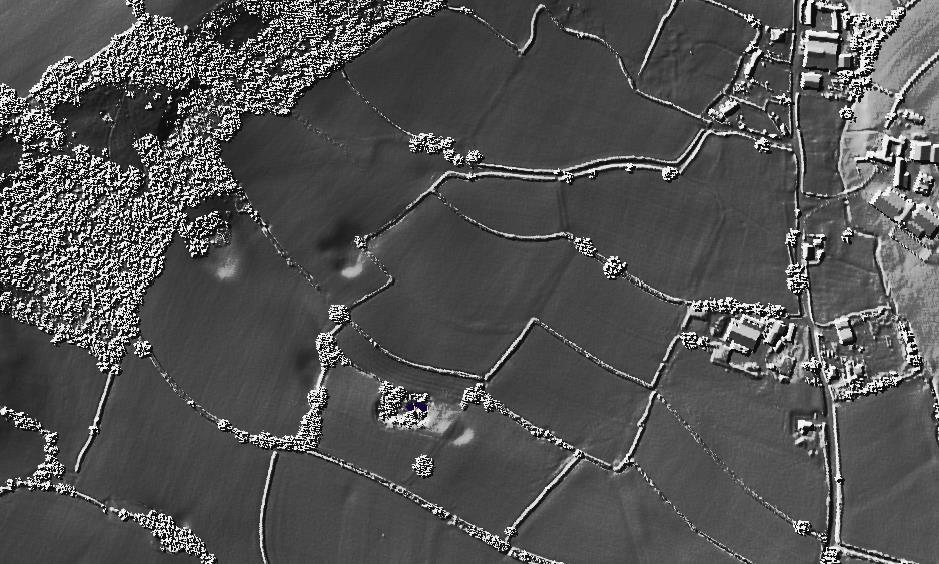
Hillshade
Historic
of Ecology andHydrology data ©CEH Energy Crop Scheme Agreements NaturalEngland © Natural England copyright. Contains Ordnance Survey data © Crowncopyright anddatabase right2022. Environmental Stewardship Scheme Agreements Natural England © Natural England copyright. Contains Ordnance Survey data © Crowncopyright anddatabase right2022.
Defences EnvironmentAgency © EnvironmentAgency copyrightand/or database right 2020. Allrights reserved.
Zone 2 EnvironmentAgency © EnvironmentAgency copyrightand/or database right 2018. All rights reserved.Some features of this map are basedon digital spatial data from the Centre for Ecology & Hydrology,© NERC (CEH). © Crown copyrightand database rights 2018 Ordnance Survey 100024198 Greenspaces Ordnance Survey Contains OS data © Crown copyrightand database right 2022 HabitatNetworks Natural England © Natural England copyright. Contains Ordnance Survey data © Crowncopyright anddatabase right2022.
Landfill Sites EnvironmentAgency © EnvironmentAgency copyrightand/or database right 2018. All rights reserved.Contains information © Local Authorities 53
Mapping Data Sources
by
in part from data
Dataset Source AttributionStatement Land Parcels Rural Payments Agency © Crown copyright and database rights 2020 OS LCM2019 25m Parcels Centre for Ecology and Hydrology Morton, D., Marston, C. G, O’Neil, A. W., & Rowland, C. S. (2020). Land Cover Map 2019 (25m rasterised land parcels, GB) [Data set]. NERC Environmental Information Data Centre. https://doi.org/10.5285/F15289DA 6424 4A5E BD92 48C4D9C830CC LNR Natural England © Natural England copyright. Contains Ordnance Survey data © Crown copyright and database right 2022. MCZ Natural England © Natural England copyright. Contains Ordnance Survey data © Crown copyright and database right 2022. National Forest Inventory Forestry Commission Contains Forestry Commission information licensed under the Open Government Licence v3.0 National Trails Natural England © Natural England copyright. Contains Ordnance Survey data © Crown copyright and database right 2022. NATMAPvector Cranfield University Soil data © Cranfield University (NSRI) and for the Controller of HMSO 2019 Nitrate Vulnerable Zones 2021 Combined Environment Agency © Environment Agency copyright and/or database right. Derived in part from geological mapping data provided by the British Geological Survey © NERC. Derived in part from data provided by the National Soils Research Institute © Cranfield University. Contains Ordnance Survey data © Crown copyright and database rights 2016. Derived in part from data provided by the Department for theEnvironment, Farming and Rural Affairs © Crown 2016 copyright Defra. Derived
provided by the Centre for Ecology and Hydrology © NERC. Derived in part from data provided
UK Water Companies. National Parks Natural England © Natural England copyright. Contains Ordnance Survey data © Crown copyright and database right 2022. Organic Farming Scheme Agreements Natural England © Natural England copyright. Contains Ordnance Survey data © Crown copyright and database right 2022. OS Open Datasets Ordnance Survey Contains OS data © Crown copyright and database right 2022 Permitted Waste Sites Environment Agency © Environment Agency copyright and/or database right 2015. All rights reserved. PM2.5 2020 UKAIR © UKAIR crown copyright Pollution Incidents Environment Agency Priority Habitat Creation and Restoration Projects Environment Agency © Environment Agency copyright and/or database right 2015. All rights reserved. Priority Habitat Inventory Natural England © Natural England copyright. Contains Ordnance Survey data © Crown copyright and database right 2022. Priority Habitats (Aquatic and Wetlands) Natural England © Natural England copyright. Contains Ordnance Survey data © Crown copyright and database right 2022. Priority Roads for Catchment Management of Runoff Highways England Priority Roads for Catchment Management of Surface Water Highways England Public Rights of Way Ordnance Survey Contains OS data © Crown copyright and database right 2022 Ramsar Natural England © Natural England copyright. Contains Ordnance Survey data © Crown copyright and database right 2022. Recorded Flood Outlines Environment Agency © Environment Agency copyright and/or database right 2018. All rights reserved. River Restoration Projects The River Restoration Center 54
Mapping Data Sources
SPAs
Dataset Source AttributionStatement RoFSW Extent 1in 1000 EnvironmentAgency © EnvironmentAgency copyrightand/or database right 2015. All rights reserved. RPA Land Parcels Rural Payments Agency © Crown copyright and database rights 2020OS SACs Natural England © Natural England copyright. Contains Ordnance Survey data © Crowncopyright anddatabase right2022. SCALGO Live Scheduled Monuments HistoricEngland © HistoricEngland2022. Contains Ordnance Survey data © Crowncopyright anddatabase right2022 SCIMAP Flow Pathways SCIMAP SCIMAP modelling system SCIMAP was developed atDurham andLancasterUniversities as part of a NERCgrant Slope TellusSW Ferraccioli,F.; Gerard,F.; Robinson, C.; Jordan,T.;Biszczuk,M.; Ireland, L.; Beasley,M.; Vidamour,A.; Barker, A.; Arnold, R.; Dinn, M.; Fox,A.; Howard, A. (2014). LiDAR based Digital Terrain Model (DTM) data for SouthWestEngland. NERC Environmental InformationData Centre. https://doi.org/10.5285/e2a742df 3772 481a 97d6 0de5133f4812 Source ProtectionZones EnvironmentAgency © EnvironmentAgency copyrightand/or database right 2016. All rights reserved.
Natural England © Natural England copyright. Contains Ordnance Survey data © Crowncopyright anddatabase right2022. SSSI Units Natural England © Natural England copyright. Contains Ordnance Survey data © Crowncopyright anddatabase right2022. SSSIs Natural England © Natural England copyright. Contains Ordnance Survey data © Crowncopyright anddatabase right2022. Vegetation Health Index Centre for Ecology and Hydrology © UK Centre for Ecology & Hydrology Water Abstraction Licenses Water Resource Availability and Abstraction Reliability Cycle 2 EnvironmentAgency © EnvironmentAgency copyrightand/or database right 2015. All rights reserved. WFD Monitoring Sites EnvironmentAgency WFD River Waterbody Catchments EnvironmentAgency © EnvironmentAgency copyrightand/or database right 2015. All rights reserved. WFD River Waterbody Status EnvironmentAgency WIMS Locations EnvironmentAgency Uses Environment Agency waterquality data from the WaterQuality Archive (Beta) WWNP Datasets EnvironmentAgency © EnvironmentAgency copyrightand/or database right 2015. All rights reserved. 55
