Woodward1, Bethany Wilkinson1, Tom Jordan1, Mathew Taylor1, Sarah
Breimann1 , Tim Malthus2 , Tishan Dhar2, Robert Woodcock2, Sam Lavender3 ,
Geoff Smith4 .
Objectives.
The project is assessing the effects of localised flooding on pollutants from sewage and agricultural run-off (and heavy metals through a PhD), tracking their fate and how they potentially affect sea grass beds and mud flats in Plymouth Sound.
Key aims.
1. It uses the AquaWatch Data Integration and Analysis System (ADIAS) to bring together a variety of data.
2. It applies Optical machine learning algorithms to satellite data to develop water quality parameters, at higher spatial and temporal scales than is currently possible, to assess the impacts of heavy rainfall in the region.
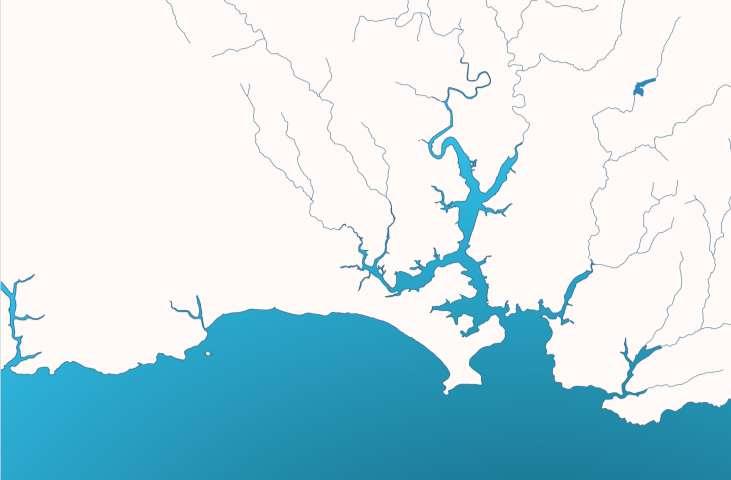
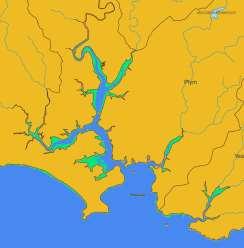
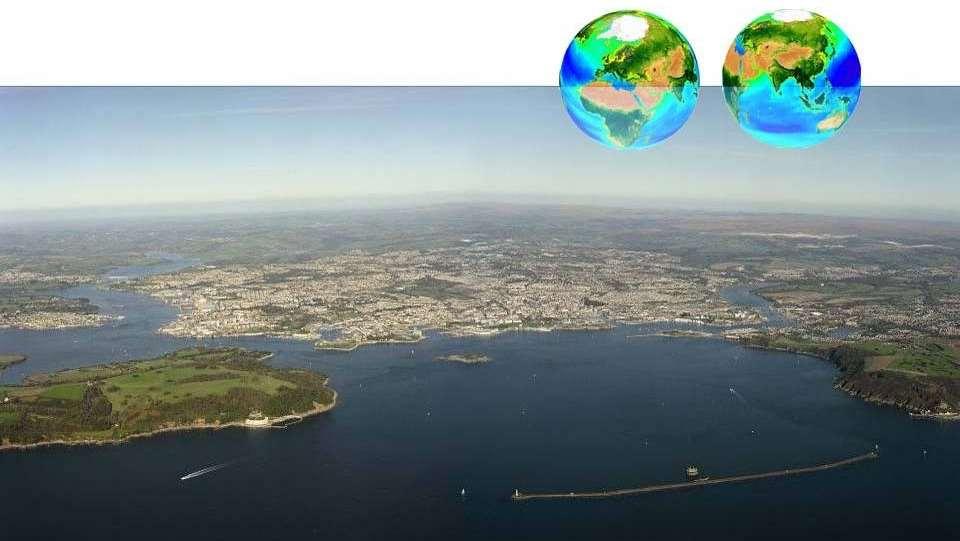
Location: Tamar and Plym Rivers, Plymouth Sound and the western Channel Observatory.
Funding: UKRI STFC, EO4AgroClimate program.
Timeline: Aug 2023–March 2025.
Vis4Sea: Integrating multi-source data
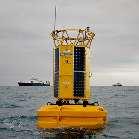
WCO In situ and buoy data
Multi-sensor, high resolution satellite data
River to coast transect data
Drone measurements
Modelled physical fields from FVCOMS
Tamar & Laira bridge optics sensors
Iterative approach
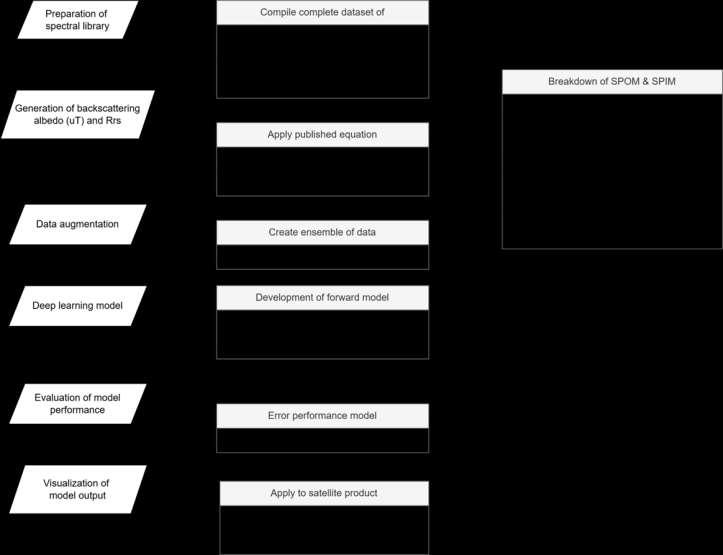
• ML model is based on a non-linear forward optical model
• It generates a spectral library using the forward biooptical model (turning N=66 in situ data to 17,301,504 synthetic spectral data).
• The spectral library is then used for training the DL inversion model.
• The DL model segregates total suspended material (TSM) into its respective inorganic (ISM) and organic (OSM) components.
• ML model performance.
• ML model visualisation.
Unnithan et al., 2025. http://dx.doi.org/10.2139/ssrn.5123379
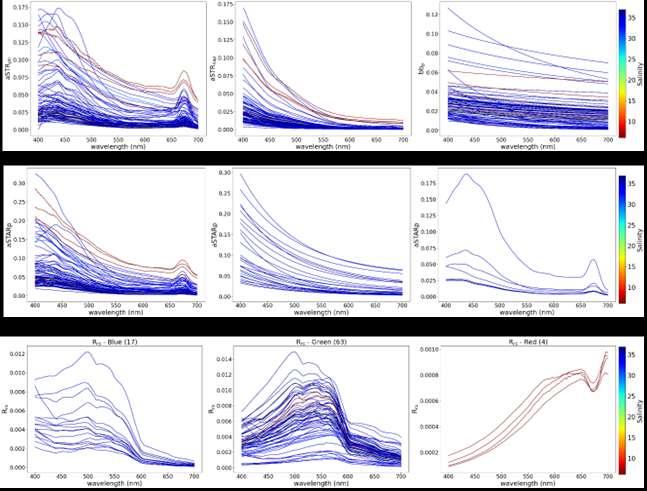
Optics data for calibration of Machine Learning models.
Historic and new in situ optical data used to recalibrate CSIRO ML optical model.
Plymouth catchment to coast data.
TOP PLOTS: Inherent optical property data (n = 84) used to calibrate the ML model. MIDDLE PLOTS: TSM, ISM, OSM generated data using the ML model. BOTTOM PLOT: generated remote sensing reflectance (Rrs) from the ML model.
Water Quality ML Model from
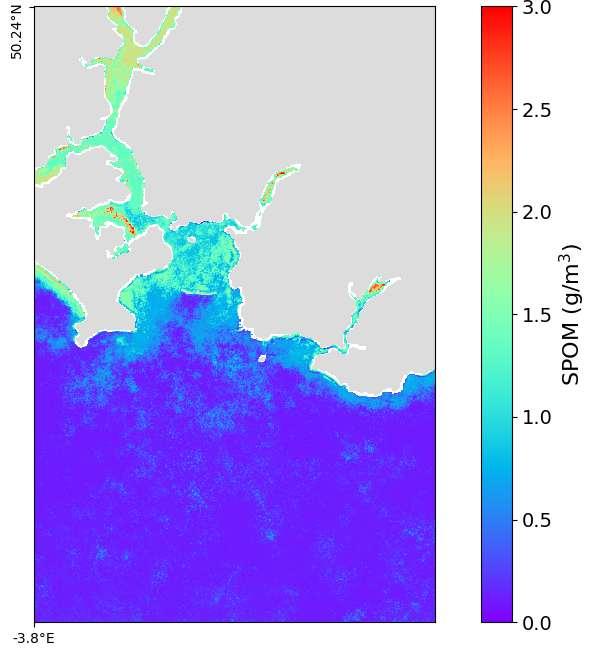
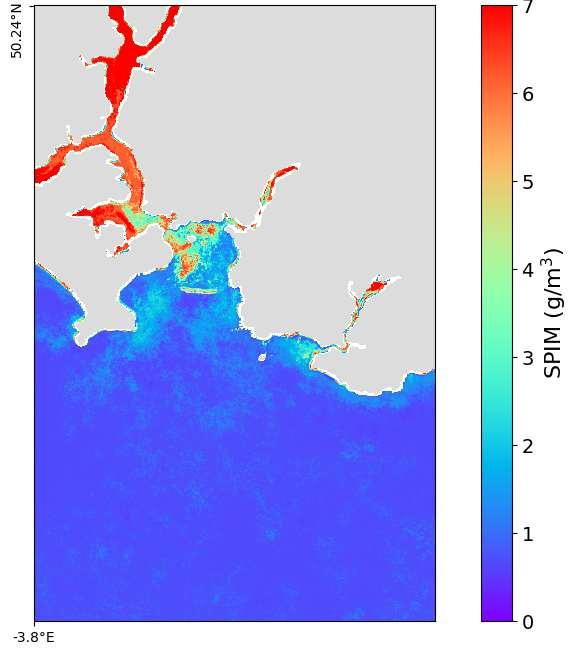
Landsat-8 time-series: Median suspended material (gm-3) 2013 to 2024.
Total Suspended Material Organic Suspended Material Inorganic Suspended Material
Order of magnitude difference in TSM from river to coast. Median ISM > OSM.
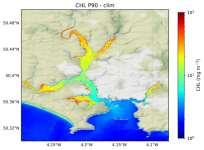
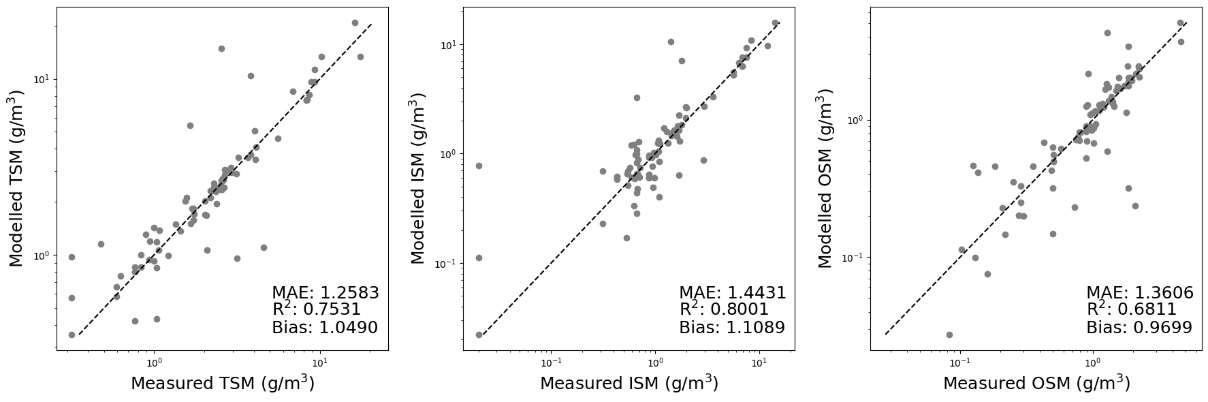
Water Quality ML Model performance.
Optical closure MAE metrics averaged between four bands indicate <20% error across the region, except some river intertidal areas.
Robust model performance for TSM, ISM and OSM, with a low bias and accuracy of between 20 and ~40% between measured and modelled concentrations.
Choo, Cherukuru, Guo, Unnithan, Tilstone et al. (
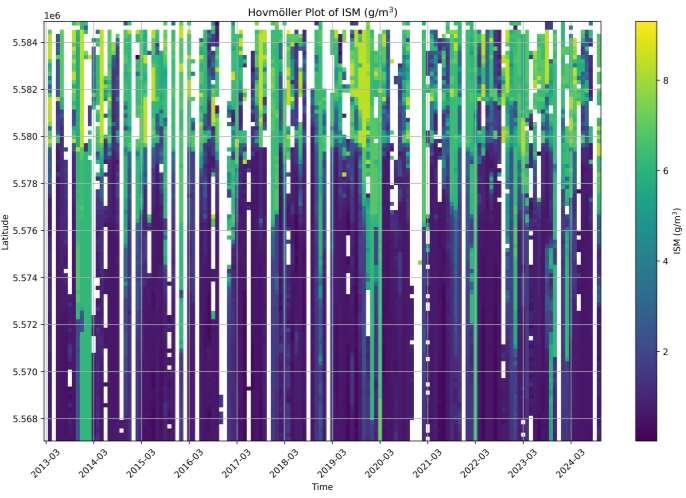
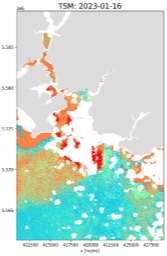
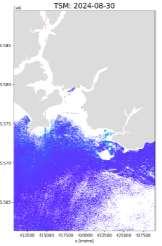
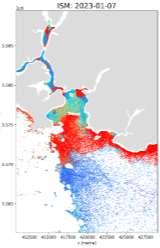
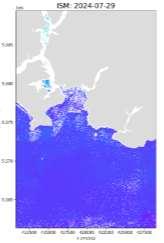
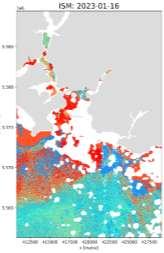
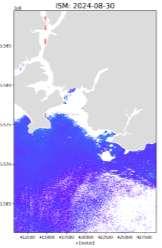
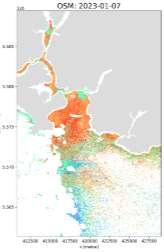
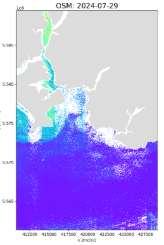
Water Quality ML Model Trends.
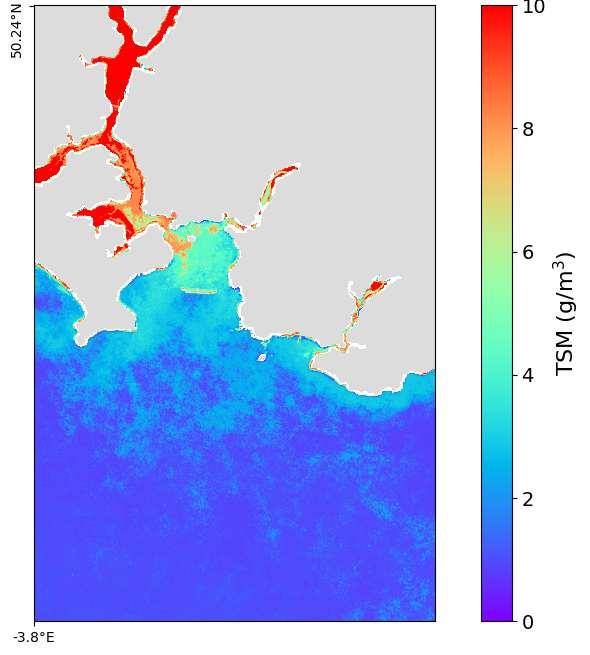
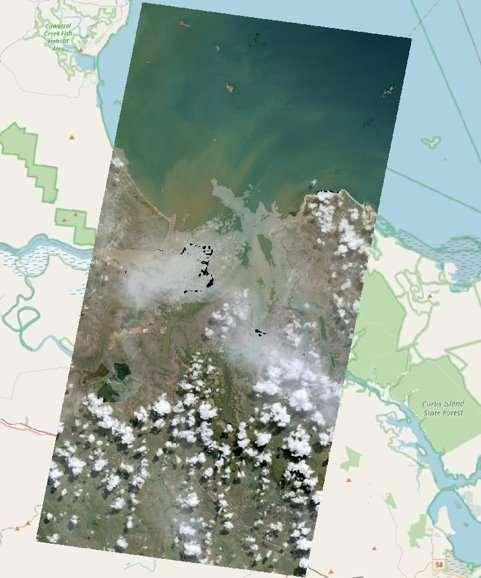
EnMap satellite image showing land around Wilcove and TSM in the adjacent River Tamar.
The impact of ploughing on TSM (nitrate and TN) into the catchment is being assessed.
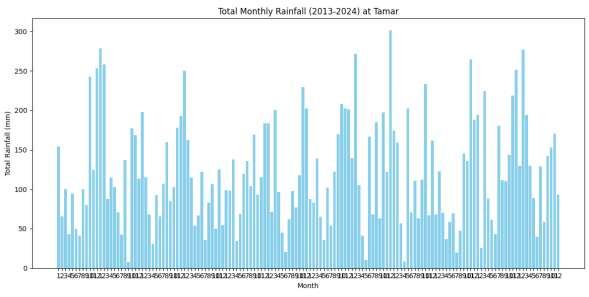
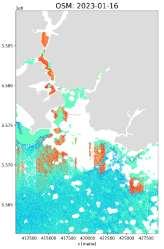
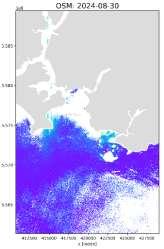
High rainfall always linked to high ISM deposition in Plymouth Sound in 2014, 2016, 2020, 2022, 2023.
Distribution of TSM with variable rainfall.
Deposition of TSM, OSM, ISM was greater during heavy rainfall events in January compared to low rainfall in July and August 2024.
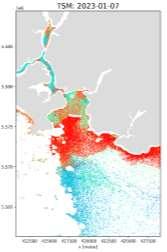
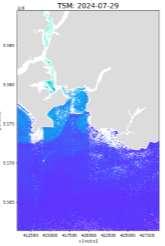
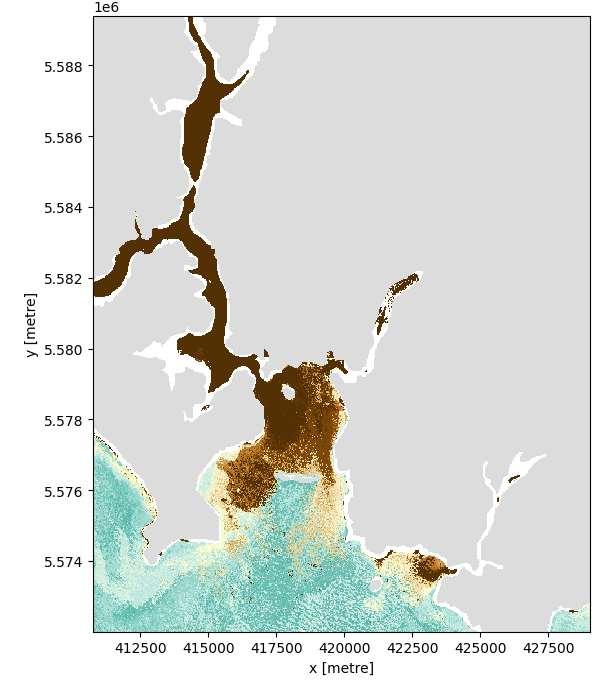
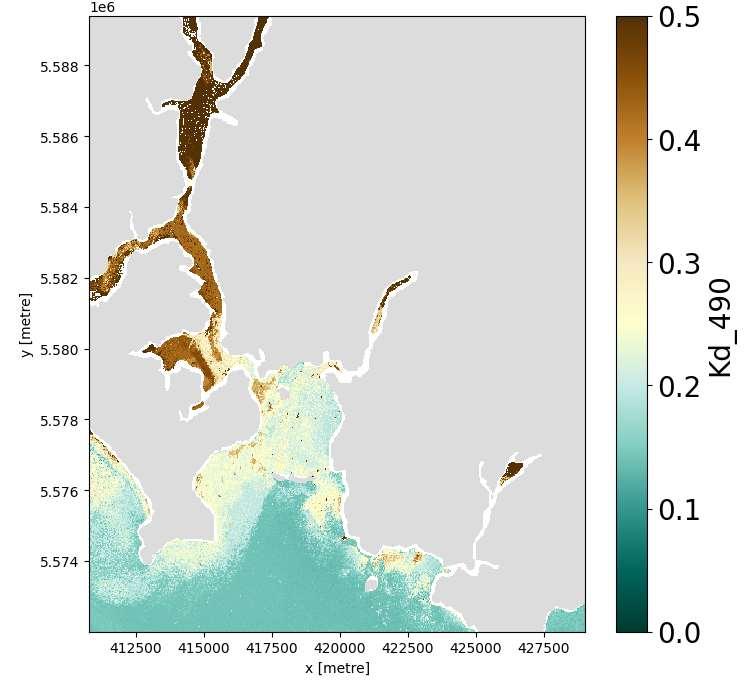
Impact of high and low rainfall on light availability.
Kd(490). Winter 2023, high rainfall. Summer 2024, low rainfall. Significantly reduced light visibility in the lower Tamar River and Plymouth Sound during prolonged periods of heavy rainfall.
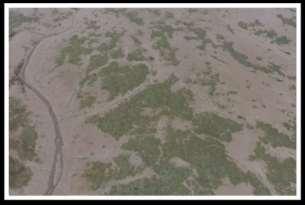
Potential impact on submerged and intertidal vegetation
Drone ortho mosaics (0.5 m res.).
Tamar River
Plym River
English Channel
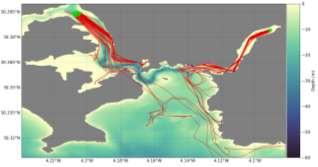
• Particle tracking model based on in situ ADCP and modelled FVCOMS data fields.
Particle tracking of E. coli from sewage.
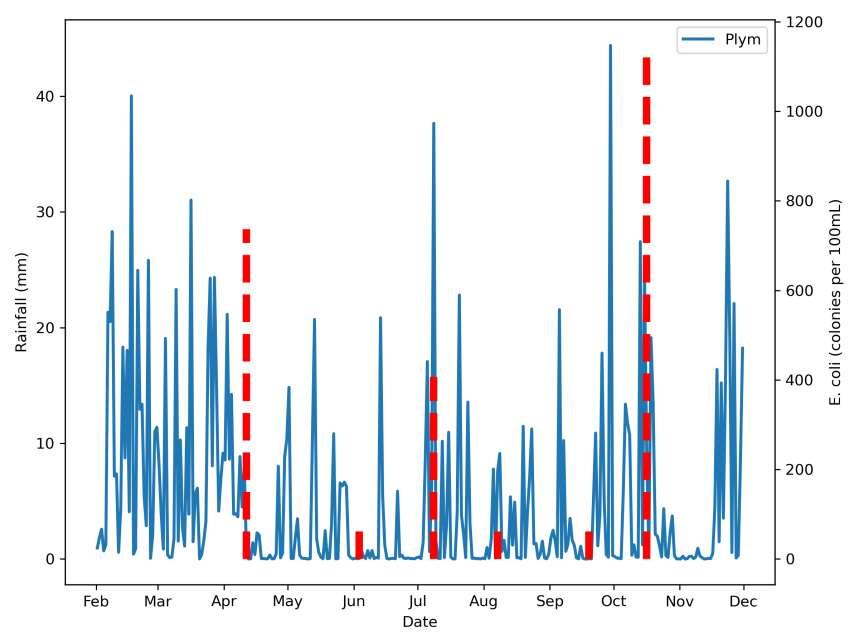
Plym River catchment rainfall and E.coli counts.
• Method uses forward trajectories computed based on wind speed, current and tides.
• Output is shown as a heat map of the number of particles from the source to their dispersal.
Conclusions.
• CSIRO AquaWatch Data Integration System with a deep learning optical model was applied to Plymouth Sound to analyse the impacts of flooding.
• Generation of Water Quality products. In situ optical data used to calibrate CSIRO ML model provided accurate water quality products for Plymouth Sound, which were used to assess principle sources of TSM from rivers to coast.
• Trends in TSM. High rainfall always linked to high TSM, deposition (and particularly ISM) which has a significant effect on light availability from the catchment to Plymouth Sound.
• Trends in E coli. High counts associated with periods of high (and low) rainfall, which potentially affect local tourist beaches.
Questions?
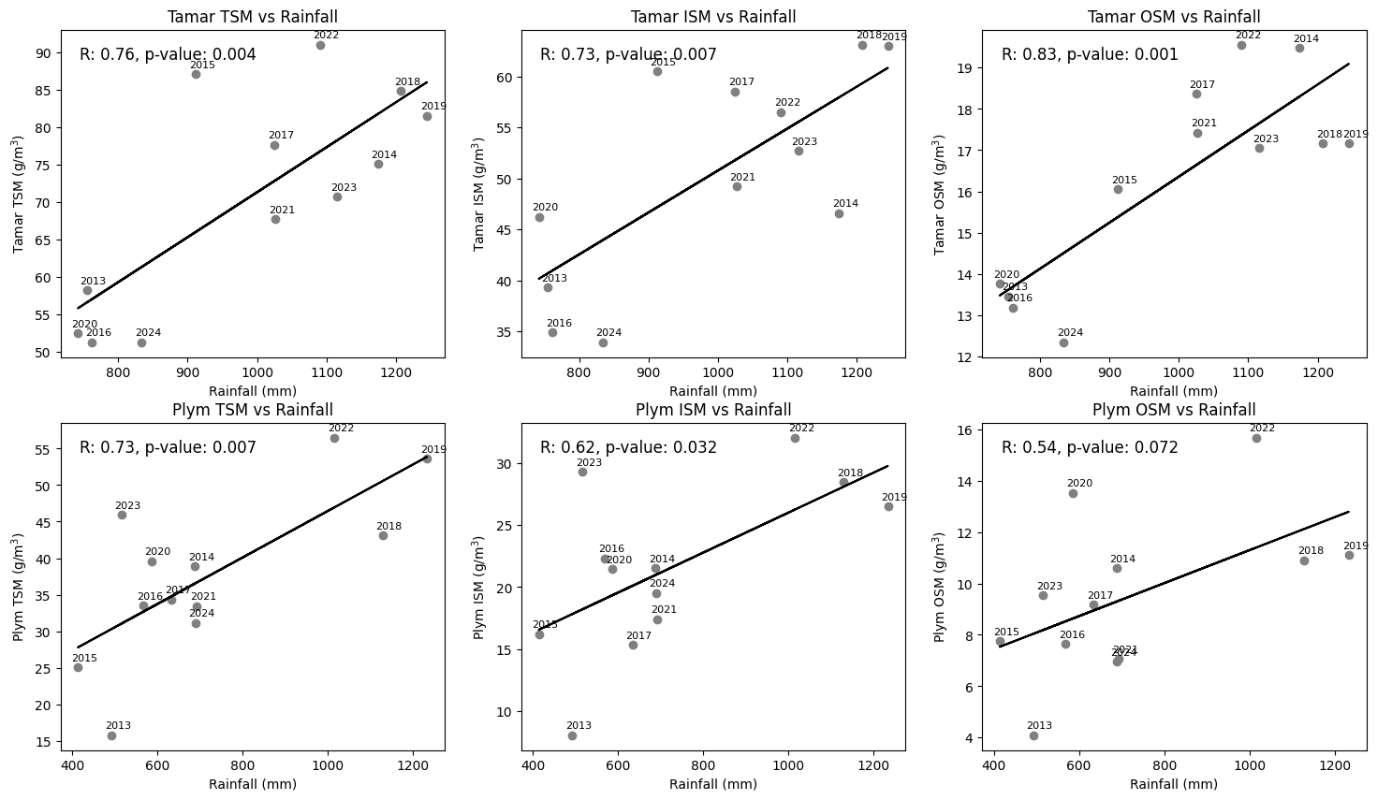
Relationship between TSM , ISM, OSM and annual rainfall.
High correlation between rainfall and TSM, ISM, and OSM (g/m3) from both the Plym and Tamar on an annual basis.