Agile and robust


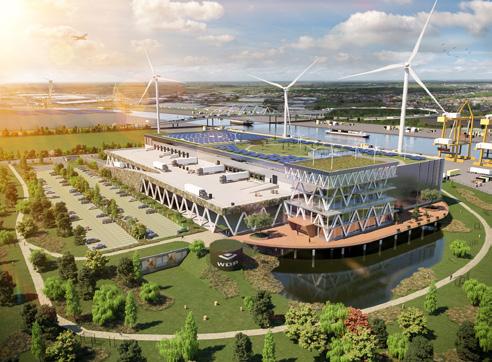
WDP is a leading logistics real estate specialist operating in core locations along key logistics axes in six European regions. WDP follows a pure player strategy and relies on in-house expertise and local presence to acquire, develop and lease a wide range of sustainable logistics real estate with the aim of contributing to the decarbonisation of the customer’s transport and operations.
WDP is listed on Euronext Brussels (BEL 20) and Amsterdam (AMX) and is part of the Dow Jones Sustainability Index (DJSI). WDP has REIT status in Belgium (as a GVV/SIR), in the Netherlands (as an FBI) and in France (as a SIIC). It is subject to the prudential supervision of the FSMA.
On behalf of the entire Board of Directors, I am pleased to look back on another successful year that saw significant growth. The hard work and dedication of our teams once again generated increased profitability and shareholder value. We are grateful for the day-to-day trust our customers place in us as well as for the support given to us by our shareholders.
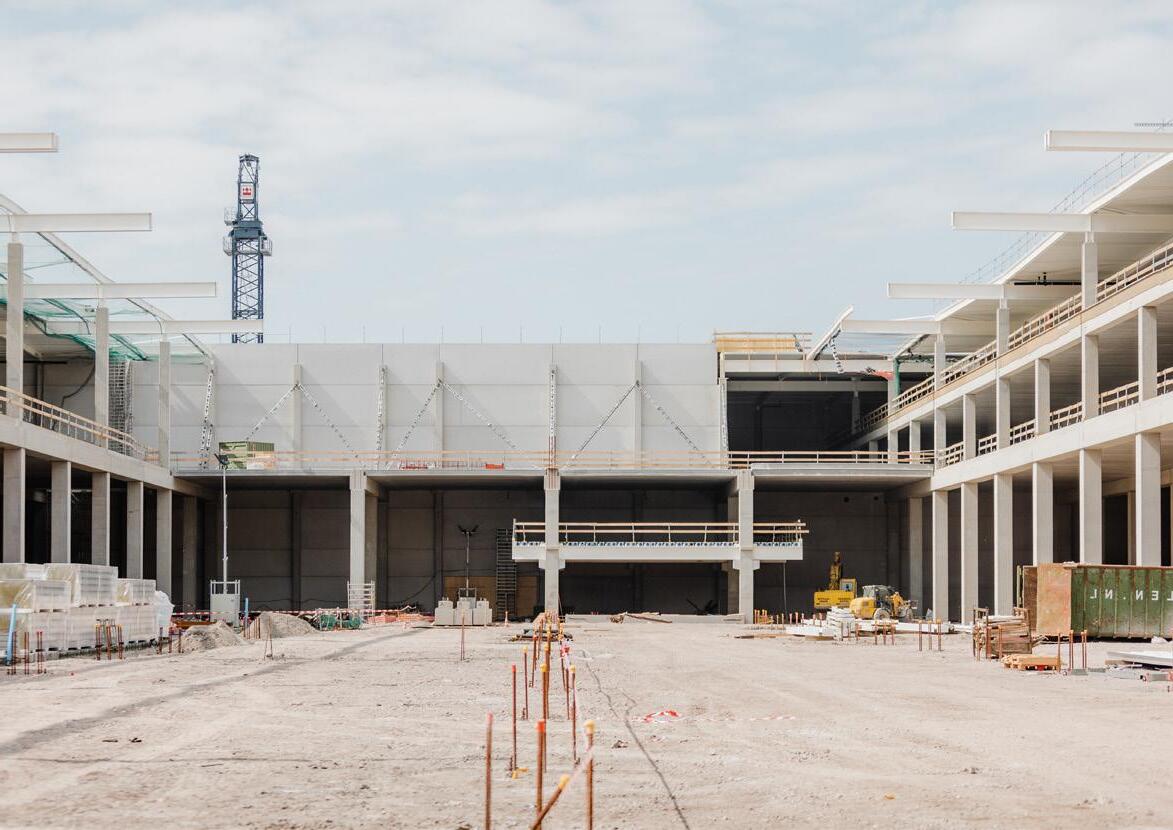
In 2022, we once again met the strong demand for our product, that is high-quality logistics real estate, with a noteworthy expansion of our property portfolio for renowned clients. For instance, 500,000 m² of pre-let development projects were delivered on schedule and on budget, and over 700,000 m² of new properties are currently under development. At the same time, the occupancy rate of the existing portfolio came at 99% – a full house. These achievements respond to the continuing structural demand for logistics real estate. Indeed, investments in the supply chain and its flexibility and resilience remain a necessity. Besides, the disruptions in the supply chain of recent years must also be taken into account, together with the partial deglobalisation, whereby different continents focus on more autonomy and a self-reliant approach. Despite the cooling macroenvironment and the potential cyclical impact on demand for logistics space, the logistics sector remains fundamentally sound and crucial in terms of infrastructure for many companies – and thus for the economy.
The broadening of our geographical footprint also continued gradually. We took a strategic 10% stake in the Swedish listed logistics real estate company Catena, we are now 100% owners of WDP Deutschland and we are also launching a new project on a strategic land holding in Dunkirk, France.

“WDP agilely navigated through the new reality established in 2022 and successfully continued to safeguard the profitability of its operating activities. Thanks to our solid balance sheet and liquidity, in combination with a passionate team of entrepreneurs, we believe we can generate continued profit growth within a fundamentally sound logistics sector.”
Moreover, and for the first time, our strong earnings growth of +13% to 1.25 euros in EPRA Earnings per share was driven not only by external growth through new investments, but also by an increasing contribution from WDP ENERGY and by organic growth via rent indexation. The latter trend is supported by upward pressure in market rents due to the scarcity of land and buildings. Thus, WDP can show an inflation-proof cash flow profile thanks to contractual indexation clauses and a cost of debt fully hedged over the long term.
As a capital-intensive company, we also responded in an agile manner to the sharply increased cost of capital and volatile capital market. Well-timed pre-hedging instruments enabled us to complete two debt issues totalling approximately 1 billion euros at a fixed rate of 1.5% and an average maturity of 9 years – an actual savings of 125 million euros in interest charges over this period. Our creditworthiness was also emphasized by two solid credit ratings of Baa1 and BBB+ on behalf of Moody’s and Fitch respectively, which will give us wider access to liquidity in the future. Moreover, we were able to strengthen our balance sheet with almost 700 million euros of new equity capital. All this shows a balance sheet – with a net debt / EBITDA (adj.) of 7x, a loan-to-value of 35% and a liquidity position of 1.7 billion euros – reflecting a robust and solid ingoing position to continue investing in the future of our business.

The new reality soon caused the parameters underlying the 2022-25 GROWTH for FUTURE growth plan – launched in early 2022 – to change as well. In fact, 2022 established a new reality for society, businesses, and the wider economy, impacted by a war on the European continent, soaring inflation, an energy crisis, and the steepest rise in the cost of capital in decades. Such situations put the adaptability of companies to the test, and that is precisely where the key to future success lies. For sustained value creation, the company must adapt to these changed market conditions. Specifically, this means we will be more selective about new investments, continue to focus on internal growth opportunities and accelerate the roll-out of WDP ENERGY – evidently while maintaining consistency of a solid financial position. Consequently, our organic growth (mainly through rent indexation) and energy projects, will increasingly contribute to earnings, compared to external growth. Taking this into account and the strong fundamentals we were able to build in recent years, we can confirm our long-term earnings ambitions. So, we remain committed to our ambition of achieving annual EPRA earnings per share growth of +8% to 1.50 euros by 2025.
“The energy crisis has promted us to accelerate the development of WDP ENERGY: by 2023-24, WDP plans to invest 150 million euros in renewable energy projects as well as in the first pilot projects in Green Mobility. Indeed, the challenge within logistics is in making transport more sustainable, and our sites can play a role in decarbonising the customer’s supply chain.
In the future, more than ever, we will need to make a difference through creativity and innovation. With the entrepreneurship and agile spirit of #TeamWDP that has been broadly strengthened and together with our reliable business partners, we look forward to this challenge with confidence. We wish to continue investing in essential logistics infrastructure and to play a prominent role in the accelerated energy transition. All this with an emphasis on profitability to continue generating shareholder value through growing cash flows per share, while maintaining a strong financial position.
Rik Vandenberghe Chairman of the Board of DirectorsRenewable energy capacity
1.25 € EPRA Earnings per share
(+13% y/y)
6.7 € mia Fair value of property portfolio (+10% y/y)
500,000 m² Projects completed
(+14%y/y) 1.00 € Dividend per share
113 MWp
(27,027 T CO2e avoidance)
7.1 x Net debt / EBITDA (adj.)
580 € mio Development pipeline
We continue to generate strong earnings growth, emphasize the increased focus on profitability and reaffirm our 2025 earnings target.
Our robust balance sheet, strong liquidity position and diversified property portfolio with an inflation-proof cash flow profile allow us to capitalise on opportunities.
WDP ENERGY got off to an accelerated start, responding agilely to the energy transition.
Scope 1 & 2 emissions from the WDP corporate offices have been significantly reduced, so we are well on the way to our net-zero target in 2025.
187,081 m² Brownfield projects
(26% of ongoing projects)
Scope 1 & 2 corporate offices
-77 % T CO2e
90 % WDP electricity procurement green


WDP is a leading logistics real estate player. The company develops and leases properties located along major logistics axes in six European regions. WDP is the market leader in the Benelux and Romania.1
The long-term vision and pure player strategy that WDP applies to each property decision also underpins its relationship with its customers. WDP primarily wants to be a long-term partner and support them in their operations where real estate is an indispensable part of their supply chain. With increased green energy production and technology, WDP aims to make its sites more self-sufficient and decarbonise customer operations.
7 million m² for 340 customers in 6 countries
1977 Founding of Rederij De Pauw, the company that manages Jos De Pauw’s property portfolio
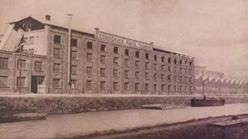
The family-owned group initially limited its activities to a vinegar brewery after which it would diversify to include, among others, sand mining and inland shipping. Jos De Pauw noted the value-add potential of older industrial buildings that could be refurbished into modern logistics warehouses – the foundation of today’s WDP. In 1999, WDP goes public with a property portfolio of 100 million euros. Today, WDP has become so much more than just a real estate specialist. Its modern logistics infrastructure is a crucial link within its clients’ supply chains. And this within a strategy of long-term value creation based on ambitious, delineated, and transparent growth plans where the objectives were successfully completed to date.
2008 1 million m² of rentable property in Belgium, the Netherlands, France and Romania. Solar panel project launch (30 MWp).
2010 First BREEAM warehouse in the Netherlands. WDP Nederland given FBI status.
2012 Portfolio of 1 billion euros.
2014 GVV/SIR status.
+50% portfolio growth and +20-25% EPS increase (cumul.)
2015 WDP shares also listed on Euronext Amsterdam.
2016 Luxembourg as a new core market.
+billion euros portfolio growth and +25% EPS increase (cumul.)
2017 WDP named Entrepreneur of the Year® 2017.
2018 Issuing of first Green USPP as the first Belgian company and GVV/SIR.
+10% p.a. portfolio growth and +6% p.a. EPS increase
2019 WDP is included in BEL 20. Regional expansion to Germany. First ABB via a GVV/SIR. Implementation of 2019-23 ESG Roadmap.
2020 The entire property portfolio has an energy monitoring system and one-third has solar panels.
+8% p.a. EPS increase
2021 Inclusion in DJSI Europe. Launch of WDP Climate Action Plan: net-zero target by 2050 for the entire value chain.
2022 Inclusion in DJSI World and DJSI Europe. First-time issuer credit rating from Fitch (BBB+) and Moody’s (Baa1) with a stable outlook. WDP ENERGY out of the starting blocks. Strategic partnership with Swedish real estate group Catena.
“A strong and long track record as the foundation for attractive earnings per share growth. All thanks to our pure player focus, customer-oriented approach, ambitious growth plans and capital discipline.”
We construct a sustainable shell around the logistics process. With smart warehouses, #TeamWDP and innovative entrepreneurship, we create value for our customers and shareholders.
Warehouses are the linchpin in the supply chain for a sustainable future. These form an indispensable storehouse for the food on our plates, medication when we are sick, the technological gadgets we cherish, and all the other goods that we depend on every day. They help make the supply chain robust and resilient. Our warehouses form a smart and flexible storehouse that helps our customer achieve their operational, social, and climate objectives. They feel at home in the heart of their supply chain. Their home is our home. Our warehouse with brains.
Within our supply chain, we consider our construction and infrastructure partners (architects, engineering firms, contractors) as our critical suppliers, given their direct contribution to the core product of WDP – the logistics infrastructure. WDP calls on reputable, highly qualified and (financially) reliable parties, preferably strong local partners. This part of our supply chain is the most labourintensive.
Numerous advisors and consultants assist WDP: lawyers, notaries, real estate agents, marketing consultancy firms, IT, HR, environment, sustainability, etc. The collaboration is usually project-driven with an eye for long-term partnerships with parties who are familiar with our business and compatible with our company culture. As a capital-intensive company with an ambitious growth plan, we naturally also appeal to the capital market, for example through debt financing with both Belgian and foreign banks and investors.
WDP develops, acquires and manages modern logistics property that it leases to customers on a long-term basis. This enables its customers to focus on their core business. The WDP warehouse site also plays a crucial role in the decarbonisation of the customer’s supply chain. The green energy and technology generated by WDP ensure that the customer’s sites and operations are decarbonised. WDP operates in an integrated manner with in-house specialised teams. The business development team prospects land and properties and, jointly with the marketing team, places new projects and available properties on the market. The project development develops new properties. The Energy & Sustainability team roll out of WDP ENERGY. The property management team handles maintenance and, where relevant, renovation of the existing property portfolio, interacting with project development and Energy and Sustainability. These teams work closely with the finance and legal teams to properly structure the various transactions.
On the downstream side of WDP’s value chain, we find our customers who rent our properties. The customer is paramount within our strategy. And here too, the focus is on the creation of long-term partnerships, which is reflected in high occupancy rates, strong retention, and long-term leases as well as in the high share of repeat business in external growth. We provide them with modern logistics infrastructure, which supports them in their decarbonisation process during this period of energy transition. Moreover, the installation of Green Mobility Hubs will also support the electrification of the wider community around the warehouse site.
Performance and trends See pp. 20
Climate Action Plan
Investments, financing and results, See pp. 70
Cooperation with suppliers See pp. 63
Property portfolio, See pp. 89 –
Markets in which WDP operates See pp. 6, 89
Trends See pp. 23, 36, 44, 52
Performance and trends See pp. 20
Climate Action Plan
Property portfolio rental situation See pp. 93
Collaboration with customers and further expansion of services, See pp. 30, 55, 63
Energy performance indicators for the property portfolio see pp. 31, 176
“
Providing an agile response to a new reality implies a continued focus on profitability and a rocksolid balance sheet.
Our strategy is intended to create value for our customers, our shareholders, and all stakeholders.
#TEAMWDP
#TeamWDP Good governance
#TeamWDP is the beating heart of our company. We want our employees to grow and hone their skills, to feel good as part of a strong team that responds to customer needs. Doing business with integrity and in a sustainable manner form the basis of our daily operations.
Our 100% client-centric approach ensures the development of sustainable buildings in strategic locations that help our customers grow and guarantees maximum occupancy of our warehouses.
With our smart warehouses, we are responding to the logistics issues of today and tomorrow Smart financing ensures a stable and profitable WDP that creates value for all stakeholders.
#TeamWDP
It is important that our members of staff feel good and appreciated and get the opportunity to develop their talents. WDP strives to promote the skills of its employees to facilitate a sustainable and dedicated team and to build capacity and continuity.
#TeamWDP’s entrepreneurship combined with short, fast decision-making lines and the flat structure providing room for innovation, ensure a dynamic cooperation.
#TeamWDP is the anchor point throughout the entire process: after the commercial team has drawn up the outlines of the lease agreement, the buildings are developed under the guidance of experienced project managers and in collaboration with team Energy & Sustainability, after which the property managers relieve the customer of the burden of managing them. WDP also maintains firm control over its financial, accounting, and legal affairs.
WDP provides a solution to the demand for modern, intelligent storage facilities with an eye for sustainability. The customer wants an energy-efficient (and therefore cost-reducing) location that is strategically embedded to promote an optimal flow of goods. WDP offers a diverse portfolio of sustainable and high-end buildings that meet the needs of the industry and are suitable for warehousing, XXL distribution manufacturing, cross-docking, high-bay, urban logistics, etc. WDP ENERGY will use increased green energy production and technology to make its sites more self-sufficient and decarbonise customer operations.
A healthy mix of equity and loan capital is used to finance real estate investments. The goal is to synchronise the issuance of new capital and the taking on of external green financing. This is how the rhythm of investment is followed by the rhythm of financing. By reserving a portion of the profits, we create a financial buffer for the future and these funds can be reinvested in the further growth of WDP.
Conducting business fairly and with integrity, open communication and transparent reporting ensure responsible business practices that balance the interests of different stakeholders and the community.
WDP sites are always chosen based on their strategic location, for example, in the immediate vicinity of storage and distribution hubs and/or multimodal transport facilities. The majority of properties are located in the economic heart of north-western Europe, in the hinterland of the ports of Amsterdam, Rotterdam, Bremen and Hamburg - the import and export gateways of Europe. The properties are spread along the AmsterdamRotterdam-Breda-Antwerp-Brussels-Lille logistics axis and extend to Germany. In Central Europe, WDP is active in Romania, which serves as a gateway for supplying South-Eastern Europe.
The development of a new building or lease of an existing location is preceded by an analysis of the customer and its activities, and in close consultation we arrive at a suitable real-estate solution. Jointly reflecting with the customer implies being open to and leading the way with innovative solutions regarding location, the type of building, goods flows, technology, production of renewable energy, etc.
This four-year plan aspires to achieve an annual increase in EPRA earnings per share of +8% to 1.50 euros in 2025. The dividend per share is expected to evolve synchronously towards 1.20 euros in 2025 including a stable capital structure based on net debt / EBITDA (adj.) around 8x.
At year-end 2022, WDP has identified a total package of investments within this growth plan of approximately 530 million euros.
The parameters underlying the growth plan have changed due to changed market conditions in 2022 (such as sharply increased cost of capital, persistently high construction prices and high inflation). With a view to consistent value creation, we adapted to these changes as a company. Specifically, this means we will be more selective about new investments (namely by putting profitability before volume depending on the cost of capital), continue to focus on internal growth opportunities and accelerate the roll-out of WDP ENERGY. Of course, all this while maintaining a solid financial position. Consequently, our organic growth (mainly through rent indexation) and energy projects, will increasingly contribute to earnings, compared to external growth.
Based on net debt / EBITDA (adj.) ~8x
1.50 € EPRA EPS
The 2022-25 growth plan targets are based on current knowledge and situation and notwithstanding unforeseen circumstances due to the evolution of external factors, such as a weakening macroeconomic outlook, high market volatility and a sharply increased cost of capital.
Selective capital deployment on new investments (in function of cost of capital and construction costs)
Capitalizing on existing markets BENELUX and RO (with RO <20%)
Broadening EU-footprint: further deployment and activation of FR and DE
Strategic land bank with a focus on pre-let developments within the developer/investor model
Competitive logistics market due to high resilience and critical role in the supply chain
Stay ahead by client centricity and a high-quality portfolio
Growing scarcity of land leading to upward pressure on market rents
Well-positioned to capture high(er) inflation through CPI-linked rent
Rental reversion potential in the medium-term, with commercial approach
Unlock potential through services, upgrades, sustainability measures etc.
Upscaling of WDP ENERGY with a clear focus on energy transition
Demonstrate industry leadership and engage with clients & suppliers in decarbonization targets
Acknowledging climate risks yet seeing business opportunities
Technology and innovation as enablers
Based on Climate Action Plan with target setting over entire value chain
1.25 euro
EPRA earnings per share
99.1%
Occupancy rate
580 mio euros
Development pipeline
WDP strives to achieve balanced growth as a part of its transparent and fair governance. This is how we respond to to economic, social, and environmental needs.
113 MWp
Renewable energy capacity
187,081 m2
Brownfield projects
-77% T CO2e
Scope 1 & 2 corporate offices
The high-quality logistics infrastructure we offer facilitates and optimises our customers’ activities and guarantees them quality, sustainability, and continuity.
39 hours
#WeEducate
238,000 euros
#WeCare
7.7/10
Employees satisfaction score
#TeamWDP
CUSTOMER FOCUS
INNOVATIVE ENTREPRENEURSHIP
90%
Lease renewal
50% Repeat business
MyWDP
Development and launch of a customer portal mobile app
Vitally engaged
#TeamWDP is the driving force behind our value creation. We focus on their welfare, safety, and development and on the environment around our operations and local communities.
We are committed to a strong and reliable value chain, with an eye for health, safety, and integrity. We take responsibility for risk management, including human rights.
1 Omnichannel in a digital environment
See pp. 44
1 Supply chain transformation
See pp. 52
1.25 € EPRA earnings per share
99.1 % Occupancy rate
580 mio € Development pipeline
It is essential that WDP continues to prioritise stakeholder engagement to maintain strong partnerships. We can better understand their individual needs and integrate them into our growth ambitions through continuous proactive dialogue with all our stakeholders. We communicate transparently based on clear and transparent targets to achieve value creation based on profitable growth including our commitment to sustainability.
WDP aims to achieve balanced growth within a context of transparent and fair governance. In doing so, we offer answers to economic, social, and environmental needs. This makes us a reliable partner for all our stakeholders and leads to sound financial metrics and attractive, recurring returns.
Performance and trends See pp. 21
Targets
Growth plan 2022-25 EPRA EPS in 2025: 1.50 euros
Dividend per share in 2025: 1.20 euros
WDP GREEN. Green certified assets: > 75% by 2025
Green financing: > 75% by 2025
TCFD: adoption of requirements by 2024
Reporting standards ratings and indexes
EPRA: Gold
GRI: Core
MSCI: A in 2023 onwards
ISS ESG: Prime C in 2023 onwards
DJSI Europe: inclusion
accomplished on track flagged for improvement
Trends
1 Go for green
See pp. 23
1 Sustainable land use
See pp. 36
113 MWp Renewable energy capacity
187,081 m2 Brownfield projects
-77 % T CO2e Scope 1 & 2 corporate offices
From the start of a project development, WDP enters into discussions with its customers about the plan, design and strategic location of its properties. We pay a lot of attention to the energy efficiency of the building and green power supply. This is key including in the decarbonisation of the customer’s supply chain. So, we also work with existing customers to look at what measures we can take in terms of energy efficiency and energy supply.
Our ‘warehouses with brains’ are an indispensable link in the supply chain of our customers. The high-quality, forward-looking, logistics infrastructure we provide facilitates and optimises our customers’ operations and guarantees them quality, sustainability and continuity.
Performance and trends See pp. 31
WDP DECARB+.
Targets
Scope 1 & 2 corporate offices: net-zero by 2025
Scope 1 & 2 car park: net-zero by 2030
Scope 3 leased assets (downstream) net zero by 2040
Scope 3 capital goods (up-stream): net zero by 2050
WDP ENERGY. WDP electricity procurement green 100% by 2023
Energy monitoring system: 100% coverage by 2025
Renewable energy capacity: 250 MWp by 2025
LED lighting: 100% coverage by 2030
Trends
1 Go for green
See pp. 23
1 A new reality that requires an agile response from #TeamWDP
See pp. 14
Vitally engaged
It is important that everyone in #TeamWDP feels good, valued and given the space to develop their talents. We map the focus areas using formal and informal feedback moments and the annual satisfaction survey. We aim to minimise the impact that property development has on the immediate environment through a clear commitment to the local community with continuous and mutual dialogue.
#TeamWDP is the driving force behind our value creation. Accordingly, we actively commit to the well-being, safety, and development of our staff. We strive to ensure our activities have a positive impact on the immediate surroundings and contribute to the needs of the local communities.
Performance 2022 See pp. 45
39 hours #WeEducate
238,000 € #WeCare
7.7/10 Employees satisfaction score
Targets
#WeMakeADifference #WeAreConscious: 100% coverage energy monitoring system by 2025
ESG targets for #TeamWDP
Annual minimum 90% achievement of ESG targets by #TeamWDP
Employee satisfaction & engagement Satisfaction score #TeamWDP: minimum 8/10
Output accomplished on track flagged for improvement !

Trends
1 Go for green
See pp. 23
1 Sustainable land use
See pp. 36
1 Supply chain transformation
See pp. 52
Output
90 % Lease renewal
MyWDP Development and launch of mobile application of customer portal
HSES Awareness campaigns for our customers
WDP first and foremost wants to be a partner of its customers and build a successful long-term relationship with them to provide them with maximum support. Responding to their energy transition and electrification challenges is high on the agenda today. We ensure that customers get a real-time insight into their energy consumption with the WDP customer portal and app. WDP builds long-term relationships with all its partners within the supply chain to ensure increased customer service and healthy, safe and respectful cooperation with all stakeholders.
We are committed to a strong and reliable value chain: from our suppliers, who help shape the core product of WDP to our clients who distribute their goods globally. Our strong relationship with our different business partners ensures we can respond to their wishes and challenges. We contribute to the health, safety, and integrity of their staff. Moreover, we take on our responsibility in terms of risk management in our supply chain, including human rights. This is how we raise WDP’s value creation to a higher level.
Long-term partnerships
Targets
At least 80% lease renewal
HSES Annual audit as regards existing properties, projects or offices WDP
Customer well-being Additional services to promote the well-being of our customer and its staff
Supply chain management Further expansion and formalisation
accomplished on track flagged for improvement
Performance 2022 See pp. 53
“
With future-oriented value pillars we remain relevant as a logistics real estate partner to our client and take responsibility towards our team and society.
Accomplishments in 2022
WDP aims to achieve balanced growth within a context of transparent and fair governance. In doing so, we offer answers to economic, social, and environmental needs. This makes us a reliable partner for all our stakeholders and leads to sound financial metrics and attractive, recurring returns.
99.1 %
Materiality
1 Corporate governance & business ethics
1 Energy efficiency
1 Climate change adaptation
536 mio €
This value pillar allows us to respond to the following key risks:
Climate transition see pp. 151
Decline in fair value see pp. 153
REIT status see pp. 152
Financing see pp. 154
Market risks see pp. 155
Project developments see pp. 156
Solvency’s see pp. 157
Vacancy risks see pp. 157
39 % infringements
Green certified assets
58 %
0 Green financing
Dealing Code, Employee Code of Conduct, Supplier Code of Conduct, Human Rights Policy, nor violations or judgements of the competition law or as a result of corruption or fraud, nor reports of discrimination or intimidation.
Quick links
Financial results see pp. 70
Growth plan 2022-25 see pp. 14
Climate Action Plan
Reporting standards, ratings, and indexes see pp. 193
WDP policies
Stakeholder engagement 2022 see pp. 63
ESG-governance see pp. 64
Grievance mechanism
Within the 2022-25 growth plan, WDP aspires to achieve a profit target of EPRA earnings per share of 1.50 euros by 2025 – an annual increase of +8%. The dividend per share is expected to evolve synchronously towards 1.20 euros in 2025.
Despite the disruptions in market conditions changing the underlying parameters in this growth plan (such as the sharply increased cost of capital, persistently high construction prices and high inflation), WDP believes it can swiftly adapt as an organization and confirms its profit target which once again highlights the agile nature of #TeamWDP. Even in a more challenging environment, WDP believes that it is well-positioned to continue creating long-term value for its shareholders through growth in EPRA earnings and dividends per share while maintaining a solid financial position. Specifically, the emphasis on profitability (vs volume) will be reinforced through selectivity in property projects, the importance of organic growth opportunities will be increased (mainly through rent indexation) and the roll-out of WDP ENERGY will be accelerated with respect to external growth, compared to what was originally envisaged in the growth plan.
This objective is supported by the strong progress that was achievable during 2022, in particular the investments in both new projects and land and acquisitions of existing buildings, investments in energy transition and two strategic participating interests.
2023 AMBITION Of WDP policies, nor violations or convictions related to competition law or as a result of corruption or fraud, nor reports of discrimination or intimidation.
2024 AMBITION Implementation of practical and targeted actions within the framework of a 3-year roadmap to increase the maturity of cyber security in various domains.
2023 AMBITION Training programme for #TeamWDP that provides recurring training on the behavioural principles and values in the Code of Conduct (including discrimination, harassment, human rights, anti-corruption and bribery), Corporate Governance Charter, HSES, Risk Management, etc.
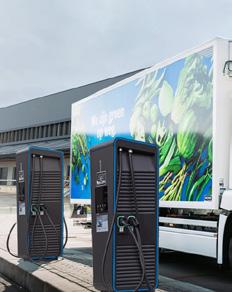
Zellik, Belgium
Customer VPD
1.5 MWp solar energy capacity
Battery storage
10 charge points (fast chargers) for delivery vans and lorries
17 charge points for passenger cars
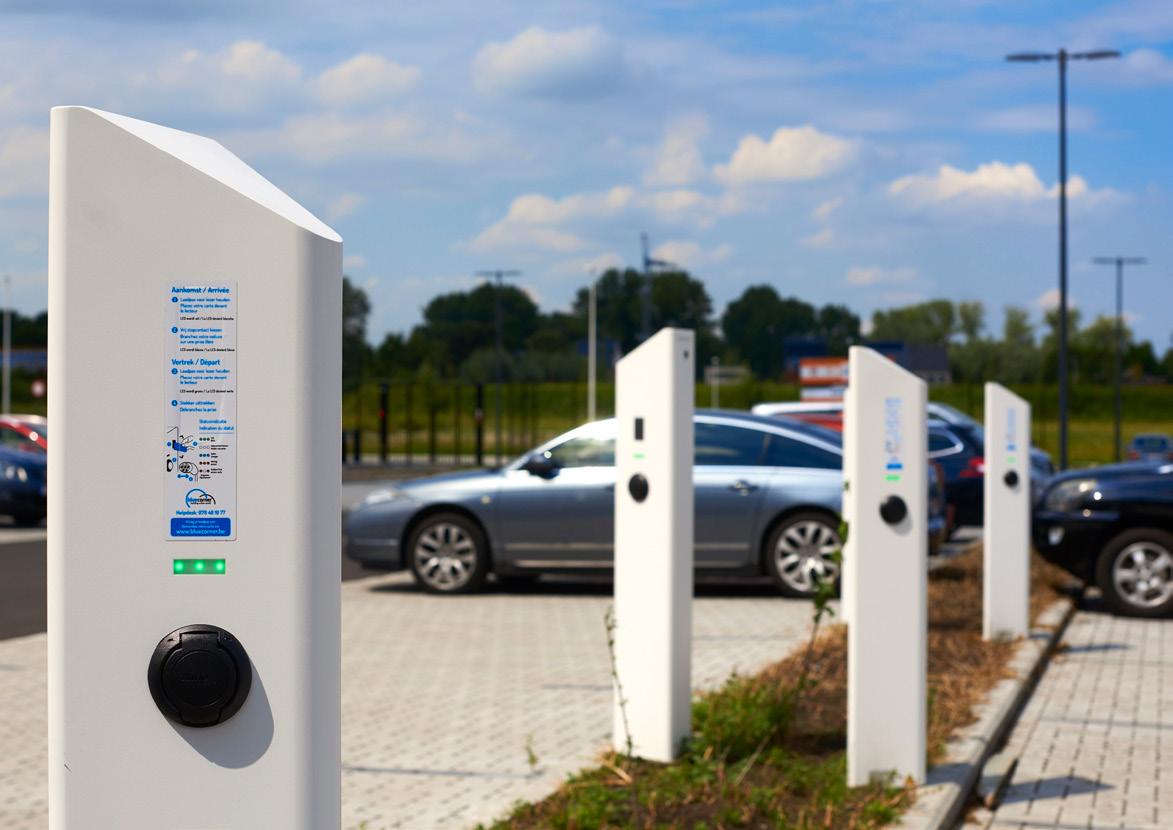
Investment budget 4 million euros
Last-mile deliveries are made by small delivery vans that are also delivered by larger trucks from the same distribution centre. Our customers feel enormous pressure to organise this transport as efficiently and sustainably as possible, much like their operations in the warehouse. Sustainability plays an important decision factor in our customer’s business strategy and their property, driven by cost reduction and regulations. Investors and the capital market acknowledge real estate companies committed to sustainable portfolios.
Moreover, the EU Green Deal expects the decarbonisation of real estate and transport, among others, and a switch to e-mobility to implement a fully sustainable supply chain. The global energy crisis has increased the demand for efficient energy solutions and accelerated the energy transition. There is a clear role here in how our warehouse sites are set up.
EPRA earnings per share for 2022 are 1.25 euros per share, a year-on-year increase of 13%. This was mainly driven by new construction projects (approximately 500,000 m² of pre-let new construction projects were successfully completed) and organic growth via the indexation of leases as well as newly realised acquisitions and some non-recurring income.
Profitability was supported by an almost fully let portfolio (99.1% occupancy rate) based on continued healthy market dynamics and confidence on our part, which was reflected in 100% retention.
1 All these acquisitions were realised at fair value prices as per valuation reports prepared by the independent property experts.
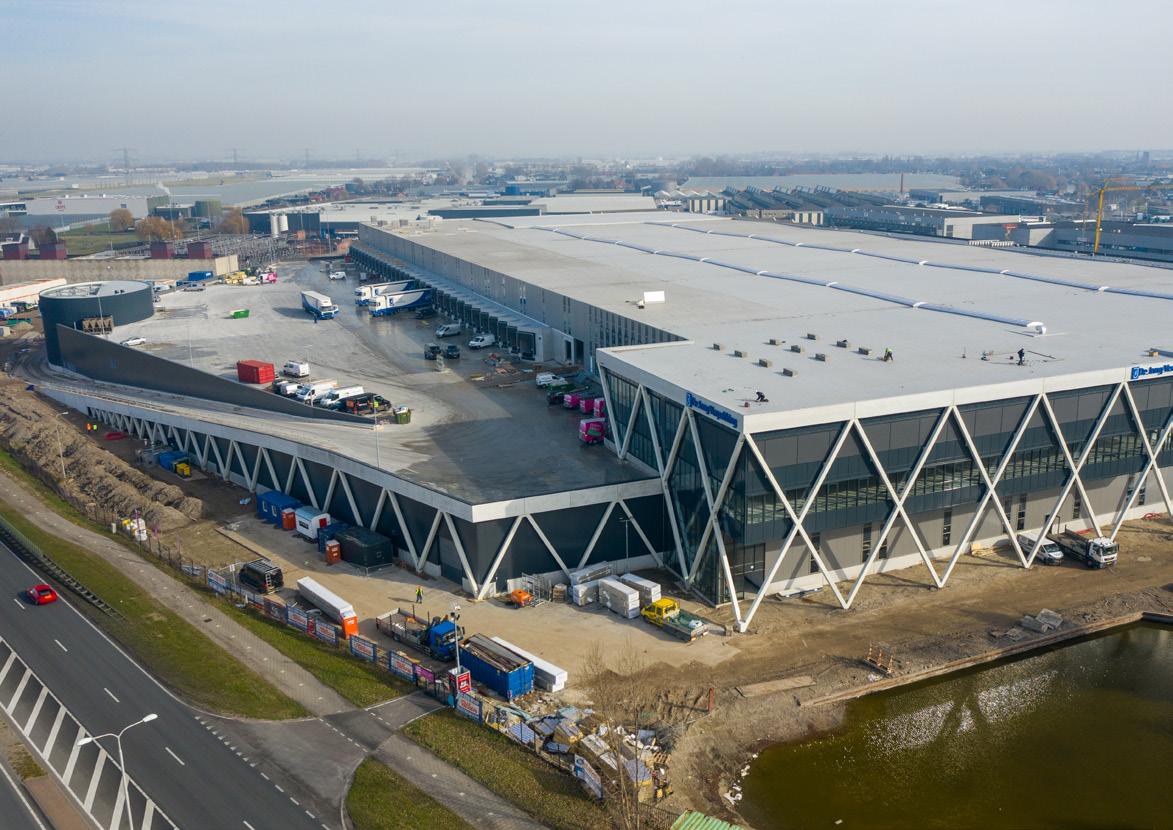
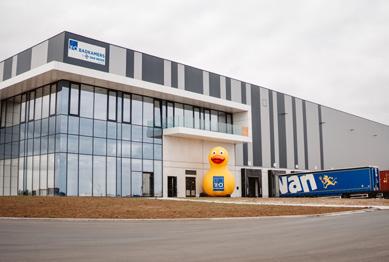
X2O Badkamers/Exterioo The trimodal character of WDPort of Ghent, with a lettable area of 150,000 m², allows the customer to optimize its supply chain and to further develop it in an environmentally friendly manner.
Overview of all ongoing projects1,2
1 Based on 100% of the investment for the fully consolidated entities (including WDP Romania) and the proportionate share for the joint ventures (i.e. 55% for Luxembourg and 29% for the WDPort of Ghent Big Box – X2O Badkamers/ Exterioo). The lettable area for joint ventures is always shown on a 100% basis.
2 With regard to the redevelopment projects, this does not factor in the value of the redevelopment projects before the start of the renovation. Of the total investment volume of 578 million euros, 337 million euros still had to be invested by 31 December 2022.
Within the 2022-25 growth plan, the path is set to achieve profitable growth including further geographical expansion through deployment in Germany and the start of operations in France. To date, WDP has already taken many actions to reinforce, expand and boost our ambition.
WVI GmbH (WDP’s former 50/50 joint venture with VIB Vermögen AG for the joint expansion of both companies in North Rhine-Westphalia, Bremen and Hamburg) became a wholly owned subsidiary of WDP (WDP Deutschland GmbH) in 2022.
Strategic partnership with Catena
WDP has taken a 10% stake in Swedish-listed logistics real estate company Catena. Catena and WDP intend to achieve a wider geographical distribution for their customers so that it is also possible to provide customer service in the regions between those where both companies currently operate to optimise their customers’ flows of goods. Both companies want this collaboration – aimed at exchanging knowledge on sustainability, project development, and the general activities of both companies – to further optimise the fully integrated focus on the customer. It will also further embed their competitive position within the European logistics property market.
In the port of Dunkirk, WDP has taken out an option on a concession of a 17-hectare parcel of land with 90,000 m² of developable area. Plans for the construction of a state-of-the-art distribution centre were drawn up and WDP has commenced commercialisation. The port offers direct access to French waterways, railways and the international road network. The port is part of Norlink Ports, a network of 3 maritime and 20 inland ports.
In announcing its growth plan 2022-25, WDP sets out its ambition for the further upscaling and expansion of its ‘Energy as a Business’ operations as a separate business line. This strategy – in particular, the WDP ENERGY track within the WDP Climate Action Plan – aims to respond to the accelerated and evolving customer energy needs to ensure its sites and customer transport are more self-sufficient and decarbonised by increasing the use of green energy production and technology.
The first step to investing in solar power was taken back in 2007 with the roll-out of 10 MWp of renewable production capacity. By the end of 2022, a third of the roofs of our entire property portfolio is now equipped with solar panels, which accounts for an energy production capacity of 113 MWp (notably 8% of our revenue). WDP wishes to further expand this capacity to 250 MWp by the end of 2025 and thus play a leading role in Europe’s energy transition.
The current energy crisis and the increased focus on profitability created a significant scaling-up of renewable investments throughout 2022: during 2022, 58 MWp was identified (investment volume of 40 million euros) of which 18 MWp was realised. Moreover, WDP has identified an additional investment volume of over 100 million euros (mainly through the expansion of solar power capacity in
2007-21
Energy optimalization of the property portfolio
Installed solar capacity of 100MWp
Energy Monitoring System
2022
Our response to EU Green Deal targets
Towards a truly sustainable supply chain
Responding to customer energy needs
Accelerated roll-out of the Energy as a Business-strategy as a response to energy transition
Green mobility hub see pp. 23
IN-HOUSE ENERGY & SUSTAINABILITY TEAM
Decarbonisation of client’s supply chain (transport & operations). Self-sufficiency through on-site energy production & infrastructure. Battery & (public) charging points (car, van & trucks).
Maximizing solar capacity
Battery technology
Charging points for cars, vans and trucks
Energy flow management
E-heating
Innovative solutions
“The energy capacity we are aiming for by 2025 is comparable to the annual power supply of nearly 100,000 households.
The intended profitability objective of the 2022-25 growth plan aspires to achieve EPRA earnings per share of 1.50 euros with WDP aiming to maintain a stable capital structure at all times with net debt / EBITDA (adj.) around 8x – in line with its long-term track record.
WDP also did not deviate from its capital discipline in 2022: among other things, liquidity was strengthened with the issuance of approximately 1 billion euros of new debt at a fixed interest rate of 1.5% with an average term of 9 years.
The company’s creditworthiness was also emphasized by obtaining a Baa1 (Moody’s) and BBB+ (Fitch) credit rating.
This financing strategy assumes a healthy mix of equity and debt and smart financing via the synchronous issuance of new equity and the sound diversification financing sources. New property investments will be financed with at least 50% equity and a maximum of 50% debt – in line with the stringent strategy that WDP has pursued for over 10 years.
Within the framework of the WDP Climate Action Plan, WDP has clearly committed to maximizing its green financing. This ambition on making financing and operations more sustainable is also integrated into the WDP Climate Action Plan: the WDP GREEN track sets clear targets on green financing and green certified warehouses. Accordingly, WDP aims to increase the proportion of green certified assets in the total property portfolio and the proportion of green financing to minimally 75%. The WDP Green Finance Framework updated in 2022 defines which green projects are eligible (for more details see chapter 7. Management of financial resources).
58 % Green financing
39 % Green certified assets
1.7 € bn
97 % Liquidity
Hedge ratio
WDP has a robust liquidity profile with unused and confirmed credit lines of 1.7 billion euros. Moreover, financial debts are fully hedged against rising interest rates on a longterm basis (7 years on average).
35 %
7.1 x Loan-to-value
Capacity has been created to respond to investment opportunities with a loan-to-value of 35.4% as of 31 December 2022 (36.7% as of 31 December 2021) and a net debt / EBITDA (adjusted) 7.1x (7.9x as of 31 December 2021). This also offers an extra buffer in case of any further portfolio write-downs due to rising interest rates.
More info
Financial management see pp. 82
Implementation of the financing strategy see pp. 87
WDP is convinced that sustainable growth can only be achieved with good governance and ethical business practices. We are regarded as a reliable business partner and continue to safeguard this reputation. This is essential for achieving long-term success and making further progress with the various stakeholders.
WDP can rely on robust governance led by the Board of Directors and its committees and the Management Committee. See chapter 8. Corporate governance statement for more detail about the composition and operation of these bodies in 2022.
The principles of ethics, good governance and corporate social responsibility are formally enshrined in various codes and charters. Compliance with it or any breaches thereof are closely monitored to prevent any negative impact. The Grievance Mechanism provides a low-threshold hotline in case of breaches for staff, suppliers and the community. This is not just for reporting violations of the law, but also behaviour that violates the ethical standards WDP stands for (including zero tolerance for harassment, discrimination, and corruption).
Moreover, WDP has a sound enterprise risk management procedure in place (for more details see chapter 8. Corporate governance Statement), which focuses strongly on strengthening the risk culture within #TeamWDP through the use of risk ambassadors in the various country teams. For example, the Cybersecurity Roadmap was further implemented in 2022 by developing a Business Contingency Plan. The outcome of the project includes an IT Disaster Recovery Plan for restoring business-critical applications, an inventory of backup procedures and a Crisis Communication Plan in case of a cyberattack. In this context, we will focus very strongly in 2023 on raising awareness within the organisation, including through cyber awareness training, online and offline phishing campaigns and commissioning ethical hacks. A test of the Business Contingency Plan is being arranged and we will continue to extend the security of our employees’ IT assets (laptops and smartphones).
We use a strategy of long-term partnerships and dialogue to keep all stakeholders informed through communication and reporting that is committed to transparency and quality. We report according to recognised standards, such as the EPRA and GRI, and continue to prepare for (European) reporting requirements.

Concerns about (possible) violations of the law or procedures, ethics code or procedures, such as the WDP Corporate Governance Charter, Employee Code of Conduct, Supplier Code of Conduct, Human Rights Policy, Ethics Code, etc.
Online hotline for complaints regarding WDP (in the broad sense) by all stakeholders. This is not limited to reporting improper and/or illegal practices, but can also serve to report any dissatisfaction with the activities of WDP and/or its staff.
Online hotline to report problems or violations in the workplace
1 Greenhouse gas emissions
1 Energy efficiency
1 Climate change adaptation
1 Material selection & scarcity
1 Water conservation
1 Waste management
1 Biodiversity Accomplishments in 2022
Our ‘warehouses with brains’ are an indispensable link in the supply chain of our clients. The high-quality and future-oriented logistics infrastructure we offer clients facilitates and optimises their activities and guarantees quality, sustainability, and continuity.
This allows us to respond to the following key risks:
Climate transition see pp. 151
Supply chain see pp. 158
Decline in fair value see pp. 153
Vacancy risks see pp. 157
106,823 MWh Energy produced 27,027 T CO2e Avoidance through the
Quick links
Stakeholder engagement 2022 see pp. 63
Responsibilities and decision-making process see pp. 64
Grievance Mechanism Climate Action Plan
MyWDP
2
WDP’s 2022-25 growth plan sets out its ambition for the further upscaling and expansion of its ‘Energy as a business’ operations as a separate business line. The EU Green Deal expects transportation to decarbonise and switch to e-mobility to attain a fully sustainable supply chain. Moreover, in 2022, geopolitical tensions and the ensuing energy crisis have accelerated the energy transition. WDP reaffirmed in summer 2022 its desire to play a leading role in this accelerated energy transition.
For some years now, the WDP construction standard for a new-build warehouse is annually tested and updated with its energy efficiency being one of the priority considerations. We are committed to fully insulating of walls and roofs, LED lighting with dimming and motion detection, the greenest and most energy-efficient insulation and heating and air conditioning systems, the installation of solar panels and, where relevant, e-mobility.
2040 AMBITION
2050 AMBITION
As part of our Climate Action Plan, we make a clear choice to also link the use of the building to practical initiatives, such as green energy procurement, smart monitoring of energy, water and our clients’ staff circulation in the building and the implementation of sustainable maintenance strategies. Moreover, as of January 2022, every newly built warehouse will be constructed to achieve (at least) a BREEAM In-Use Very Good certificate.
However, WDP wishes to go a step further and adapt to climate change by specifically using its Energy as a business strategy that responds to accelerated, evolving client energy needs. For example, we can make our sites more self-sufficient and decarbonised with increased green energy production and technology. Indeed, WDP is convinced of the crucial role a warehouse site can play in the decarbonisation of its client's supply chain, and thus approaches its projects from a business-relevant context.
In 2022, WDP decided to convert an existing warehouse into a Green Mobility Hub. This pilot project is at a site in Zellik where logistics provider VPD handles last-mile operations for numerous non-food retailers who themselves also expect the services within their supply chain to be done in a CO2-neutral way. This Green Mobility Hub will provide the energy production and infrastructure needed for the decarbonisation of transport and operations on-site by the client: specifically, the site will be equipped with a PV installation on the roof of the entire building that will be combined with a battery and electric charge points for passenger cars, delivery vans and lorries, and this for both inbound and outbound goods traffic. In addition, the existing offices’ energy consumption will be
decarbonised by installing a heat pump to replace gas heating. This project will also support its client and the wider community in a sustainable way thanks to the establishment of public charge points for other – external – (freight) vehicles. It will also cater for users in the surrounding industrial zone. The project will be realised by WDP in close collaboration with client VPD.
The upgraded warehouse site will contribute to the sustainable targets of WDP's client and their (end) client. WDP sees this site as a pilot project, focusing on sustainable urban logistics in the first phase. Its continued roll-out will address the challenges faced by all clients within its portfolio for both short-haul distribution and long-haul transport.
Scaling up renewable energy capacity using the installation of solar panels is one of the drivers of the Climate Action Plan. Local power generation using solar panels creates a solid basis for the continued roll-out of sustainable measures at the warehouse site of the future. Maximising the capacity of our rooftops by producing renewable energy contributes to the decarbonisation of the entire warehouse site and client energy consumption (scope 3 downstream) and facilitates WDP meet the EU’s climate ambitions.
WDP wishes to significantly increase its production capacity in solar panel parks, as this is the cornerstone for the further development of the WDP ENERGY track within the Climate Action Plan. Indeed, by increasing local green energy production, WDP can realise further investments at its sites, such as smart grids, batteries and electric vehicle charging infrastructure, to match and
“WDP’s solar park generated some 107 GWh of electricity in 2022, slightly less than half the measured client consumption. In total, we avoided more than 27,000 T CO2e.
optimise energy consumption and production. This allows WDP to anticipate the continued electrification of warehouses using an increased amount of automation, equipment (such as refrigeration and industrial applications) and switching to electric transport (for cars, vans and lorries). Future work will also continue to explore how infrastructure and operations at WDP sites can take place as autonomously as possible or with a minimised load on the grid.
WDP is aiming for a solar panel capacity of 250 MWp by 2025. During 2022, we identified 58 MWp, of which 18 MWp was already realised by year-end.
WDP will roll out a solar panel pilot project on the roof of one of its sites in the existing cluster of buildings owned by WDP in the Londerzeel industrial zone. There will be two installations on this roof. One will be used by the local client in the building and the other (1.3 MWp) by a client in a neighbouring WDP building where solar panels are not possible due to building constraints. The PV installation is connected to the neighbouring property via a physical connection (direct line). This is once again an example of how WDP approaches its projects from a business-relevant context.
Implementing WDP ENERGY obviously requires execution power. So in early 2022, WDP decided on engaging an Energy & Sustainability team led by Elke Van Den Broucke –WDP's Head of Energy & Sustainability. This team brings together expertise, innovation and resources. They are dedicated full-time to rolling out of the Energy as a business strategy and the challenges on the level of sustainability and decarbonisation. In 2022, the WDP Energy & Sustainability team was expanded further with creative business developers and experienced project managers. Together they provide the crucial execution power and innovative approach that WDP’s ambitious climate plan demands.
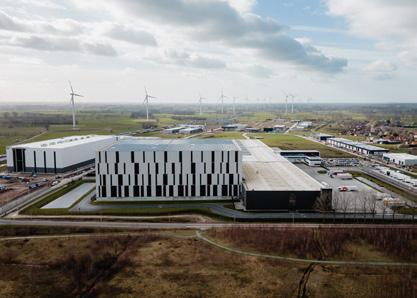
With the installation of the largest solar park on a single roof in Europe, WDP is once more taking a large step in its transition to green energy. More than 37,000 solar panels will appear on the roof of the logistics park WDPort of Ghent at the start of 2023. This installation will generate a total capacity of 25 megawatt peak, which in principle is enough power to power 8,000 to 9,000 family homes. On the utility scale, this output brings the field close to the giga-installations already common on the ground.
In 2018, WDP resolutely put forward the ambition to measure the electricity, water, and gas consumption of the entire WDP portfolio using nanoGrid, a digital system that monitors utilities and energy in real time from energy proptech company nanoGrid. This tool measures the consumption of utilities, such as electricity, gas, and water, as well as solar panel performance, and provides insight into the client’s consumption (scope 3 Leased assets downstream). Given the increasing importance in the real estate sector of accurate energy monitoring and data analytics, WDP entered into a strategic partnership in 2021 with the energy proptech company nanoGrid by acquiring a 25% stake. We believe that we can make a sustainable difference in energy efficiency when we can assess the total impact of the consumption in our buildings; that includes the tenant's consumption governed by the utility contracts they entered into.
Today, nanoGrid has been rolled out across 78% of WDP's property portfolio. The data we acquire through nanoGrid is the perfect basis for reliable reporting under EPRA's sustainable Best Practice Recommendations (sBPR). For more information and interpretation on the EPRA environmental performance indicators, see Chapter 10. Reporting according to recognised standards on pp. 170.
More importantly, the nanoGrid data will increasingly improve our insight into our client's energy consumption. This allows us to offer ever better-targeted campaigns and services to our clients, including through the digital client portal MyWDP. For example, in 2022, we used this portal to organise an initial client survey about the nature of the electricity contract they signed (green/grey). This input led to an improved estimate of tenantobtained electricity and associated GHG emissions (scope 3 Leased assets downstream).
The
“By approaching the projects from a business-relevant context, WDP will grow WDP ENERGY as a true business line that contributes to the 2022-25 growth plan.
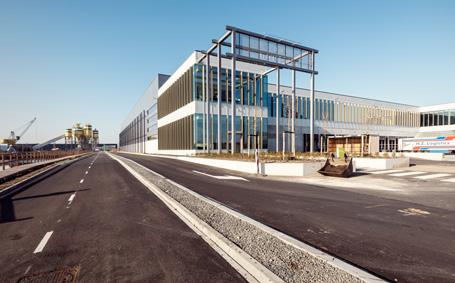
Stacking is smarter. Multi-layer warehouses offer an answer to scarce land availability.
Multilayer warehouse
De Lier, The Netherlands
Customer De Jong Verpakking
Lettable area 83,000 m²
Ground surface area 56,000 m²
Over 100,000 m2 of surface area saved Investment budget 54 million euros
Immediately available land is scarce and puts upward pressure on land prices. Sustainable management also takes into account whether tapping new land parcels is actually opportune. So, real estate companies are increasingly focusing on redevelopment projects, so-called brownfield developments: remediation eliminates any (previous) pollution and sustainable technologies and materials are implemented. This creates an improved ecological footprint and the health and safety of the staff who will work there is taken into account from the very first pencil drawing. A brownfield development also forces one to think out-of-the-box, for example by using vertical construction. For example, a multi-storey structure optimises the distribution capacity of a building.
WDP recognises the impact its operations have on the environment and is prioritising significant reductions in its greenhouse gas emissions. The DECARB+ track focuses on various dimensions that help determine our environmental footprint: land use, use of materials, resilience of our buildings, energy consumption, biodiversity, air pollution, water pollution, soil pollution.
Ongoing Brownfield projects, i.e. 26% of all development projects under construction.
WDP breathes new life into older underused sites. Brownfield developments meet the scarcity of free space. In addition to redeveloping such sites into modern new-build warehouses with new sustainable technologies, such a project often also involves cleaning up the (formerly) polluting site. This will reduce the environmental footprint of the site and also contribute to the health of the workers who will occupy the premises and the surrounding area.
WDP will use vertical development to offer a sustainable, efficient, and innovative answer to the scarcity of available logistics plots and rising land prices. This vertical innovation minimises the footprint of the buildings and optimises storage and distribution capacity.
Local laws and regulations are observed in the development of projects and renovations. Biodiversity provisions are based on the EU directives, such as the Habitat Directive and the LULCF Directive. Moreover, WDP works closely with architects, contractors, ecologists, and biodiversity experts during the permitting process, design phase, and the construction phase of a warehouse.
To date, WDP has already taken a great many actions to contribute to reducing its environmental footprint.
The road mapped out in the WDP Climate Action Plan must massively reinforce and expand our current approach.
Multimodal locations with direct access to road, water, rail, and/or air
WDP believes that the future of logistics lies in multimodal solutions. WDP strategically plans its warehouses in locations where hubs for road, shipping, rail, and air traffic can be or have already been developed. WDP intends to generate added value from these multimodal locations by creating synergies between clients, regions, cities, ports, public services, and so on to achieve smart logistics (such as bundling or agricultural logistics). In the future, this may provide opportunities to create energy communities.
WDP makes green investments in its property portfolio at the request of the client or on its own initiative in combination with an adjustment to the lease terms and reduced energy consumption. This is how relighting projects regularly occur in existing buildings.
A total of 43 WDP locations, both in Belgium and the Netherlands. This represents a 72% increase compared to 2021. As of 2022, the intention is that every newly built warehouse will achieve BREEAM In-Use VERY Good certification.
A total of 48 locations included in the Romanian property portfolio.
The actions and pathways outlined in the Climate Action Plan should lead us to the net-zero targets for scope 1, 2, and 3 with 2020 as the base year. This is how we map out our entire footprint, not only downstream (consumption by our clients in our buildings), but also upstream as well (embodied carbon in project developments, renovations, and solar panels). For the methodology we used to calculate our WDP climate footprint, we refer to the explanation of the reporting according to the GHG Protocol as explained in Chapter 10. Reporting according to recognised standards – EPRA and GHG Environmental Performance Indicators
The majority of WDP's greenhouse gas emissions fall within the scope 3 emissions associated with the construction and operation of our properties. Given the large number of new development projects (both buildings and solar projects), the share of embodied carbon rises to almost 70% of WDP's total emissions. Furthermore, 30% is linked to our clients' energy consumption and less than 0.1% is linked to scope 1, 2 and 3 emissions from WDP's corporate offices, car park and business travel.
WDP's total GHG emissions amount to almost 290,000 T CO2e. This is an increase of 53% compared to 2021, mainly due to the strong growth in the number of new development projects (365,000 m² in 2021 and 467,000 m² in 2022) and the use of more primary data in our methodology.
In fact, we switched as much as possible to primary data coming from our contractors. This is representative of the exact materials and quantities used instead of what is known as spent data (CO2e per euro spent). For subsequent years, we are further committed to expanding primary sourcing and will also subject the entire project portfolio to individual analysis. This obviates the need for extrapolation. To determine our fleet emissions, we switched to a more refined method that provides a more accurate estimate (and increase) of the emissions per car.
in accordance with the methodology of the GHG Protocol
WDP value chain emissions
17% Solar panels 30% Energy consumption clients* 2,637 kg CO2e/kWp 15 kg CO2e/m²
53% Developments of which <1% renovations 100 kg CO2e/m²
326 kg CO2e/m²
* extrapolated value to a coverage of 100% based on EPRA GHG-Dir-Abs (market-based)
WDP corporate emissions
<1%
61% WDP Car park (scope 1 and 2) 153 T CO2e
2,074 kg CO2e/FTE
34% WDP Business travel (scope 3) 86 T CO2e
2% WDP corporate offices (scope 3) | 5 T CO2e
3% WDP corporate offices (scope 1 and 2) | 8 T CO2e
WDP's absolute emissions linked to the use of the offices (scope 1 and scope 2) dropped further to 8 T CO2e in 2022, a decrease of 77% compared to 2021 or 87% compared to 2020.
This is mainly due to the fully CO2-neutral heating and cooling of our Wolvertem headquarters since the summer of 2021 (scope 1 emissions corporate offices decrease by 81%). The remaining scope 1 emissions are from central gas heating in the Romanian office. As of 2022, WDP exclusively purchases 100% green electricity for all its offices, which leads to a further reduction in our scope 2 emissions (-24% compared to 2021 and -91% compared to 2020). The remaining scope 2 emissions are due to the office district heating in the Netherlands, which runs on low-carbon biomass. We will consider how to deal with the remaining emissions and/or bring these within a carbon removal strategy.
This year – for the first time – two additional categories were included in the carbon footprint calculation. The first (and most significant) is business travel (scope 3 – Category 6). For WDP, this mainly concerns travel within the context of Investor Relations and travel to and from our Bucharest office. Efficient collaboration with international teams requires regular travel, which increased again from spring 2022 onwards after the pandemic. Emissions linked to these flights account for 86 T CO2e, which is about a third of corporate emissions and are expected to increase. However, compared to the other Scope 3 emissions, this remains negligible (0.03%).
Another scope 3 category added for the first time is the emissions linked to energy activities (category 3), accounting for 5 T CO2e. This category is also negligible compared to other corporate emissions.
So the most material categories where WDP can have a direct impact within corporate emissions are linked to transport. Specifically, these are from our car fleet and business travel, although for the latter category this must also be (partly) brought within a carbon removal strategy.
Scope 1 and 2
Corporate offices
AMBITION 2025
Scope 1 and 2
Carpark
AMBITION 2030
WDP commits to reduce scope 1 and scope 2 emissions by 42% by 2030 compared to baseline year 2020. The netzero targets were validated and approved by SBTi.1
Scope 1 emissions due to the car fleet increased significantly due to an improved calculation method that takes into account primary data, i.e. actual kilometres driven instead of estimated kilometres driven.WDP already implemented a car policy in early 2022 where only hybrid or full-electric company cars can be chosen.Moreover, this car policy will be further tightened and scaled up to only use full-electric company vehicles as of 2025. We believe this choice will allow us to achieve the target of a net-zero car park by 2030.
“Lead by example
“More insights1 The validation process by SBTi considers WDP to be a small or medium-sized enterprise (<500 employees), so only the scope 1 and 2 targets can be validated. The WDP Climate Action Plan also includes a net zero target for scope 3, also defined in line with these Science Based Targets.
In 2022, we continued to work on refining our methodology and switched to data from the EcoVent database. This is a widely recognised and reliable source for emission factors internationally. These new data influence the CO2 intensity of our projects, which is reflected in a 23% increase in the CO2 intensity of our new development projects. We saw a 22% decrease for our solar projects.
WDP completed 27 new development projects and 15 new solar panel parks in 2022. This is markedly more than in previous years and largely explains the overall increase in embodied carbon. Only two renovation projects took place in 2022, each on a small scale. Thus, renovations are a marginal part of the 2022 embodied carbon.
Current analysis tells us that the use of concrete and PIR panels (rigid foam for insulation) are high contributors to our climate footprint for the new development projects, just like the construction of the roads and infrastructure around the properties. In renovations, it is mainly the contribution of the PIR panels that has a significant impact on our climate
footprint. We will prioritise our attention to this in our search for alternative building materials. Moreover, WDP has open job vacancies intended to address this issue in a structured manner. We are convinced that further exploration of the supply chain can lead to improving our footprint. To this end, we will also focus on the minimal use of rare earth materials and recycling in the chain.
Solar projects accounted for a quarter of total embodied carbon in 2022 (18 MWp was added), a figure that will increase sharply in 2023 given our ambitions to roll out 250 MWp by 2025. Thus, choosing sustainable materials for these projects is also high on the agenda.
In the coming years, WDP plans to further commit to using primary data to tackle the current need for extrapolation. This requires precise data management to further improve, process, interpret and automate data from new construction and solar projects.
Most new development projects took place in the Netherlands (52%), which accounts for 44% of embodied carbon linked to new development projects. The projects with the highest footprint intensity are in Romania and Germany, where 7 projects together account for 52% of the embodied carbon of the new development projects of 2022.
In Gelsenkirchen, a BREEAM In-Use Outstanding project was developed with high standards for energy efficiency and sustainability. Unfortunately, building such advanced projects today leads to higher embodied carbon due to the intense use of materials, such as insulation.
“Improved data management
Total emissions linked to our clients' energy consumption amounted to 68,719 T CO2e equivalent in 2022 (with a 78% coverage). If we extrapolate this to the entire portfolio (coverage 100%), this equates to emissions of 87,677 T CO2e. This is a 5% decrease compared to the extrapolated value for 2021.
The key product that WDP can offer its clients to reduce their GHG emissions is locally produced green electricity from the solar panels on the roofs of our property portfolio. Clearly, this is an indispensable piece of the puzzle in WDP’s decarbonisation exercise given that our clients’ electricity consumption is likely to increase (due to rising electrification, heat pumps and electric (freight) cars).
By 2022, our solar panel installations delivered 33,292 MWh of energy (out of the total 106,823 MWh of renewable energy produced) directly on-site to our clients. This corresponds to about 12% of the total electricity demand of all clients (including the consumption by properties that do not have solar panels today). We hope to double that figure after 2023 in keeping with the growth ambition for our solar park.
The aforementioned local production corresponds to more than 8,423 T CO2e avoided scope 1 and 2 emissions from our clients and our own downstream scope 3. The GHG intensity (location-based) of our property portfolio would have been about 10% higher without these solar panel parks (taking into account a calculation based on absolute figures).
WDP wants to further commit to supporting its clients reduce their (energy-linked) emissions on-site. Using nanoGrid, we can do a portfolio-wide analysis that enables WDP to provide targeted improvement proposals tailored to the client substantiated by results achieved at similar sites. We wish to use intelligent notifications in the MyWDP client portal, so clients are more quickly informed of atypical consumption in their building. This will allow them to take more targeted action and avoid additional utility costs. Moreover, we will work on raising awareness by developing an energy and emissions dashboard. Our clients can display the dashboard at strategic locations in their buildings for their staff, clients and suppliers. This is how we create impact within our entire value chain.
In 2022, we conducted a client survey on the use of green or grey electricity (or a mix) at the sites where WDP does not purchase the energy itself (tenant obtained electricity). This allowed some of the contracts deemed grey last year to be correctly catalogued as green. Overall, 35% of measured electricity consumption comes from renewable energy sources.
In WDP’s Climate Action Plan, we set a target to have 100% green electricity contracts by the end of 2023 for that part of the property portfolio for which WDP concludes the electricity contracts directly (instead of the client). This part of WDP represents an estimated 38% of the total measured energy needs of clients (based on the extrapolated total consumption of our clients). We made material progress in 2022 and have already reached 90%. In 2023, we also continue to work towards 100% green electricity contracts.
We want the actions and pathways outlined in the Climate Action Plan to further future-proof our property portfolio and solar panel installations, while taking into account climate change and the ambitious objectives of the EU Green Deal. In 2022 – partly driven by the macroeconomic (energy) crisis – we focused on launching WDP ENERGY to produce locally produced green solar energy and raising awareness among our clients.
Nevertheless, we will also continue to focus in the coming years on topics, such as biodiversity, waste management and water management, in our new development projects and renovations as well as in the solar projects we implement. Moreover, we strive to achieve a maximum reduction in embodied carbon, especially those arising from developments, new solar panels, and renovations: net-zero by 2050 (scope 3 – capital goods). We will do this by using sustainable materials with a circular life cycle. For both building and energy projects, we seek to minimise the use of rare earths and opt for low-carbon insulation, concrete, and steel. To this end, we will also define a company-wide approach in the context of carbon removal projects.
We also recognise the importance of further developing and implementing an environmental management system to help ensure WDP’s systematic approach to its environmental management.
Our clients have also changed their behaviour due to the global energy crisis. For example, they reduced their energy use for heating on average by 38% or more (15% in the like-for-like scope). This puts them in line with the European target of consuming 15% less gas.1 Note that 2022 was a significantly warmer year than 2021. When calculating heating degree days (HDD) for 2022 and 2021, the recent year had a 17% reduction in the heating requirements for buildings, as calculated between average outdoor temperatures and an indoor temperature of 15 degrees. As a result, we see a 5% decrease in GHG emissions (like-for-like scope).
1 See press release Council EU of 5 august 2022.
The 24/7 consumer expects fast and flexible delivery and a wide product range. This requires adjustments to the logistics network.
BREEAM-certified Home Shop Centre
Barendrecht, the Netherlands
Customer Ahold Delhaize (Albert Heijn)
Lettable area 27,000 m²
Automation to improve efficiency and increase customer satisfaction
Investment budget 24 million euros
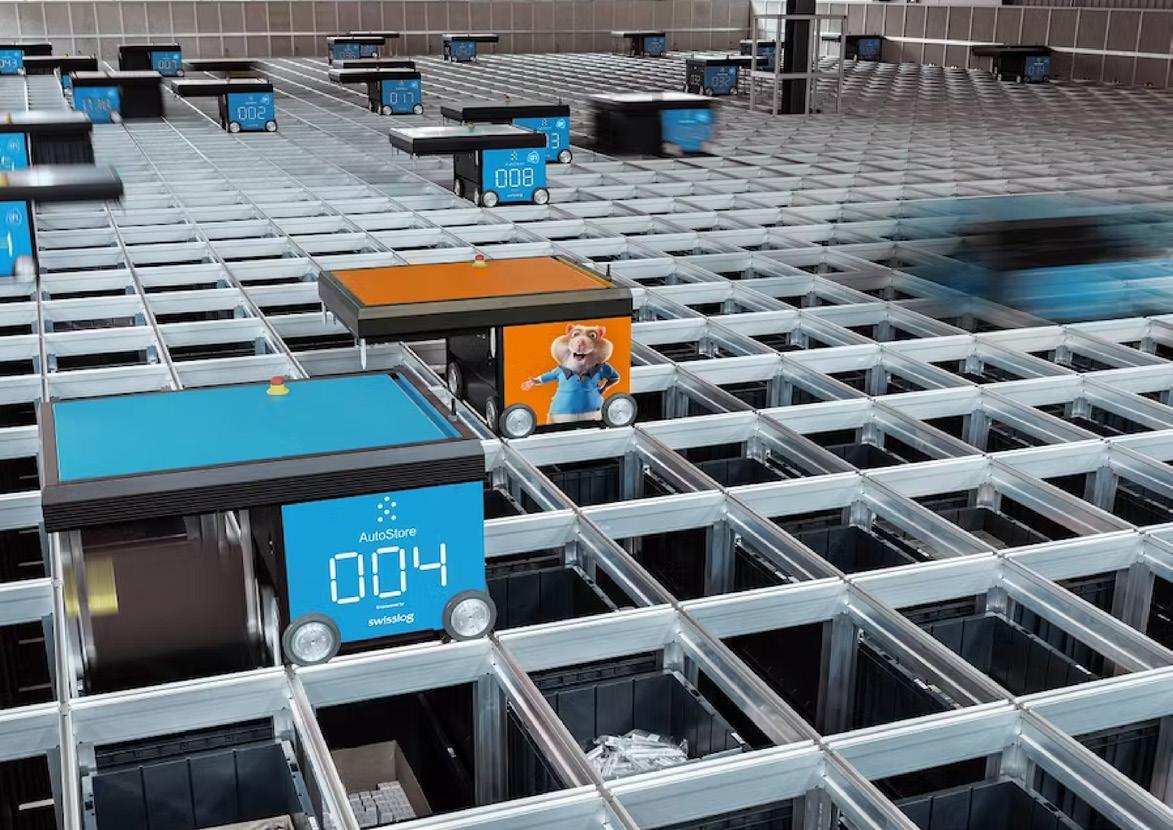
E-commerce remains one of the main growth drivers of the logistics property sector. Companies must switch quickly to online shopping, which is driven by digitisation and an omnichannel approach. This is because consumers, regardless of distance, expect quick deliveries of purchased products, flexible returns, and an extensive online assortment. This omnichannel service requires a different type of warehouse. The warehouse of the future is not merely a location for the storage and distribution of goods. It is a crucial link in the supply chain. Its layout – with intelligent robotics – and its strategic location offered by WDP – that reduces transport time – reduces delivery costs and increased service to the end customer. Transport costs account for over 50% of the total supply chain cost with rental costs at about 5%.
1 Talent attraction, retention & development
1 Employee diversity & inclusion
1 Occupational health, safety & well-being
1 Local community involvement Accomplishments in 2022
#TeamWDP is the driving force behind our value creation. Accordingly, we actively commit to the well-being, safety, and development of our staff. We strive to ensure our activities have a positive impact on the immediate surroundings and contribute to the needs of the local communities.the needs of the local communities.
This value pillar allows us to respond to the following key risks:
Human capital see pp. 158
Supply chain see pp. 158
1,847 € 39 hours
Support for training programmes that are in line with the WDP vision.
78 %
#WeAreConscious
The monitoring of utilities to contribute to the sustainable operational management for our clients through insight into their energy consumption.
55,000 €
#WeCare
Financial and/or material support to local projects and vulnerable groups.
183,000 €
MaatWERKbedrijf BWB can avail themselves of financially favourable lease terms. That way, WDP supports this company that offers employment to people with disabilities.
90% ESG Objectives
The individual short-term targets for each employee include at least one ESGrelated target. The entire #TeamWDP achieved 90% of the total of these ESG targets.

Quick links
Stakeholder engagement 2022 see pp. 63
Responsibilities and decision-making process see pp. 64
Grievance mechanism see pp. 30, 137
#WeMakeADifference
Diversity Policy
Code of Ethics
Human Rights Policy
Employee Code of Conduct
#HealthyAndSafe Statement
HSES Corporate Action Plan
#SpeakUp
AMBITION 2023 Support and guidance for at least 100 students
AMBITION 2025 100% coverage energy monitoring system
>90 %
ESG targets
AMBITION 2023
Employee satisfaction & engagement
8 /10
Satisfaction score
Employee engagement survey
AMBITION 2023 Survey for #TeamWDP by an external partner
AMBITION 2023 Further development of #TeamWDP
AMBITION 2024 Existing HR processes will be mapped. The initial focus will entail digitising processes, such as onboarding, appraisal interviews, training and objectives.

Annual audit
AMBITION 2023 For existing WDP properties, projects or offices
Psychosocial risk analysis
AMBITION 2023 Analysis in preparation of an action plan
#TeamWDP saw a substantial expansion in 2022: 26 employees were recruited, which represents a 24% increase in headcount. This growth necessitates further professionalisation of our HR department.
As a growing organisation, the right talent needs to be attracted and integrated within the company and its corporate culture. Only in this way the future resilience of WDP Group can be guaranteed, the resilience of the company will be increased and growth can continuously be facilitated. A good mixture of different talents, cultures and personalities is of the utmost importance. WDP is looking for staff with the right skills that best fit the company culture and activities, with due regard to objective selection procedures and diversity. Our recruitment and selection process is fully aligned with WDP’s Diversity Policy, Code of Ethics, and Human Rights Policy
From
7.7 /10
Overall average satisfaction score
Employee engagement
Employee engagement and commitment 8.1/10
The family atmosphere within the company ensures that staff are regarded as individuals and are not purely seen in terms of their professional performance. It is vital that everyone on the team feels good and valued and has space to deploy their talents. WDP employees receive leeway for their own initiative, and management does its utmost to feed and stimulate the ideas of its people, rather than pushing through top-down decisions. The innovative, flat organisational structure ensures a continuous dynamic and fosters involvement, responsibility and ownership.
In 2023, further efforts will be made with employer branding to highlight WDP as an attractive employer through website, LinkedIn, and communication initiatives about WDP on the labour market.
A brief but thorough selection process, clear information and attention for the right match are the basis of successful recruitment.
The onboarding procedure wishes to provide close understanding to the business of WDP:

1 a comprehensive welcome, a well-equipped workplace and the right tools;
1 an onboarding package for each new employee with attention for the Employee Code of Conduct;
1 allocation of a mentor for each new employee to show them around the company informally;
1 personal introductory sessions with colleagues from all departments, including a meeting with the compliance officer to explain and formally acquaint them with the WDP policies (e.g. Dealing Code, Employee Code of Conduct, #SpeakUp procedure);
1 a visit to a construction site and/or a visit to clients together with one of the project managers or property managers; and
1 feedback interviews on the quality of the onboarding after one month and six months with the HR manager.
By 2022, WDP will have reached the milestone of more than 100 employees across regions. In fact, #TeamWDP has expanded considerably throughout the year. Besides numerous recruitments based on the company’s growth, we increased the number of managerial positions with the implementation of ‘Heads of’ positions. This staff reinforcement will help us to achieve the objectives of WDP’s ambitious growth plan 2022-25 and respond to new challenges and opportunities.
It is now crucial to safeguard everyone’s commitment to WDP. A contribution to this will be the rolling out the HR Roadmap and developing a programme across #TeamWDP around collaboration, ownership and intrapreneurship in 2023.
Ownership, intrapreneurship, creativity, and innovation embedded in #TeamWDP
WDP applies a remuneration policy that is based on three principles: straightforward, transparent and in keeping with the corporate strategy. As is the case with the remuneration of the members of the Management Committee, the remuneration of employees consists of a fixed and a variable remuneration, if appropriate supplemented with non-statutory benefits such as a company car, a smartphone and group insurance (defined contribution). The concrete interpretation of these three components always depends on, among other things, the position and social status of the person in question, as well as on the local regulations to which the employee is subject to. Obviously, the remuneration is based on the “equal pay for equal work” principle. On an annual basis, WDP compares its remuneration policy with that of other (non)-listed real estate companies and of other nonreal estate companies with of equal size and importance. For this purpose, we are currently using the services of the internationally recognised payment consultant Willis Towers Watson. In this way, WDP can ensure that it is offering its employees marketbased remuneration packages.
Multidisciplinary project groups – the ESG task forces – were established to further develop the ESG objectives. Most of these task forces found their place in the business during 2022. The new materialities matrix led to the outlining of a longer-term ESG roadmap for the ESG Business Case Teams, which will further develop the actions of the ESG task forces.
Employees’ variable remuneration consists of:
1 remuneration linked to individual short-term performance targets, at least one of which must be an ESG target; and
1 a fee linked to short-term collective performance targets resulting directly WDP's 2022-25 growth plan. For example, the EPRA Earnings per share, the occupancy rate, and the continued roll-out of the PV project determine amongst others to what extent the collective variable remuneration is granted and paid to the employees; and
1 a fee linked to the collective long-term performance targets in WDP's growth plan 2022-25. These include financial targets such as EPS, occupancy rate, net debt / EBITDA (adj.), as well as non-financial metrics such as targets under the WDP Climate Action Plan, collaboration, ownership and intrapreneurship, etc.
Payment of short-term variable remuneration is made depending on the place of employment, taking into account local legislation and the employee's function and social status: in cash, by the granting of warrants under a warrant plan, via a non-recurring result-related benefit, and/or via a contribution to the group insurance scheme. Payment of the long-term variable remuneration is made in cash and/or through a contribution to the group insurance scheme.
As for the directors and the members of the Management Committee, no share (option) currently exists for WDP employees either.
In principle, all staff are employed on the basis of a permanent employment contract of indefinite duration; a fixed-term contract for temporary replacement is provided in exceptional cases. WDP also offers opportunities of part-time work or adapted employment plans.

The continuous development, growth and motivation of all employees ensure that they feel good within the company and that they can continue to expand their competencies. WDP strives to boost the skills of its employees to facilitate a sustainable team and build capacity and continuity. However, employee development should not be focused purely on the required job-related skills, but also on the development of soft skills. In 2023, we will focus on the digitisation process within HR – the development of a Learning Management System will contribute to further development of our employees.
An employee engagement survey will be drawn up in 2023 with an external partner. Survey results will be communicated, focus groups set up and an action plan rolled out.
Personalised development plans and opportunities for internal mobility promote performance and development of both employees and the company. Individual or collective training (of which 13 hours of mandatory training per FTE and 10 hours of noncompulsory training per FTE) provides for (exchange of) expertise, e.g. via in-house Learn@lunch sessions. Moreover, WDP also provides individual coaching projects to develop specific competencies, both technical and soft skills. Further development workshops are also organised during the annual team day. The objective of the annual team day is to foster overarching cooperation between the countries, strengthen team spirit, inspiring each other and working together as one team on the key topics of the long-term growth plan.
Formal feedback moments are organised annually for all employees with the direct supervisor. In addition to the evaluation and appreciation of the individually performance objectives set individually, this also involves detailed consideration of the performance of the job, the atmosphere in the team, work resources, training and further personal development. Via regular informal consultation moments, everyone is given the opportunity to give or receive additional feedback.

A safe and healthy living and working environment for #TeamWDP, clients, investors, suppliers and the wider community is essential to WDP’s operational management. WDP continues to systematically improve health, physical and mental well-being and safety at work, taking into account specific risks and hazards, within the spirit of WDP’s #HealthyAndSafe
All employees, regardless of their position, are expected to participate in the identification and the prevention of safety and health risks in order to collectively ensure a safe, healthy and carefree working environment for #TeamWDP and all stakeholders. Through the #SpeakUp procedure, everyone has the opportunity to report any irregularities.
After a long period of hybrid and remote working, all staff gathered in Ghent in June for a day of inspiration and team building. Activating workshops led by Vlerick Business School zoomed in on Digitisation and Energy – two key elements to support the 2022-25 growth plan. Our staff were encouraged to share their vision of the strategy and how these actions can be accomplished within these themes driven by creativity and out-of-the-box thinking. Evidently, there was also room for casual relaxation that day in the charming setting of the Ghent city centre.
A psychosocial risk analysis will be organised in 2023. This psychosocial risk analysis identifies domains, such as work organisation, work content, employment conditions, working conditions and interpersonal relationships at work and will determine the focus domains for further actions.
Within WDP Group, there is one prevention advisor and 4 people who have received recognised first-aid training.
The WDP HSES Team, composed of property managers (at least one from each platform), a representative of the project managers, the prevention consultant and the CTO, incrementally rolls out an annual HSES Corporate Action Plan. In 2022, in this context, a new position was created: the Health & Safety Manager, who will have a leading role in implementing and refining the HSES Corporate Action Plan.
In the context of a good work-life balance, WDP supports certain forms of flexible or part-time working. 18% of employees work part-time. 2 employees benefit from an adapted end-of-career employment plan. In Belgium, the Netherlands, Germany and Romania, periods of maternity leave, adoption leave, paternity leave, parental leave, care leave and time credit (in Belgium only) are provided for in law.
Flexible working is allowed using a combination of office work (at least three days a week) or telework.
Every year, staff may avail themselves of the option to get the flu vaccine from the company doctor. 28 employees opted for a flu vaccine in 2022.
From #TeamWDP, the initiatives of the Office Well-being Team and the Move Team contribute to a healthy and sporty atmosphere in the office – and, of course, to team spirit.
WDP employs a corporate citizenship strategy – #WeMakeADifference. This strategy is fully aligned with the WDP corporate strategy and focuses on initiatives in the vicinity of the property portfolio that contribute to the UN Sustainable Development Goals.
The three pillars targeted – #WeCare, #WeAreConscious and #WeEducate – pursue a long-term impact on social initiatives within the local community, sustainable energy consumption by our clients, and support for students and young workers within the logistics real estate market, respectively. See also 4. Performance and trends – Impact by responsibility on pp. 53.
WDP is aware of the impact that property development has on the surrounding environment and strives to minimise the negative impact of its activities on the immediate surroundings. Thus, the Company shows a clear engagement with the local community, both in terms of the impact of its activities and to support local well-being and economic growth. To this end, continuous and mutual dialogue between clients, surrounding area and WDP are paramount. See also Stakeholder engagement on pp. 63.
Last year, #WeCareBE raised 15,000 euros to benefit the non-profit Children’s Cancer Fund. Thanks in part to our fundraising, the Children’s Cancer Fund hosted the first families of a child undergoing cancer treatment in three flats furnished by the non-profit organisation. These flats are offered to them free of charge during their child’s treatment at UZ Leuven to ease the daily commute to and from the hospital.
Our familiarity with the market and pan-European presence allows us to provide creative solutions to our customer’s supply chain challenges
Slatina, Romania
Customer Pirelli
Lettable area 48,000 m²
Nearshoring of production due to the situation in Ukraine brings the total area for Pirelli at this site to approximately 135,000 m2
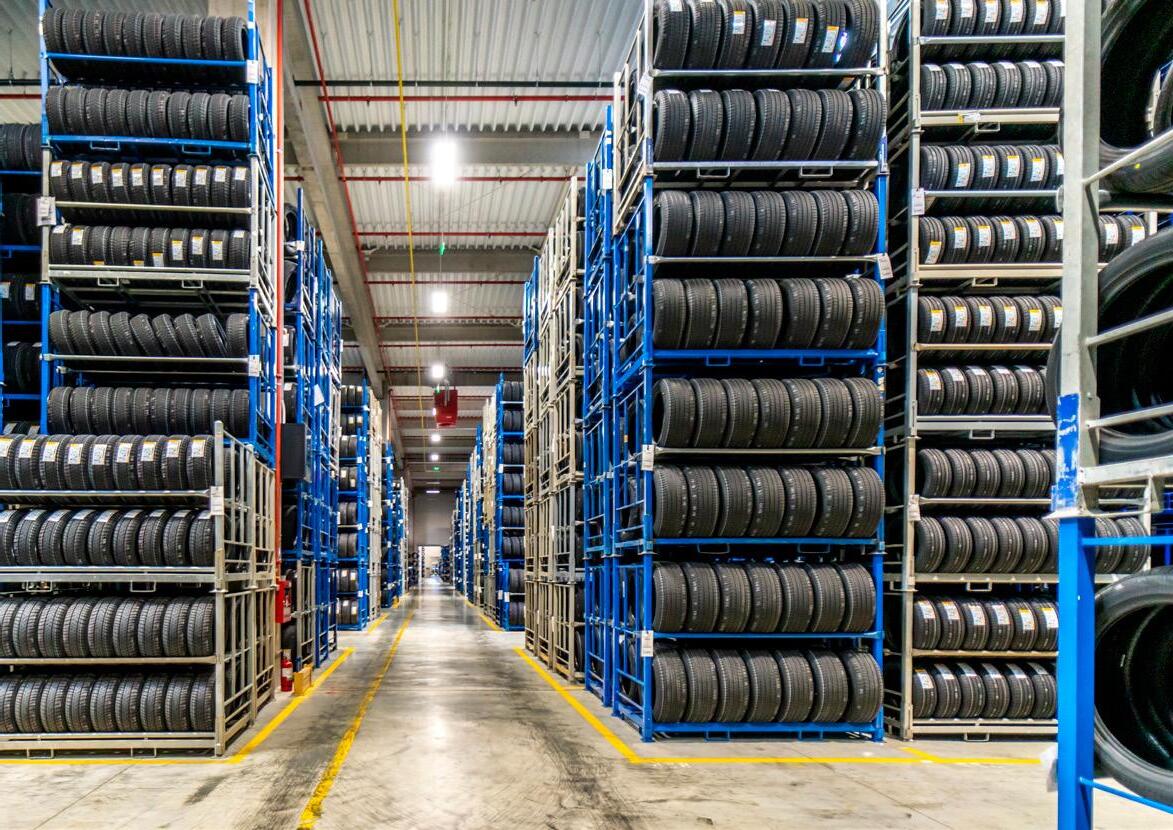
Investment budget 36 million euros
Lease duration 15 years
Unexpected events in global supply chains have highlighted the crucial importance of a flexible and resilient supply chain.
To safeguard future resiliently, supply chain optimisation must continue to gain momentum: investments in automation are increasing, organisations will further diversify their supplier base and production sites but also commit to increased supply chain efficiency. This creates versatility and eases inventory pressure due to improved matching of supplier capacity and consumer demand. Moreover, multimodal transport options are being further developed and distribution is increasingly based on the just-in-case model – accruing a secure strategic stock to avoid stock shortages.
1 Occupational health, safety & well-being
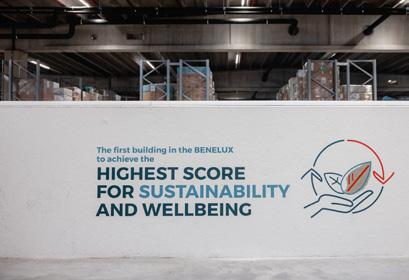
1 Human rights
1 Greenhouse gas emissions
1 Material selection & scarcity Accomplishments in 2022
We are committed to a strong and reliable value chain: from our suppliers, who help shape the core product of WDP to our clients who distribute their goods globally. Our strong relationship with our different business partners ensures we can respond to their wishes and challenges. We contribute to the health, safety, and integrity of their staff. Moreover, we take on our responsibility in terms of risk management in our supply chain, including human rights. This is how we raise WDP’s value creation to a higher level.
This value pillar allows us to respond to the following key risks:
Climate transition see pp. 151
Supply chain see pp. 158
Project developments see pp. 156
our clients
At least the critical suppliers sign this code and thus formally endorse the principles stated therein.
Quick links
Long-term client relationships see pp. 9
#HealthyAndSafe Statement
WDP Supplier Code of Conduct
Human Rights Policy
#WeMakeADifference
Climate Action Plan
Stakeholder engagement 2022 see pp. 63
ESG governance see pp. 64
Grievance mechanism
At least 80% lease renewal
CUSTOMER WELL-BEING
2025 AMBITION The extra services that WDP is developing as part of its growth plan 202225 focus, among other things, on the well-being of our clients and their staff. Customer satisfaction indicator:
Our business strategy is based on long-term partnerships with all stakeholders. Our clients are key to our strategy, and our business partners are essential to achieving our goals.
2023 AMBITION
At least 1 HSES audit
Annual HSES audit for existing WDP premises, projects, or offices.
2023 AMBITION
EXPANSION OF SUPPLY CHAIN MANAGEMENT
2025 AMBITION Further formalisation of supply chain management, taking into account future legal requirements for due diligence in the value chain.
WDP primarily wants to be a partner to its clients, develop a successful long-term relationship with them, and support them in their activities. We listen carefully to clients’ needs and use our expertise and long-standing knowledge of the logistics market and its processes to provide our clients with the most suitable premises at the most suitable location. Long-term leases, high occupancy rate, strong retention, and a high share of repeat business in external growth reflect this strategy. With respect to project development and property management, our clients praise our solution orientation, easy accessibility, flexibility, short lines of communication, and proactive approach.
Our organisational structure is also designed to optimally serve our clients by having a high level of interaction between the different regions in which we operate. For example, we ensure that knowledge is exchanged across borders through international workshops and the weekly meetings by the Management Committee, which includes the three country managers.
Through our digital customer portal MyWDP, we are committed to providing even better service for our clients. MyWDP is the intelligent link between our clients and #TeamWDP, which helps transform real-time data into valuable insights. It is the one-stop shop that provides access to all crucial information about each warehouse in the portfolio and which enables reporting and troubleshooting at the click of a button. The portal couples ease of use with operational efficiency. Clients can access key information on buildings, contracts, invoices, and documents. Problems can be reported instantly, and the WDP manager can easily be contacted. In 2022, we continued to focus on user-friendliness by developing and launching a mobile app version of MyWDP, which is available on the Apple and Google Play Store. Our customer portal is a materialisation of how WDP innovates and digitises with and for its clients.
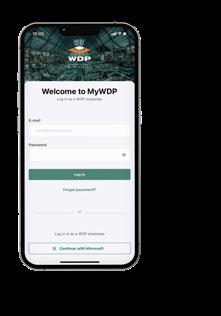
To achieve our goals, we depend on a strong network of business partners, suppliers of materials, products and services. WDP works every day with construction partners, such as contractors, architects, and engineering firms as well as with specialist consultants and financial partners.
Also in this selection, WDP aims for a long-term partnership rather than a one-off collaboration. Such relationship of trust guarantees quality, continuity and pro-activity in the development of projects and execution of renovations, ensures high-quality customer service and establishes a continuous exchange of knowledge and best practices. In principle, WDP chooses partners with relevant experience (e.g. construction partners who are familiar with the logistics development sector and have a long and solid track record). WDP cooperates with financially and operationally sound suppliers and, if applicable, selects partners with experience in the field of guarantees (e.g. 10-year construction guarantee) and financial guarantees. WDP screens its potential partners in advance and not just from a financial point of view, but also on their operations quality, reputation and track record in terms of customers, operations, safety regulations and corporate social responsibility.
When developing new-build warehouses or implementing energy measures, continuous vigilance and adequate precautions that ensure the health and safety of all involved parties within the construction process are top priority. Everyone’s working environment must comply with the relevant health and safety regulations and WDP’s #HealthyAndSafe Statement. The annually revised HSES Corporate Action Plan, developed by the WDP HSES Team entails a thorough analysis of the working environment for all stakeholders, formulates possible improvement actions, and ensures the realisation of an annual external audit. The well-being of our clients and their employees in our buildings also forms one of the pillars of the additional services WDP is developing as part of its 2022-25 growth plan. Through awareness campaigns, we aim to keep HSES high on the agenda of all stakeholders.
The WDP Supplier Code of Conduct pays attention to both health and safety and human rights. Based on an internal risk assessment of business, social and environmental risks a selection of suppliers is asked to formally adopt and comply with this code via signature, while the principles of this code are recommended to all other suppliers. As clearly stated in the code, WDP intends to take further steps with suppliers through cooperation, dialogue, and support to ensure compliance with the principles. Therefore WDP invests heavily in its close contact with suppliers while they are performing their services (whether or not on the construction site). Among other things, we monitor suppliers through the visits of our project managers on site during the construction of a project development. The topics of health and safety and code compliance are also monitored during the project site meetings.
The WDP Grievance Mechanism allows staff, clients, suppliers and all stakeholders to formally report concerns or breaches in the workplace.
As a crucial link in the supply chain, respect for human rights in our own operations or by suppliers and clients is of prime importance. WDP strives for a zero exposure to human rights risks and has formally reflected its commitment in its Human Rights Policy. These risks are tracked through robust due diligence embedded in the WDP risk management policy.
In the upstream of our operations, we are vigilant in our choice of materials. There plays again the respect for human rights and health, as well as the possible negative impact certain materials have on ecosystems or biodiversity. In the design phase of a project, sustainable materials should be chosen, both in terms of how they are created, how they are transported as well as the impact of their production on water use, emissions or possible pollution. These materials should be implemented as efficiently as possible, considering their sustainability and recyclability. The measures contained in the Supplier Code of Conduct, Human Rights Policy and Climate Action Plan should be respected by all stakeholders.
Driven by the EU Green Deal and our ambitious goal to have net-zero energy consumption at our premises by 2040, we will focus even more actively on our partnerships with clients to further improve their sustainability awareness and performance.
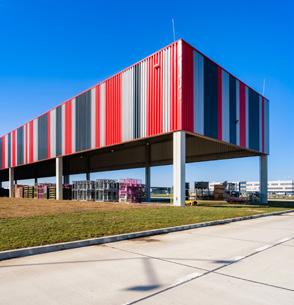
The digital customer portal and MyWDP mobile app give our customers an insight into their energy consumption through real-time energy monitoring. In this way, our client is perfectly aware of his utility consumption and can use this data as the basis for his sustainability strategy. Moreover, this energy monitoring forms one of the pillars of WDP's corporate citizenship strategy: via #WeAreConscious WDP wants to encourage each customer to be more energy-conscious. Via concrete data, we enter into dialogue to jointly reduce the energy consumption of their activities and make our real estate portfolio more sustainable. In this way, we influence a reduction in CO2 in terms of scope 3 downstream leased assets.
Our contribution to climate goals goes beyond our own activities upstream and downstream. We also involve the wider community in our decarbonisation strategy. For example, the energy generation and infrastructure of the Green Mobility Hubs (which help clients electrify and decarbonise their operations – see above 4. Performance and trends – Future Logistics), also allow external users to use the green energy generated via public charge stations.
In the long term, WDP wants to organise its supply chain so that operational, financial, reputation and sustainability requirements receive the necessary attention at all levels. In other words, a management system that makes it possible to respond to opportunities within that supply chain and mitigate risks effectively. To this end, we need to prepare a roadmap by 2025 that facilitates a uniform approach across the entire WDP Group.
“
The materiality matrix is our compass for effective management and value creation. Our guide on the path of ESG.
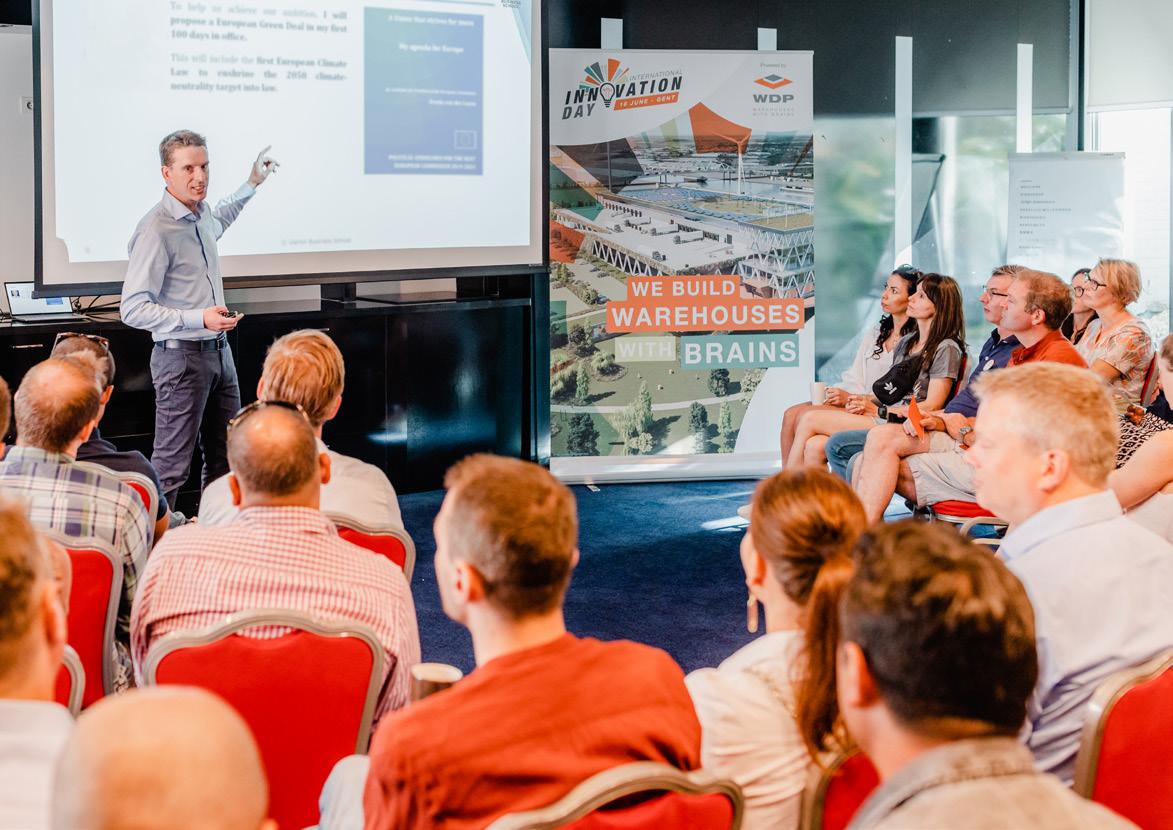
A materiality analysis is the foundation for drawing up a corporate sustainability approach that identifies and prioritises the most relevant topics for our company and its business model. This analysis takes into account the views of our stakeholders regarding WDP’s role for the community and the environment. This allows us to focus on and draw up actions related to those materialities in our strategy, so we can make a difference and have a positive impact on people, the environment and society. Materialities are the compass for effective management and value creation.

The frequency with which a materiality analysis is carried out depends on changes in the immediate environment, macroeconomic or internal changes and (natural) evolutions at the company level.

In our strategy, we focus on the materialities where we can have an impact and that were confirmed by our stakeholders.
During 2022, WDP carried out a materiality analysis to evaluate and, if necessary, adjust its environmental, social and governance priorities. This exercise is based on the “double materiality” approach, which considers both the financial and social impact on materialities. After identifying 14 relevant sustainable themes, stakeholders were
consulted to discover their priorities concerning these themes as well as the financial impact of these themes on our company and the impact WDP can have on society and the environment based on these themes. These insights were used to prioritise the themes represented in a materiality matrix. This is the foundation for WDP’s further evolution concerning ESG.
1 Identify sustainability themes potentially relevant to WDP.
1 Take into account relevant ESG benchmarks, reporting standards, sector reports, a peer study and the European regulations.
1 So, 230 potentially important themes were retained, evaluated and combined into a draft list of 17 themes.
1 An impact assessment examined the actual, potential, positive and negative impacts on and of these themes. The assessment took into account the relevant risks and probabilities of success.
1 Final selection of 14 material topics.
Stakeholder panel: Customer. #TeamWDP, Investors –Financiers – Shareholders – Third-party benchmarks – Analysts, Suppliers, Policymakers, Community
1 Internal and external stakeholders were probed on the relevance of these 14 materialities through active workshops.
1 The importance these stakeholders attached to the different materialities was consolidated in the vertical axis of the materiality matrix (weighted average).
Internal workshop: Management Committee, Representatives of critical business functions
1 An internal workshop polled the impact of materialities. It also took into account the risks and opportunities. Materialities were then ranked according to the magnitude of their impact.
1 Assessment from two perspectives (double materiality): the financial impact perspective (outside-in impact) or the impact of the 14 materialities on WDP’s business and the social impact perspective (inside-out impact) or the impact of WDP’s business on the 14 materialities.
1 Reporting the company’s impact on the environment and society cf. GRI: the materiality matrix provides a consolidated ranking from the inside-out perspective (the horizontal axis).
1 The matrix ranks materialities according to priority.
1 Changes from the 2018 materiality matrix:
1 most materialities are preserved, although prioritised differently
1 four new materialities were added, two were removed and two were merged into one theme
1 the designation and description of materialities were adjusted where necessary
1 This matrix was approved by the WDP Board of Directors.
Transformative priorities
Materialities essential for long-term value creation and competitive strength in line with societal megatrends
Continuous themes for tightening up ESG Materialities actively monitored for compliance purposes and risk mitigation
Energy efficiency
Climate change adaptation
Greenhouse gas emissions
Local community involvement
Sustainability enablers
Materialities that enable the company to effectively address the main themes on which WDP focuses
Corporate governance & business ethics
Talent attraction, retention & development
Land use
Human rights
Employee diversity & inclusion
Material selection & scarcity
Waste management
Water conservation
Biodiversity
Occupational health, safety & well-being Business
Alleviate climate change by decarbonising our business and reducing our direct and indirect greenhouse gas emissions, both by purchasing green power and expanding our renewable energy generation capacity.
Efficient energy consumption in our own operations and those of our customers using an energy monitoring system, insulation, LED lighting and increased in-house off-grid power generation.
Adapt business strategy and investments to the identified risks and opportunities due to climate change, thus ensuring long-term business continuity.
Good governance that effectively manages sustainability risks and impacts. Further strengthen the company culture that prioritises integrity, such that acting ethically is paramount and prevents corruption, insider trading and code of conduct violations.
Efficient land use that alleviates increasing pressure on available land, as well as the allocation of existing land as green space and recreational opportunities for customer staff.
Safeguard the health and safety of our staff, contractors and customers to prevent workplace injuries and fatal accidents while taking into account both the physical and mental wellbeing of staff.
Safe discharge of waste water, protection of water sources and efficient water use during construction and operating activities.
Minimisation of waste, mainly during the construction phase, and responsible waste disposal.
Enhanced local biodiversity on and around the sites to increase ecosystem resilience. Protection of soil, water resources and forests.
Respecting human rights in our own operations, and expecting our suppliers and customers to also adhere to human rights standards. This includes – but is not limited to – forced labour, child labour and freedom of association.
Offer an attractive work environment and training opportunities to recruit, retain and engage staff and reduce turnover. Train and develop staff to ensure they have the necessary skills to grow the business.
We are committed to an ongoing dialogue with the local community and regulatory authorities to assess how they are impacted by project developments and to safeguard a net positive contribution of the sites to local residents.
Efficient use of materials whose life cycle has the least possible impact on the environment and health. We contribute to the circular economy with the recovery and recycling of materials when demolishing or renovating buildings.
A diversified team of staff at all levels who feel supported and included in the company. Discrimination and harassment in any form whatsoever must be prevented and everyone must have equal opportunities and equal pay for the same work.
WDP aims to contribute to those Sustainable Development Goals that are deemed most relevant to the company and its operations.
WDP ENERGY aims to respond to the accelerated and evolving customer energy needs to ensure its sites are more self-sufficient and decarbonised by increasing the use of green energy production and technology.
Profitable growth relies on a business plan focused on climate transition and energy efficiency and backed by a diverse and talented team acting respectfully within a safe and healthy work environment.
Energy efficiency
Land use
Human rights
WDP has set specific targets for the reduction of CO2 emissions and intends to transition to climate-neutral operations (Scope 1, 2, and 3) by 2050. By focusing on its entire value chain, WDP can take effective action on climate change.
Greenhouse gas emissions
Energy efficiency
WDP seeks to improve the personal and professional development of its staff by means of general and individual training and personalised development plans.
Occupational health, safety & well-being
Water conservation
Material selection & scarcity
Employee diversity & inclusion
Greenhouse gas emissions
Climate change adaptation
Talent attraction, retention & development
In its day-to-day operations, WDP takes into account its impact on the environment. The development of our infrastructure is based on maximum efficient land use and zero negative impact on the environment, for example through continuous and open dialogue with all stakeholders.
Land use
Local community involvement
The reduction of CO2 emissions and waste are key concerns in the execution of our activities, including our attentiveness to biodiversity.
Waste management
Biodiversity
Material selection & scarcity
We achieve our objectives by depending on a strong network of business partners. Our activities bring us into contact with numerous stakeholders that we categorised into the categories below. These are listed along with their expectations and how these are met by WDP. We validate these stakeholder groups on a regular basis. Most recently,
Expectation
1 Real estate as a crucial link in its supply chain with a focus on well-being, safety, the environment, and energy efficiency.
Engagement
1 Contemporary and future-oriented Warehouses with brains – logistics real estate in all of its facets, including the infrastructure for improved energy efficiency and reduced CO2 emissions.
Engagement in 2022
1 50% repeat business
Expectation
1 Pleasant working framework to support creativity, well-being, and motivation within a context of ethical and proper business operations.
Engagement
1 Company culture that ensures personal development, open communication and well-being, and facilitates creativity and innovation.
Engagement in 2022
1 7.7/10 average employee satisfaction score
Expectation
1 Long-term business model with clear targets and strategy that guarantees value creation and profit generation within a context of sustainable operations and transparency.
Engagement
1 A long-term business plan with quantified targets that prioritises growth and sustainability and communicates progress via different channels.
Engagement in 2022
1 Profitable growth aligned with targets within the business plan
1 Stringent capital discipline
1 Benchmark performance DJSI, MCSI, ISS ESG and CDP
we tested these ahead of the new materiality matrix in 2022. Before engaging in the stakeholder panels, a Stakeholder Salience Model was analysed that contrasted Power, Urgency and Legitimacy for each stakeholder group.
Expectation
1 A reliable and long-term partnership that assures proper business dealings and safety, and facilitates collaboration on energy efficiency and sustainable solutions.
Engagement
1 Collaboration based on clear agreements and interaction.
Engagement in 2022
1 Supplier Code of Conduct
1 Collaboration with a permanent pool of suppliers
Expectation
1 Knowledge and compliance with prevailing regulations and a contribution to the EU Green Deal objectives.
Engagement
1 Continuous monitoring and compliance with prevailing regulations and a clear strategy based on EU Green Deal objectives.
Engagement in 2022
1 27 building applications were submitted.
1 Proactive consultation with competent authorities and regulator
Expectation
1 Minimal negative impact of activities on the immediate surrounding area and land use. Clear engagement with the local community, both concerning the impact of activities and to support local well-being and economic growth.
Engagement
1 Continuous and mutual dialogue between customer, community, and WDP.
1 Clear corporate citizenship targets.
Engagement in 2022
1 27 building applications were submitted
1 39 hours of support by #TeamWDP to train students
1 55,000 euros for charity and favourable rental conditions for a company offering social employment
ESG is fully embedded in the company’s day-to-day organisation and governance structure with clear roles and responsibilities assigned to the relevant teams and governing bodies. The continuous interaction between the different levels that unifies a top-down and bottom-up approach is inherent in this governance structure.
We refer to 8. Corporate Governance Statement for more information the role, responsibilities, and composition of the Board of Directors, the ESG Committee, and the Management Committee, and also for the risk management policy applicable within WDP.
1 Approve the proposed ESG strategy (including targets and commitments).
1 Monitor the ESG strategy implementation, risks, and opportunities.
1 Acts as a liaison between the ESG team and the Board of Directors.
1 Ensures information and education on ESG-related issues is propagated upstream.
1 Advises the Board of Directors – and if applicable, the Audit Committee – about ESG subjects and formulates proposals, recommendations, and reports on these topics, such as target setting, assessment of non-financial information, or information required by prevailing legislation with regard to ESG, ESG risks, and opportunities to the Audit Committee and the Board of Directors.
1 Aligns the various operational initiatives and the ESG strategy.
1 Submits proposals for the ESG strategy (including targets and commitments) to the ESG Committee based on input from the ESG team.
1 It is responsible for the continuous evaluation of the ESG strategy and for monitoring its implementation.
1 It is also responsible for the follow-up and monitoring of ESG risks and opportunities.
1 Forum for the development of the ESG strategy (including objectives and commitments) to be approved by the Management Committee and Board of Directors.
1 Ensures coordination in full and necessary interaction between the environmental, social, and governance tracks.
1 Ensures that the information, non-financial or otherwise, required by prevailing ESG legislation is prepared (and reported) to both internal and external stakeholders.
1 Monitors the progress of ESG strategy implementation.
1 Composition: Head of Energy & Sustainability, Head of Human Resources, General Counsel, Investor Relations.
1 Quarterly meetings.
1 Is responsible for implementing the ESG strategy.
1 An integrated approach is guaranteed by dedicated interdepartmental working groups focused on specific ESG themes. This is how we make the most of the knowledge of our specialist staff and also ensure ownership of the initiatives and the planned targets.
“ The agile nature of #TeamWDP and our increased focus on sustainable earnings growth ensures we continue to put shareholder value first within this volatile environment with a sharply increased cost of capital.
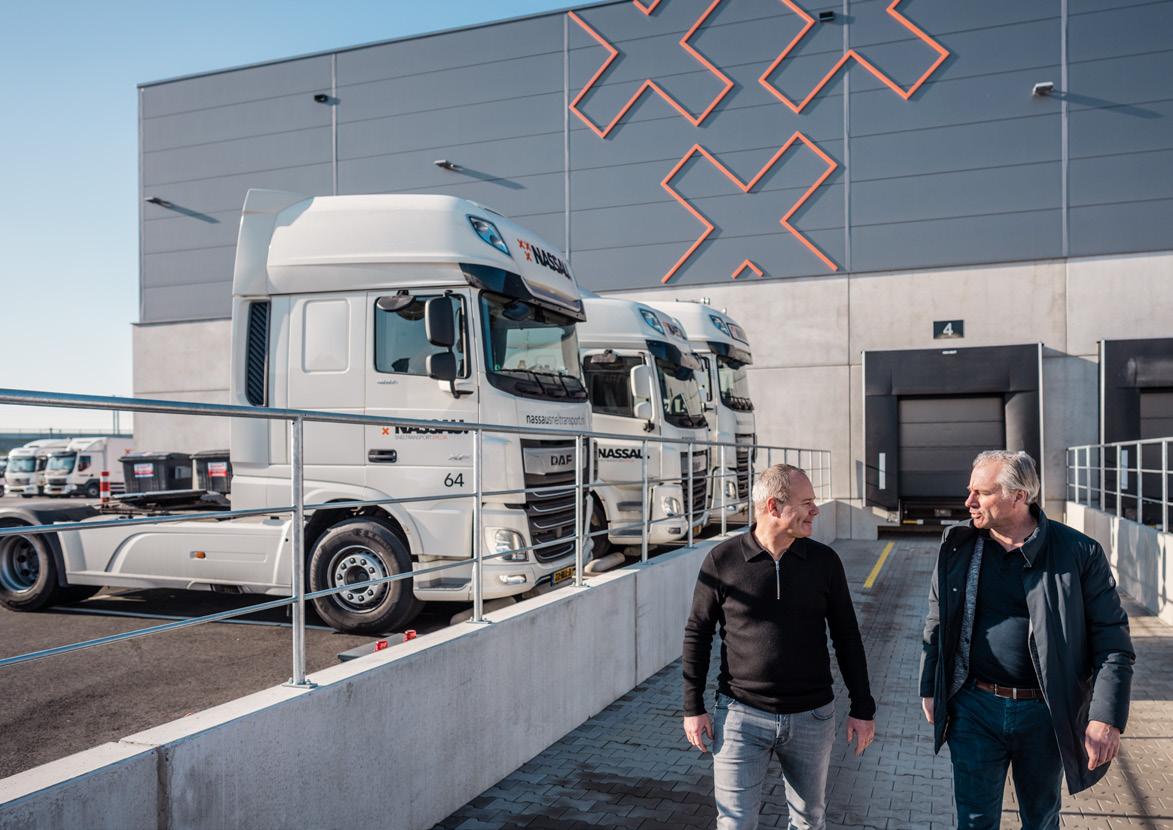
By emphasising the creation of long-term recurrent cash flows, in combination with the high earnings disbursement obligation, a GVV/SIR such as WDP provides investors with a fully-fledged, profitable, liquid alternative to direct ownership of property. In this respect, WDP was once again able to build on its reputation and traditional strengths. First of all, it is important that potential investors and shareholders appreciate the added value that WDP offers. This includes our market leadership in logistics and semi-industrial real estate in the Benelux and Romania and the high degree of stability in generated earnings, combined with our growth plan. In addition, WDP is a self-managed company, with management conducted in-house for the sole benefit of our shareholders and other stakeholders. Due to the scale of its property portfolio, WDP provides shareholders with a substantial economy of scale in well-defined regions as well as significant diversification. WDP’s policy is geared towards having the dividend track its EPRA earnings per share.
EURONEXT Brussels and Amsterdam

IPO: 28/06/1999

Listing: continuous ISIN code: BE0974349814
Liquidity provider: Kempen & Co and KBC Securities
The Alternative Performance Measures (APM), used by WDP, are accompanied by a symbol ( ). The definition and reconciliation can be consulted in chapter 10. Reporting according to recognised standards and chapter 12. AnnexesAlternative performance measures
1 The number of shares traded divided by the total number of free float shares at the end of the year.
2 IFRS NAV: the IFRS NAV is calculated as shareholder equity as per IFRS divided by the number of dividend-entitled shares on the balance sheet date. It pertains to the net value per share of the public GVV/SIR according to GVV/SIR legislation.
3 On the basis of the pro-rata-temporis basis for the weighted average number of shares over the period.
4 On the basis of the number of shares entitled to dividend at the end of each period.
The WDP share price evolved in 2022 from 42.2 euros on 31 December 2021 to a closing price on 31 December 2022 of 26.7 euros. This negative evolution is due to some external factors, including market volatility, a weakening macroeconomic outlook, a rising cost of capital and changed credit cycle as well as increased geopolitical tensions.
With its robust balance sheet, strong liquidity position and diversified property portfolio with an inflation-resistant cash flow profile, the total return1 for 2022 of the WDP share was -33.1%, compared to an average return of -36.5% realised in the sector (EPRA index of European real estate shares).
Data provided by EPRA show that WDP – with a total annualised return of +11.0% since the IPO at the end of June 1999 – continues to outperform the index real estate shares in Developed Europe (+5.6%), the index of real estate shares in the eurozone (+6.2%), and index of Belgian real estate shares (+7.0%).
1 The share return over a specific period is equal to the gross yield. This gross yield is the sum of the following components:
- the difference between the share price at the end and at the start of the period;
- the gross dividend (i.e. the dividend before deduction of the withholding tax);
- the gross yield of the dividend received when reinvested in the same share.
WDP remains committed to generating strong cash flows as the basis for an attractive dividend. The company also firmly believes that the quality of the property portfolio and the tenants continues to point towards a strong future. WDP’s dividend policy is based on offering an annual attractive and recurring dividend yield based on a low pay-out rate of 80% and reinvesting the remainder in profitable growth.
The table below shows the share ownership as of 31 December 2022.
WDP achieved an average annual dividend growth of 8.6% over the period 2012-2022 based on strong EPRA earnings per share growth of 9.2%. In 2022, WDP achieved EPRA earnings per share of 1.25 euros (+13% year-on-year) and proposes a gross dividend per share of 1.00 euro (payable in 2023) (up +14% from 0.88 euros per share in 2021). Based on expected EPRA earnings of 1.35 euros per share in 2023 (up +8% from 1.25 euros per share in 2022), a gross dividend per share of 1.08 euros is proposed for 2023 (payable in 2024), based on a comparable increase.
1 The percentage is determined under the assumption that the number of shares has not changed since the most recent declaration of transparency, and taking into account the total number of outstanding shares in WDP.
2 The number of publicly held shares was determined under the assumption that since the declarations of transparency, nothing has changed with regard to the composition of the share portfolio of the shareholders obligated to report major holdings by virtue of the Belgian Law of 2 May 2007 on disclosure of major holdings in issuers whose shares are admitted for trading on a regulated market and with various provisions.
3 On 26 October 2012, the Reference Shareholder, the Jos De Pauw family, assigned all of its shares, held in mutual concert, in joint ownership under the family company structure RTKA, which institutionalised the existing mutual concert. The holders of voting rights are the members of the management body RTKA, to the exclusion of all other right holders in respect to the participation.
WDP also relies on the debt capital market to finance its investment projects. This financing as of 31 December 2022 is shown below:
Financial calendar
12 April 2023 Deadline to register shares for participation in the Annual General Meeting on 26 April 2023
19 April 2023 Announcement of Q1 2023 results
20 April 2023 Deadline to confirm participation in Annual General Meeting on 26 April 2023
26 April 2023 Annual General Meeting on the 2022 financial year
27 April 2023 2022 ex-dividend date
28 April 2023
17 May 2023
28 July 2023
Record date dividend 2022
Payment date 2022 dividend
Publication of HY 2022 results and publication of the Interim Report
18 October 2023 Announcement of Q3 2023 results
26 January 2024 Announcement of 2023 annual results
25 March 2024 Publication of annual report for financial year 2023
24 April 2024 Annual General Meeting on the 2023 financial year
“
Our property portfolio and its property developments are the result of a well-thought-out strategy that makes efficient and maximum use of the available space in accordance with the client’s logistics flow and energy needs.
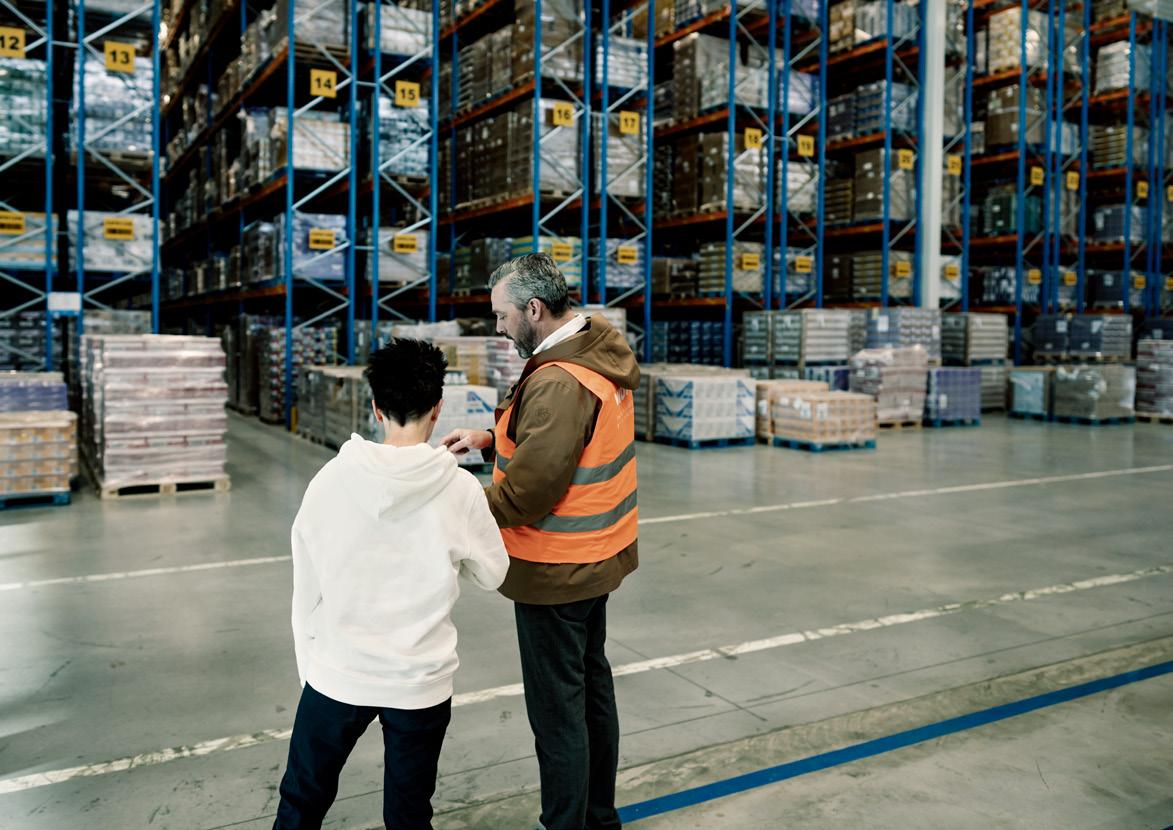
1 The EPRA Key Performance Indicators are listed in Chapter 10 Reporting according to recognised standards provided with their definition and reconciliation.
Share performance
Share price (in euros per share)
EPRA NTA (in euros)
EPRA EPS (in euros per share)
DPS (in euros per share)
236.3 million euros
6.7 billion euros EPRA
99.1 % Occupancy rate
20.7 euros EPRA NTA per share
4.0 %
Like-for-like rental growth
91.3 % Operational margin
5.5 year
Average term of the leases
change in the fair value of financial
Some figures are subject to rounding adjustments. Consequently, it may occur that figures shown as totals in certain tables are not a precise arithmetical totals of foregoing figures.
The Alternative Performance Measures (APM) used by WDP, including the EPRA Key Performance Indicators, are accompanied by a symbol (♦) and are found in Chapter 10. Reporting according to recognised standards and Chapter 12. Appendices – Alternative Performance Measures listing the definition and reconciliation.
2 Defined as operating result (before result on the portfolio), divided by interest charges, minus interest and dividend collection, minus compensation for financial leasing and others.
3 IFRS NAV: Net Asset Value before profit distribution for the current financial year as per the IFRS balance sheet. The IFRS NAV is calculated by dividing the shareholders’ equity as per IFRS by the number of shares entitled to dividend on the balance sheet date.
The property result amounts to 319.6 million euros for 2022, an increase of 14.8% compared to last year (278.4 million euros). This increase is driven by continued portfolio growth in 2021-22, primarily through new pre-let projects. Without changes to the portfolio, rental income levels increased by 4.0% driven by the indexation of leases. As a result of rising inflation, WDP saw this like-for-like rental growth (broken down as 2.0% in Q1, 4.0% in Q2, 4.5% in Q3 and 5.5% in Q4) accelerating throughout the year as leases continued to be indexed.
The property result also includes 22.9 million euros of income from solar panels – compared to 17.8 million euros last year – from higher income due to a higher installed capacity and higher income due to organically higher electricity prices.
Other operating income and expenses include some non-recurring income of approximately 7 million euros.
1 Calculation based on the weighted average number of shares.
2 Calculation based on the number of shares entitled to dividend.
3 The dividend payout ratio is calculated in absolute terms based on the consolidated result. Dividend is distributed based on the statutory result of WDP NV/SA.
The operating result (before result on portfolio) amounts to 291.8 million euros over 2022, up by 15.5% compared to the same period last year (252.6 million euros). The property and other general expenses amount to 27.8 million euros over 2022, up year-on-year, in line with portfolio growth. The operating margin remains high at 91.3%, up from 90.7% in the same period last year.
The financial result (excluding changes in the fair value of financial instruments) amounts to -43.4 million euros over 2022, an increase of 9.0% compared to last year (-39.9 million euros) due to higher average outstanding financial liabilities as well as the significant strengthening of the liquidity position (especially through additional free credit lines). The higher amount was partly compensated by the positive impact of a slightly lower average cost of debt. This financial result includes the recurring expense of -3.0 million euros related to land under concession, which in accordance with IFRS 16 will be accounted for through the Financial result.
Total financial debts (in accordance with IFRS) are 2,401.9 million euros as of 31 December 2022, compared to 2,193.7 euros in the same period last year. The average interest rate is 1.9% over 2022, down 10 basis points compared to the same period in 2021 (2.0%).
The result of 8.7 million euros over 2022, primarily concerns the contribution in connection with the participation in Catena as of Q2 2022 that is recognised in the IFRS accounts via the equity accounting method.
WDP’s EPRA earnings for 2022 amounts to 236.3 million euros. This result marks an increase of 17.4% compared to the result of 201.2 million euros in 2021. The EPRA Earnings per share are up 7.0% year-on-year to 1.25 euros, including an increase of 3.7% in the weighted average number of outstanding shares. This increase in EPRA earnings was mainly driven by pre-let new construction projects and organic growth via the indexation of leases as well by newly realised acquisitions and some non-recurring income.
The sharp rise in interest rates, scarcer and more expensive capital and an uncertain macroeconomic outlook have led to sharply reduced liquidity in the property market. Indeed, the changed price expectation today creates a high bid/ask spread between buyers and sellers and has led to a significantly lower number of transactions in the investment market. On the other hand, there is sufficient interest and capital available for investment in logistics property because of its solid long-term fundamentals. However, the market is searching for a new balance given the new economic parameters. This trend has led to an adjustment in the yields applied by property appraisers as of Q4 2022.
The result on the portfolio (including the share of joint ventures and after tax) – Group share for 2022 amounts to -101.9 million euros or -0.54 euros per share. For the same period last year, this result amounted to +730.5 million euros or +4.00 euro per share. This breaks down by country as follows: Belgium (+41.9 million euros), the Netherlands (-178.0 million euros), France (+2.8 million euros), Romania (+25.9 million euros), Germany (-3.0 million euros), Luxembourg (+6.1 million euros), and Sweden (+2.4 million euros). The result for the Netherlands is negatively impacted by an increase of the registration costs (transfer tax) from 8% to 10.4% as of 1 January 2023, which will be deducted in calculation of the fair value – WDP has recognised this impact of -61 million euros in the accounts as of 31 December 2022 (namely, Q4 2022).
The revaluation of the portfolio (excluding deferred taxes on the portfolio result and the result on sales of investment properties) amounts to -127.3 million euros over 2022, down by -2.0%. This is mainly due to an upward yield shift in the existing portfolio of +50 bps in the discount rates applied by property appraisers and the increase in registration fees in the Netherlands, partly compensated by the increase in estimated market rent values (+11% in 2022), as well as unrealised capital gains on the projects. For the first 9 months of the year, the portfolio result was positive, with a turnaround in Q4 when the portfolio write-down was -407.5 million euros, as the upward yield shift manifested mainly in the last quarter as did the increase in transfer taxes in the Netherlands. Currently, the portfolio is valued at an EPRA NIY of 5.0%, which is +30 bps year-on-year.
Changes in the fair value of financial assets and liabilities – Group share1 amount to 224.6 million euros or 1.19 euros per share for 2022 (versus 52.4 million euros or 0.29 euros per share in 2021). This positive impact is due to the variation of the fair value of the interest rate hedges (Interest Rate Swaps) entered into on 31 December 2022 due to the strong increase in long-term interest rates in the course of 2022.
The fair value variation has no impact on cash and is an unrealised item, so it is excluded from the financial result in the analytical presentation of results and presented separately in the profit and loss account.
The solar panels are valued on the balance sheet at fair value based on the revaluation model in accordance with IAS 16 Tangible fixed assets. In compliance with IAS 16, WDP must include a depreciation component in its IFRS accounts according to the residual service life of the PV systems. The depreciation is calculated based on the fair value from the previous balance sheet date. This newly calculated net book value is subsequently revalued at the fair value. This revaluation is booked directly in the equity capital insofar that it still exceeds the historical cost price, plus accumulated depreciations. If it does not, then it is entered in the profit and loss account. The depreciation component and write-down amounts to -7.2 million euros. Since this impact of the depreciation and amortisation of solar panels involves a non-cash and unrealised item, it is excluded from the operating result in the analytical presentation of the results and is shown separately in the profit and loss account.
The EPRA Earnings along with the result on the portfolio, changes in the fair value of financial instruments and the depreciation and write-down on solar panels produce a net result (IFRS) – Group share for 2022 of 351.7 million euros (compared to the same period last year, when this figure was 982.3 million euros).
The difference between the net result (IFRS) – Group share of 351.7 million euros and the EPRA earnings of 236.3 million euro is mainly due to the positive variation of the fair value of interest rate hedging instruments, partly reduced by the depreciation of the portfolio.
When preparing the profit and loss account, a situation was taken into account as of 1 January 2021 in which WDP could not continue to qualify as FBI in the Netherlands, due to the current significant uncertainty in view of the tax ruling that was revoked as of 1 January 2021, as explained earlier.2
The impact on EPRA earnings is approximately -1 million euros per quarter and on the portfolio results is over 2022 of +41.8 million euros via deferred tax on the property. WDP processes these commissions in its accounts out of a principle of prudence. Given that a tax ruling is not an absolute requirement to be able to apply the FBI regime, and that WDP believes that it meets all the conditions and the circumstances and facts are unchanged, the company will continue to file its tax returns as an FBI.
In the announcement of the Dutch 2023 budget on 20 September 2022, WDP noted the declaration of intent to use a legislative amendment to exclude real estate from the Dutch FBI regime as of 1 January 2024. WDP is disappointed with this chosen path given the previously favourable report by the independent Dutch research institute SEO commissioned by the Dutch Ministry of Finance and given the social and economic contribution that can be made by listed REITs. In response to this report, the Finance Cabinet decided to postpone its entry into force to 1 January 2025.
However, this announcement has no direct impact on WDP because the company took the precaution of assuming a non-FBI scenario in the preparation of its accounts – and thus also for the 2022-25 growth plan. However, for the period prior to 1 January 2025 (specifically 2021-24), the competent authorities in the Netherlands have not yet taken a position. Nevertheless, WDP remains convinced that the company continues to meet all conditions within the current legislative framework and that the facts and circumstances remain unchanged in the period leading up to 1 January 2025 (if the Dutch government follows through with plans to abolish the real estate FBI).
(in
1 Based on 100% of fair value for fully consolidated entities (including WDP Romania) and the proportionate share for joint ventures (notably 55% for Luxembourg and 29% for WDPort of Ghent Big Box).
2 For the method used to calculate the gearing ratio, refer to the Royal Decree of 13 July 2014 on the GVV/SIR.
According to independent property experts Stadim, JLL, Cushman & Wakefield, CBRE and BNP Paribas Real Estate, the fair value3 of the WDP property portfolio as of 31 December 2022 according to IAS 40 amounted to 6,492.1 million euros, compared to 5,894.5 million euros at the start of the financial year (including Assets held for sale). Together with the valuation at fair value of the investments in solar panels4, the total portfolio value amounts to 6,656.0 million euros, compared to 6,054.3 million euros at the end of 2021.
This value of 6,656.0 million euros includes 5,994.0 million euros in completed properties (standing portfolio).5 Ongoing projects represent a value of 297.6 million euros. In addition, there are the land reserves at Genk, Breda, Sint-Katelijne-Waver and Schiphol, and land potential in Romania, representing a fair value of 200.6 million euros.
The investments made in solar panels are valued at a fair value of 163.9 million euros as of 31 December 2022.
Overall, the portfolio is valued at a gross rental yield of 5.7%6. The gross rental yield after deduction of the estimated market rent value for the non-let portions is 5.6%.
The EPRA NTA per share amounted to 20.7 euros as of 31 December 2022. This represents an increase of 0.6 euro (+3%) against an EPRA NTA per share of 20.1 euro on 31 December 2021 as a result of the EPRA earnings generation (+1.25 euro), the strengthening of equity as a result of some contributions in kind and the ABB (+0.28 euro) and the revaluation of the portfolio (including solar panels) (-0.58 euro) and other (+0.54 euro), and after the dividend distribution (-0.88 euro). IFRS NAV per share7 amounts to 20.9 euros as of 31 December 2022 compared to 19.0 euros per 31 December 2021.
3 For the exact valuation method, we refer to the BE-REIT press release of 10 November 2016.
4 Investments in solar panels are valued in accordance with IAS 16 by applying the revaluation model.
5 Including a right of use of 72 million euros, related to the land held through a concession in accordance with IFRS 16.
6 Calculated by dividing the annualised contractual gross (cash) rents and the rental value of the unlet parts by the fair value. The fair value is the value of the investment properties after deduction of transaction costs (mainly transfer tax).
7 The IFRS NAV is calculated as the equity capital as per IFRS divided by the total number of shares entitled to dividend on the balance sheet date. This is the net value according to Belgian GVV/SIR legislation.
In 2022, WDP and its subsidiaries together paid 64.4 million euros in social, fiscal and sector-specific taxes to the treasury.
The financing policy of the WDP Group is geared towards optimal financing of the company with an ideal mix of debt and shareholders’ equity, and the availability of adequate resources to complete ongoing projects and capitalise on any opportunities that arise.
The key objectives within this context are the following:
1 a proactive management of the capital structure;
1 a balance of equity capital and loan capital;
1 a good diversification of the various sources of financing;
1 a good spread of the maturities of the liabilities;
1 an adequate liquidity risk;
1 a sustainable long-term relationship with all financing partners;
1 an active financial risk control including interest risk, liquidity risk and counter-party risk.
The scale on which WDP practices its business activities, in combination with strict regulations which, as GVV/SIR, is subject to compliance and the high degree of visibility on the rental flows, gives WDP a competitive edge in the search for appropriate sources of financing. This is extremely important in the continuously changing financing environment where key words are high creditworthiness and diversification.
Specifically, WDP’s financial policy is based on the following KPIs:
1 a stable capital structure based on net debt / EBITDA (adjusted) around 8x;
1 financing of investments by minimum 50% equity and maximum 50% debt;
1 loan-to-value <50% throughout the entire cycle;
1 maintaining a solid investment grade credit rating;
1 a hedge ratio of at least 85%;
1 a sufficiently robust liquidity position to meet at least the obligations for the next 18 months;
1 a dividend pay-out rate of 80% in the form of an optional dividend.
As far as possible WDP endeavours to guarantee a matching of its assets and liabilities throughout the cycle. From that point of view the portfolio generates a gross yield of 5.7% based on a very high level of visibility with an average duration of the leases (including solar panels) of 5.5 years to first maturity, and 7.0 years to final maturity. These are then financed by debt that today carries an average cost of 1.9%, based on a high hedge ratio with long-term hedging instruments (6.6 years on average).
The Alternative Performance Measures (APM) used by WDP, are accompanied by a symbol (♦). Their definition and reconciliation can be consulted in the Annexes of this document.
1 Defined as operating result (before the result on the portfolio) divided by interest charges less interest and dividends collected less the fee for financial leasing and other.
2 Remaining term of debt at fixed rate and interest rate hedges entered into to hedge the debt against interest rate fluctuations.
This wide margin between yields and costs ensures adequate support to cover the costs of financing, resulting in an interest coverage ratio of 5.9x. Moreover, the visibility on both the income and expenses results in a robust revenue flow.
The use of debt is legally limited via the Belgian GVV/SIR Royal Decree. For instance, the gearing ratio cannot exceed 65% (both on a consolidated and statutory level) and moreover, dividend distributions to the shareholders are only permitted if the defined limit is not exceeded – given that they must be used at that time to bring the debt ratio back down below 65%. Debts are used to optimise returns for shareholders, but must be applied with prudence taking numerous factors into account, such as access to refinancing capital, capacity to cover interest costs, quality of the portfolio, the term of the leases and the portion of ongoing projects.
As of 31 December 2022, the total financial liabilities (as per IFRS) increased to 2,401.9 million euros compared to 2,193.7 million euros at the end of December 2021. Total assets increased from 6,106.2 million euros as of 31 December 2021 to 7,053.8 million euro as of 31 December 2022.
The gearing ratio (proportional) declined further to 37.6% per 31 December 2022, compared to 38.1% as of 31 December 2021. The loan-to-value, which compares the net financial debt with the portfolio value1, is 35.4% as of 31 December 2022, compared to 36.7% as of 31 December 2021. This favourable development was mainly driven by the significant reinforcing of equity increase (approximately 675 million euros via ABB of 300 million euros, contribution in kind for 176 million euros, the sale of two pre-hedging instruments for 125 million euros and retained earnings for 74 million euros).
Outstanding consolidated financial liabilities as of 31.12.2022
59% Long-term bilateral credit lines
34% Bonds
58% Green financing
Breakdown of debt
0.4% Straight loan
7% Commercial paper
As a capital intense real estate company we need to secure our access to financing (debt and equity). The clear regulatory shift towards green financing implies a higher demand from investors and financial institutions for green investments and green-certified assets. This ambition on making capital and operations more sustainable is also integrated into the WDP Climate Action Plan: the WDP GREEN track sets clear targets on green financing and green certified warehouses. Specifically, we aim to increase the share of green certified assets to at least 75% of the total property portfolio and the share of green financing to at least 75% of our total debt. In recent years, the number of sustainability certificates as well as the share of green financing in our portfolio increased sharply. At the end of 2022, the proportion of green certified assets was 39% (29% as of 31 December 2021) and green financing was 58% of outstanding debt (36% as of 31 December 2021).
1 Based on IFRS statements including solar panels and receivables from and participations in joint ventures.The majority of the debt instruments used are bullet type instruments, which implies that over the term, interests are due on the principal sum and that full repayment of the capital is due on the final maturity date. The maturity dates are evenly distributed over time. 42% of the debt matures between one and five years and 51% matures after more than five years. The other short-term financial debt of 179.9 million euros includes the commercial paper programme (168.9 million euros), short-term straight loans (10.2 million euros), and long-term financing maturing within the year (0.9 million euros). The weighted average term of WDP’s outstanding financial debt as of 31 December 2022 amounts to 5.6 year2
WDP's risk policy regarding interest rates, aims to overcome the fluctua tions in interest rates as far as possible and to optimise the cost of debt. This is done through a centrally managed macro-hedging policy, in which interest derivatives are used solely for the hedging of financial debts. The Group does not use derivative financial instruments for speculative purposes and does not hold derivatives for trading purposes.
The hedge ratio, which measures the percentage of financial debt at a fixed rate or at a floating interest rate and subsequently hedged through Interest Rate Swaps (IRSes), is 97% as of 31 December 2022 with a weighted average hedge maturity of 7 years and averages 87% over the next five years.
However, WDP's result is still subject to fluctuations (see also 7. Financial results and property report - Outlook for a sensitivity analysis with respect to short-term interest rates).
Weighted
In November 2022, WDP received first-time issuer credit ratings from Moody's and Fitch, both of which assigned solid long-term investment grade ratings with Stable Outlook of Baa1 and BBB+, respectively. These ratings reflect the company’s prudent financial policies, good access to capital, commitment to an earnings-based leverage ratio (net debt / EBITDA) and a diversified client portfolio that focuses on long-term cash flow generation. These ratings are further supported by a high-quality portfolio with continued high occupancy, retention rates and stable rental income (CPI-linked).
The charts below show WDP’s prudent, proactive and disciplined capital management as the basis of a solid investment grade rating.
Investment grade and stable outlook
1 High-quality portfolio in Western Europe and Romania
1 Sustained structural demand
1 Focus long-term cash flow generation
1 Diversified tenant base
1 Continued high occupancy and stable rental income (CPI linked)
The contractual provisions of the credit facilities generally stipulate that WDP remains qualified as a regulated real estate company (GVV/SIR) in Belgium, including a maximum gearing ratio of 65%, that there is a minimum Interest Coverage Ratio of 1.5x, that the value of speculative (i.e. without pre-letting) development projects may amount to a maximum of 15% of the book value of the portfolio and that the financial debts at subsidiary level may amount to a maximum of 30% of the total outstanding financial debts.
WDP confirms that all of these conditions were met throughout the entire 2022 financial year. The Interest Coverage Ratio was 5.9x, the percentage of speculative developments was 0.1% and the debt at the subsidiary level was 2.5% of the total outstanding financial debt at the end of 2022.
In 2022, an investment volume of around 530 million euros was identified consisting of new projects and land as well as acquisitions of existing buildings and investments in energy transition, in addition to the strategic 10% stake in Catena. In advance, an appropriate financing strategy was outlined to safeguard the solid capital structure of the company.
Besides financing net capital expenditure, the liquidity position was strengthened in 2022 to a buffer of 1.7 billion euros3 of unused and confirmed credit lines, by strengthening equity by almost 700 million euros and, among other things, by issuing around 1 billion euros of new loans at a fixed interest rate of 1.5%. This provides WDP with ample funds to finance ongoing projects (337 million euros), planned energy projects (150 million euros) and financing maturing in 2023-24 (330 million euros), including a buffer to respond to market opportunities. This excludes expected cash flow through retained earnings and optional dividends and refinancing of loans.
The company strengthened its financial resources over 2022 as follows:
1 Capital increase through contribution in kind for 37 million euros4
At the beginning of 2022, WDP acquired three neighbouring sites in the Hoogveld industrial zone in Dendermonde with a contribution in kind against a payment of 1,159,074 new WDP shares. The transaction has led to a 36.8 million euros increase in equity capital.
1 Placement of 500 million euros of green bonds via US private placement.5
WDP has successfully placed 500 million euros of green unsecured notes via US private placement with 8 international investors. The effective interest rate for the Company for these ten-year bonds is 1.52% (including pre-hedges). The proceeds from these green bonds will be used exclusively for the financing and refinancing of eligible assets as defined in the WDP Green Finance Framework.
1 Capital increase through contribution in kind for 19 million euros6
WDP will become the owner of the Bornem site, with administrative buildings and accompanying land reserve from neighbouring owner Qualiphar through a contribution in kind against payment of 626,526 new WDP shares. The transaction has led to an 18.8 million euros increase in equity capital.
1 Capital increase through contribution in kind for 120 million euros7
WDP acquired seven logistics sites from SEDIMMO NV in Tournai accounting for an overall investment of approximately 120 million euros. This acquisition was achieved with a staggered contribution in kind of the sites to WDP. On 14 September 2022, the first part of this transaction was completed via a contribution in kind against payment of 2,398,747 new WDP shares. This first phase resulted in a 67.5 million euros bolstering of equity capital. The second – and concluding – part was implemented
on 10 November 2022 via a contribution in kind against payment of 2,092,788 new shares, resulting in a 52.8 million euros reinforcement of equity capital.
WDP launched a capital increase in cash within the authorised capital with a waiver of the legal pre-emptive right of existing shareholders (insofar needed, partly in favour of WDP’s current reference shareholder, the partnership RTKA (the Jos De Pauw Family)) and without granting an irreducible allocation right to the existing shareholders. The capital increase was achieved using an exempt accelerated private placement with the composition of an order book (accelerated bookbuilding or ABB) with international qualified and/or institutional investors.
The gross amount of this capital increase amounted to 300 million euros via the issue of 12,931,035 new shares at an issue price of 23.20 euros per share. The 12,931,035 new shares (including the 715,000 new shares to the Jos De Pauw family amounting to approximately 17 million euros), corresponds to approximately 6.84% of the outstanding capital prior to the capital increase. This issue price represents a discount of 5.9% from the last share price on Wednesday 19 October 2022 of 24.66 euros.
WDP managed to conclude a syndicated loan facility with a consortium of international banks led by China Construction Bank for a total amount of 440 million euros. This loan (drawn down on 13 January 2023) will be used to finance the pre-let property projects and the Energy as a Business-strategy, according to WDP’s Green Finance Framework. The effective fixed interest rate for this seven-year bullet loan maturing in 2030 is 1.5% (including pre-hedging instrument put in place early 2022).
In 2022, WDP has again continuously monitored the potential impact of financial risks and has taken the necessary measures to manage these risks. These risks include counterparty risk (insolvency or credit risk affecting financial partners), liquidity risk (nonavailability of financing or very expensive financing options) and risks related to interest, budget, agreements and exchange rates.
The independent real estate experts Stadim, JLL, Cushman & Wakefield, CBRE and BNP Paribas Real Estate valued WDP's property portfolio (including Assets held for sale and excluding solar panels) in conformance with IAS 40 at a fair value1 of 6,492.1 million euros as of 31 December 2022. The comparable value at the end of 2021 was 5,894.5 million euros.
The portfolio breaks down as follows:
1 The fair value at which the investment property is measured consists of the investment value less transaction costs. The average theoretical local transaction costs deducted from the investment value are as follows, by country: Belgium: 2.5%, The Netherlands: 10.4%, France: 6.9%, Luxembourg: 7.0%, Germany: 7.8%, and Romania: 1.5%.
1 Financial performance indicator calculated according to EPRA's (European Public Real Estate Association) Best Practices Recommendations. Please see www.epra.com
2 Excluding solar panels.
In 2022, WDP invested a total amount of 249.8 million euros in new investments. An additional 483.1 million euros was invested for the completion of pre-leased projects for own account and investment in the existing portfolio.
The change in the valuation of the investment properties amounted to 127.3 million euros during 2022 on a portfolio of approximately 6.5 billion euros. The gross rental yield based on the contractual rent, after the addition of the estimated market rent value for the unlet parts, amounts to 5.7% as of 31 December 2022, compared to 5.2% at the end of 2021.
The total surface area comprises 1,678.5 hectares, including 110.5 hectares granted in concession. The balance of 1,568.0 hectares has a fair value of 1,806.6 million euros or 28% of the total fair value. This gives an average land value of 115.0 euros/m², excluding transaction costs. This area also includes the strategic land reserves, particularly in Belgium, the Netherlands, and Romania.
Breakdown of existing property portfolio by property type (based on fair value)
Breakdown of fair value by age2
Breakdown of total rental value by intended use Breakdown of existing property portfolio (based on fair value) by property quality categorisation
8% Manufacturing
4% Cross-dock
4% High bay/Multiple oor
2% Future redevelopment
2% Other
Average age 7 years
51%
Share of Urban logistics in the total property portfolio
9% older than 20 years
86% Warehouses
12% Of ces at warehouses
2% Miscellaneous (mixed-use, parking and archive spaces)
47% Class A warehouse
39% Class A green certi ed warehouse3
10% Class B warehouse
2% Class C warehouse
2% Other
Urban logistics properties are General warehouse or Cross-dock buildings that are close to large, densely populated consumer areas and can offer quick delivery times.
2 Buildings that have undergone significant renovations are considered new once their renovations are complete.
3 Class A green-certified warehouse refers to the Class A BREEAM and Class A EDGE certified buildings within the existing WDP property portfolio.
The occupancy rate of the WDP portfolio is 99.1% at the end of 2022. This represents the outcome of WDP’s commercial strategy, which is aimed at developing long-term relationships with clients and supports the company’s performance with a high operating margin.
The development of long-term partnerships with customers is further reflected in the fact that the average remaining maturity date of the leases is 6.9 years. Assuming the first option of termination, the average remaining duration is 5.5 years.
If income from the solar panels is also taken into account, the average remaining duration until the maturity date is 7.0 years. Assuming the first option of termination, the average remaining duration is 5.6 years.
The top ten tenants have a combined share of 27% and each use several WDP sites. The Top 20 make up a share of 41%.
% already extended as at 31.12.2022 (left scale)
For a complete overview of ongoing projects as of 31 December 2022, see Chapter 4. Performance and trends on pp. 26.
All properties were inspected on site during 2022 by independent real estate experts Stadim, JLL, Cushman & Wakefield, CBRE and BNP Paribas Real Estate.
other properties have a fair value that represent less than 1% of the consolidated assets.
other properties have a fair value that represent less than 1% of the consolidated assets.
1 Based on 100% of the lettable area and the rental income for the fully consolidated entities (including WDP Romania) and the proportionate share for the joint ventures (i.e. 55% for Luxembourg and 29% for WDPort of Ghent Big Box).
2 The occupancy rate is calculated based on the rental values of the leased properties and the non-leased space. This does not include projects under development and/or renovations.
Even though 2022 was marked by changed market conditions due to high market volatility, skyrocketing inflation, a weakening macroeconomic outlook and sharply increased cost of capital, the logistics property market can still count on healthy market dynamics.
Despite a limited 10% decline, demand for logistics and industrial properties in Belgium and Luxembourg remained high compared to average take-up volumes pre-covid. From a preliminary balance sheet of 2022, about 2.0 million m2 of logistics and semi-industrial real estate was occupied. Demand is mainly driven by logistics service providers (3PL), industry and retail. Demand due to omnichannel activities then normalised after aboveaverage growth during the pandemic. Directly available space remains extremely low and is situated at 1.2%. The scarcity of immediately available space is greatest in the regions of Antwerp, Brussels, and Liège with 0.5%, 1.8%, and 0.9% respectively. The project pipeline for 2023 is to a large extent pre-let to new projects, which will perpetuate the low level of availability.
The low availability rate and the limited available land holdings in combination with the strong demand is putting pressure on land prices and rent levels. For example, average land prices on the Antwerp-Brussels axis run as high as 280 euros per m², with peaks of up to 350 euros per m² for the most strategic (and urban) locations in and around Brussels. Top rents in Brussels are up to 65 euros per m² per year and up to 56 euros per m² per year on the Antwerp-Brussels axis – and are expected to increase by 7% by 2023. Compared to the same period last year, we see an 85 basis points increase in prime yields to around 4.35%. This increase is mainly due to the sharply increased cost of capital and sharply reduced liquidity in the property market. Indeed, the changed price expectation today creates a high bid/ask spread between buyers and sellers and has led to a significantly lower number of transactions in the investment market. Awareness of climate issues, increased interest rates as well as high construction costs and inflation are some of the factors that will influence the demand for logistics property in 2023.
Demand for logistics property has remained unchanged despite historically low vacancy rates, scarcity of new land (and high land prices), limited capacity on the power grid and sharply increased construction costs. On the one hand, this demand is supported by the continued growth of online purchases – the online penetration rate, the percentage of total retail sales transacted online, rose to 22% and, according to market study, this increase will rise to 30% by 2030. On the other hand, companies accrued strategic stocks to avoid further disruptions in supply chains. Although demand in a post-covid economy is expected to normalise with possibly a temporary cyclical impact on demand due to the uncertain macroeconomic environment, the logistics sector remains fundamentally sound. This is reflected in a further decrease in the vacancy rate to approximately 2.5% (approximately 3.5% by the end of 2021). Thus the risk of a significant short-term increase is extremely limited: 30% of the current development pipeline of 2.7 million m2 is speculative in development against an average annual take-up of over 2.6 million m2 As a result of low supply, rents rose by 20% on average in 2022 – expected to rise by 10% in 2023. The highest prices are paid in Schiphol (110 euros/m²), Rotterdam (90 euros/m²), and Tilburg-Waalwijk (80 euros/m²). Prime yields are around 4.3%, up 100 basis points year-on-year – reflecting the sharply increased cost of capital and limited liquidity. A challenge as an opportunity is the ongoing more restrictive government policy and nitrogen debate. As a result, sustainability and efficient land use will play an important role more than ever, which will only further increase interest in brownfields.
During 2022, a total of 4.1 million m2 of logistics property space was taken up – down 14% from the same period in 2021 but in line with the five-year average take-up level. This decrease is mainly due to 2021 as an extraordinary year. Despite the uncertain macroeconomic environment, sharply increased inflation as well as the accelerated energy transition, demand for qualitative space is expected to remain level at approximately 3.5 million m2 in 2023.
Long-term structural trends, despite normalisation post-covid, still support demand for modern logistics property. This increase is mainly attributed to the increased importance of e-commerce and online sales (with increased interest in urban logistics property). Moreover, companies want to further optimise their supply chain to avoid stock shortages. This sustained demand caused the vacancy rate in the French market to dropped to 3.8% by the end of 2022, an historic low. The deficit in immediately available space is limited to just 1.9 million m2, down more than 15% from the same period in 2021. This deficit is primarily pronounced in the Lyon region, the Provence-Alpes-Côte d'Azur region and the region around Paris with 0.9%, 1.2% and 2.7% respectively. Given this acute shortage of readily available space, upward pressure on market rents will continue. In the region around Paris, prime rent rose by about 4% to 84 euros/m2/year. The prime yield was 4.25%, up 50 basis points from the previous quarter. This increase is mainly due to the increased financing cost.
The Romanian logistics and industrial real estate market can expect take-up of 870,000 m2 over the first nine months of 2022, which is double that of 2021. Of the total take-up, warehousing (50%) was among tenants' main target segment with retail accounting for the majority of total demand. The historically high demand for logistics property is still mainly located in and around the capital Bucharest (63%), followed by cities in the south (20%) and west (12%). Moreover, the increased demand is due to Romania's strategically favourable location – in this regard, it acts as a gateway to Western Europe and Asia. As a result of disrupted supply chains (partly due to the covid pandemic and increased geopolitical tensions), some retailers just like manufacturers are moving their production closer to the end customer (reshoring), implementing a diversification policy in terms of inventory quantity and increasing the number of suppliers to avoid stock shortages. Romania will play an important role here. Throughout the first nine months of 2022, about 500,000 m² of logistics property was completed – the Bucharest region's share in this amounts to 55%. This brings the total surface area of logistics and industrial property in
Romania to 6.1 million m2. It is reported that the total supply of logistics and industrial real estate will increase to approximately 6.7 million m2 by 2023. Of this development pipeline of 550,000 m2, about 50% is speculatively under development and it is largely located in the Bucharest West region (approx. 80%). The average vacancy rate remained stable around 4.8% (5.5% in Bucharest and 4.2% regionally). On average, rental levels per m2 remain stable in Romania. Prime yields are around 7.1%.
The German logistics property market saw a 10% increase in take-up over the first nine months to approximately 6.4 million m2. Over 40% of these are located in the top five German regions, notably Berlin (864,000 m2), Düsseldorf (1,275,000 m2), Rhine-Maine (244,000 m2), Hamburg (346,000 m2) and Munich (109,000 m2).
Healthy rental growth is driven by the limited supply of available logistics property (sites with significant lettable area), high construction costs and sharply increased cost of capital. Besides long-term trends affecting demand for logistics property (continued demand due to the growth of omnichannel activities and the crucial role of logistics service providers in the supply chain), the importance of sustainability continues to grow. Combined with an increasing scarcity of land positions, interest in redevelopment is also growing here.
Source: WDP Research and estate agent reports
The forecasts described below contain the expectations for the 2023 financial year with regard to the consolidated EPRA earnings and WDP's consolidated balance sheet. The basis for their drafting and preparation is similar to that of the outlook for the 2022 and 2021 financial years and is in accordance with the WDP’s accounting policy and IFRS1
These forecasts were made based on information available on 31 December 2022. The forecasts with regard to the consolidated balance sheet and the EPRA Earnings are predictions that will depend on changes in the economy, the financial markets and property markets. This prospective information and these forecasts, opinions and estimates prepared by WDP relating to its currently expected future performance and the market in which WDP operates do not constitute a commitment for the company. By their very nature, ‘forward-looking statements’ imply inherent risks, uncertainties and assumptions (both general and specific), including a risk that these statements will not prove to be accurate.
1 Inflation: a weighted average inflation rate of 6%, based on economic consensus expectations per 31 December 2022. This results in organic growth of 5% based on the indexation clauses in the leases.
1 Interest rates: an average level of one, three and six-month Euribor rates of 2.62%, 2.81%, and 2.89% respectively.
1 Financial hedging instruments: given their volatility, variations in their market values were not taken into account. These changes are irrelevant to the forecasts associated with the EPRA Earnings.
1 Valuation of real estate portfolio and solar panels: no predictions are made regarding the variations in the fair value of the real estate portfolio and solar panels. This would be unreliable and subject to a multitude of external factors over which the company has no influence. These variations are also not relevant to the outlook for EPRA earnings.
1 External events: it is assumed that no material changes will occur in the (geo)political and/or economic climate which could have a material impact on the Group.
1 Regulatory and tax framework: it is assumed that no material changes occur in tax legislation or regulatory requirements that would affect the Group's results or its accounting methods.
1 Risks: the outlook may be affected, inter alia, by market, operational, financi al and regulatory risks as described in Chapter 9 Risk factors
1 Net rental result: the increase was mainly driven by external growth and organic growth via indexation of the leases. The net investment volume of around 475 million euros achieved in 2022 will largely contribute to the result during the 2023 financial year. In addition, as announced, various pre-let development projects are in execution with gradual delivery over 20232. As regards organic growth, the indexation of the leases is taken into account (see above). In 2023, 12% of the contracts will come to maturity, of which 40% could already be renewed at the time of the publication of the 2022 results and for which the current rent is therefore known. For the remaining 60%, lease extensions and/or renewals after a possible vacancy period are taken into account. WDP assumes a minimum average occupancy rate of 98% for 2023 and stable customer payment behaviour.
1 Solar energy revenues: estimated at about 27 million euros, an increase driven by the additional PV projects in Belgium, the Netherlands, Romania and Luxembourg, as well as higher income from organically higher electricity prices.
1 Other operating income/expenses: this item includes the net effect of property taxes, the property management fee charged by WDP as well as some non-recurring income.
1 Property costs: these are mainly the net costs (i.e. after any recharges) for maintenance and repairs, insurance contracts and commissions. They have been estimated for 2023 on the basis of the current portfolio, the expected investments, and the evolution of the figures from previous financial years.
1 For the auditor’s report on the EPRA profit forecast, see Chapter 12. Appendices – External audit.
2 For an overview of ongoing projects see Chapter 4. Performance and trends
1 General costs: these costs evolve in line with the growth of the portfolio, whereby the operational platform is further developed in a cost-efficient manner, in particular, while maintaining the high operating margin of approximately 91%. These costs include the operating costs of WDP, mainly salaries, office rent, fees to external advisors and costs related to the stock exchange listing and external communication.
1 Financial result: the evolution of financial debt is assumed to be dependent on the investment programme. Taking into account the short-term interest rate changes and a 97% hedge as of 31 December 2022, an average cost of debt of 1.9% is assumed for 2023. It is assumed that no loans are repaid prematurely, nor that current IRS contracts will be terminated prematurely. The total financial costs were then reduced by capitalised interest included in the investment cost of the existing developments at an interest rate equivalent to the estimated overall financing cost. The financial charges include the recurring cost of concessi ons in the amount of 3.2 million euros (for the sites on which WDP does not have bare ownership but does retain usufruct).
1 Taxes: these include the annual corporate income tax and withholding tax on dividends, depending on the tax status of each entity. A fiscal provision was taken into account if WDP could not continue to qualify as FBI in the Netherlands, this prompted by caution given the current significant uncertainty created by the withdrawal of the tax ruling from 1 January 2021 by the Dutch tax authorities. This has an impact of approximately 4 million euros.
1 Share in the result of joint ventures and associated companies: this result includes the result of the joint ventures WDPort of Ghent Big Box and WDP Luxembourg, and the contribution following the participation in Catena.
Based on the current outlook and the above assumptions, WDP expects EPRA-earnings per share of 1.35 euros (approximately 278 million euros) in 2023, up 8% from 1.25 euros in 2022, taken into account an increase in the average number of shares of 9.0%. Based on the current profit expectations, WDP intends to pay a gross dividend per share of 1.08 euros for the financial year 2023 (payable in 2024), a comparable increase of 8%.
This outlook for 2023 is based on current knowledge and situation and barring unforeseen circumstances within the context of the evolution of external factors such as a weakening macroeconomic outlook, high market volatility and a sharply increased cost of capital.
In drawing up the projected balance sheet, account was taken of factors that could reasonably be estimated. The following assumptions were taken into account:
1 Assets - property portfolio: the investments as mentioned above were taken into account.
1 Assets - solar panels: fair value valuation, using the same assumptions as at 31 December 2022, subject to the roll-over of the valuation model by one year3
1 Liabilities - equity capital increase: the 2022 dividend distribution was taken into account with the assumption of 50% taken in shares in the form of an optional dividend and the EPRA earnings evolution during the 2023 financial year.
1 Liabilities - financial debts: evolution based on the expected investment volume and the portion that is expected to be financed through equity capital (via retained earnings and the optional dividend). Hereby, a loan-to-value – based on the current valuation of the portfolio – below 40% as of 31 December 2023 and an average cost of debt of 1.9% for 2023 is expected. As of 31 December 2022, the total undrawn and committed long-term credit lines have been reinforced significantly and amount to approximately 1.7 billion euros4. This provides WDP with ample funds to finance ongoing projects (337 million euros), planned energy projects (150 million euros) and financing maturing in 2023-24 (330 million euros), including a buffer to respond to market opportunities. This excludes expected cash flow through retained earnings and optional dividends and excluding refinancing of loans.
The strategic growth plan for 2022-25 is a four-year plan in which WDP aspires to achieve annual EPRA Earnings per share of +8% to 1.50 euros in 2025. The dividend per share is expected to evolve synchronously towards 1.20 euros in 2025 based on a low pay-out ratio of 80%.
In early 2022, WDP announced its growth plan whereby the targeted growth will be supported by the structural demand for logistics space, internal growth and value creation within the existing portfolio and scaling up of WDP ENERGY.
WDP remains focused on the earnings target in its growth plan and remains alert and vigilant to achieve that goal. However, the parameters on which the growth plan was initially based have changed because of certain external factors, such as a sharply increased cost of capital, persistently high construction prices and high inflation. WDP believes that, while maintaining a solid financial position, it is well-positioned to continue creating value for its shareholders through growth in EPRA earnings and dividends per share, even in a more challenging environment. Specifically, this means that we will put profitability first and be more selective with new investments, further focus on internal growth opportunities and accelerate the WDP ENERGY roll-out. This is expected to lead to an increasing contribution of organic growth (mainly through rent indexation) and energy projects versus external growth, compared to what was originally envisaged in the growth plan.
To this end, WDP relies on an inflation-proof cash flow profile thanks to indexation clauses in the leases combined with rising market rents. For example, in 2023, WDP expects a positive impact on rents of +5% driven by indexation of contracts. Moreover, at a hedge ratio 97% the cost of debt is almost fully hedged for an average term of 7 years and an average hedge ratio of 87% over the next 5 years.
The logistics property sector remains fundamentally sound given the crucial role of logistics within the economy for various industries (both on the inbound and outbound sides of the supply chain), despite a possible conjectural drop in demand due to the weak macroeconomic outlook. Nevertheless, the upward pressure on market rents is further supported by limited availability (vacancy in the market <5% in all regions where WDP operates) and scarcity of land.
Since the last quarter, WDP has seen stabilisation at a high level for both construction prices and delivery times for new projects. For the new projects, WDP is charging higher rents. However, achieving the targeted returns remains a challenge for each individual project. It is important that investments are calibrated to the changed economic parameters, such as the increased cost of capital.
This 2023 outlook and the 2022-25 growth plan targets are based on current knowledge and situation and notwithstanding unforeseen circumstances due to the evolution of external factors, such as a weakening macroeconomic outlook, high market volatility and a sharply increased cost of capital.
The growth will be driven by:
1 Selective use of capital for investments (based on cost of capital and building costs);
1 mainly through pre-let developments on our own and new sites;
1 within the existing markets in the Benelux and Romania (<20% in Romania);
1 but also further geographical expansion within the EU through further development in Germany and capitalisation of the activities in France;
1 in sync with a dynamic, strategic land bank focusing on pre-let developments within the developer/investor model.
1 Further differentiation in terms of customer focus and a high-quality portfolio, supported by technology, energy and sustainability;
1 Increasing scarcity of land leads to upward pressure on market rents;
1 Well positioned to absorb high(er) inflation through CPI-linked rent;
1 Rent review potential in the medium-term with a commercial approach;
1 Further expansion of services, such as upgrades, innovation and investments in sustainability, PropTech, etc.
1 Scaling up the Energy as a business strategy with a clear role regarding energy transition;
1 Moreover, WDP wants to take the lead within its sector and make a clear commitment to its customers and suppliers with regard to decarbonisation;
1 This is based on the WDP Climate Action Plan in which clear objectives have been formulated throughout the entire value chain;
1 where WDP recognises the climate risks and combines these with business opportunities; and
1 made possible by technology and innovation.
This strategy is backed by a stringent capital discipline that allows for:
1 Financing of investments by minimum 50% equity and maximum 50% debt;
1 Stable capital structure based on a net debt/EBITDA (adjusted) of circa 8x;
1 Loan-to-value <50% throughout the cycle.
Moreover, WDP allows for the following assumptions and underlying assumptions:
1 Continued structural demand for new, modern logistics property, albeit at a normalised pace;
1 Solid operational metrics (high occupancy rate, long-term leases, sustainable rent levels);
1 Balanced contribution of growth drivers (external growth, organic growth, WDP ENERGY).
The following table provides a non-exhaustive overview of external and internal factors which have an influence on the key parameters of the company, namely the EPRA Earnings, the gearing ratio and shareholders’ equity.
Sensitivity analysis based on the consolidated figures as of 31 December 2022
“Effective decision-making within a fast-growing organisation requires delineated decision-making powers. That is how ownership and responsibility are being encouraged and agility is being facilitated.
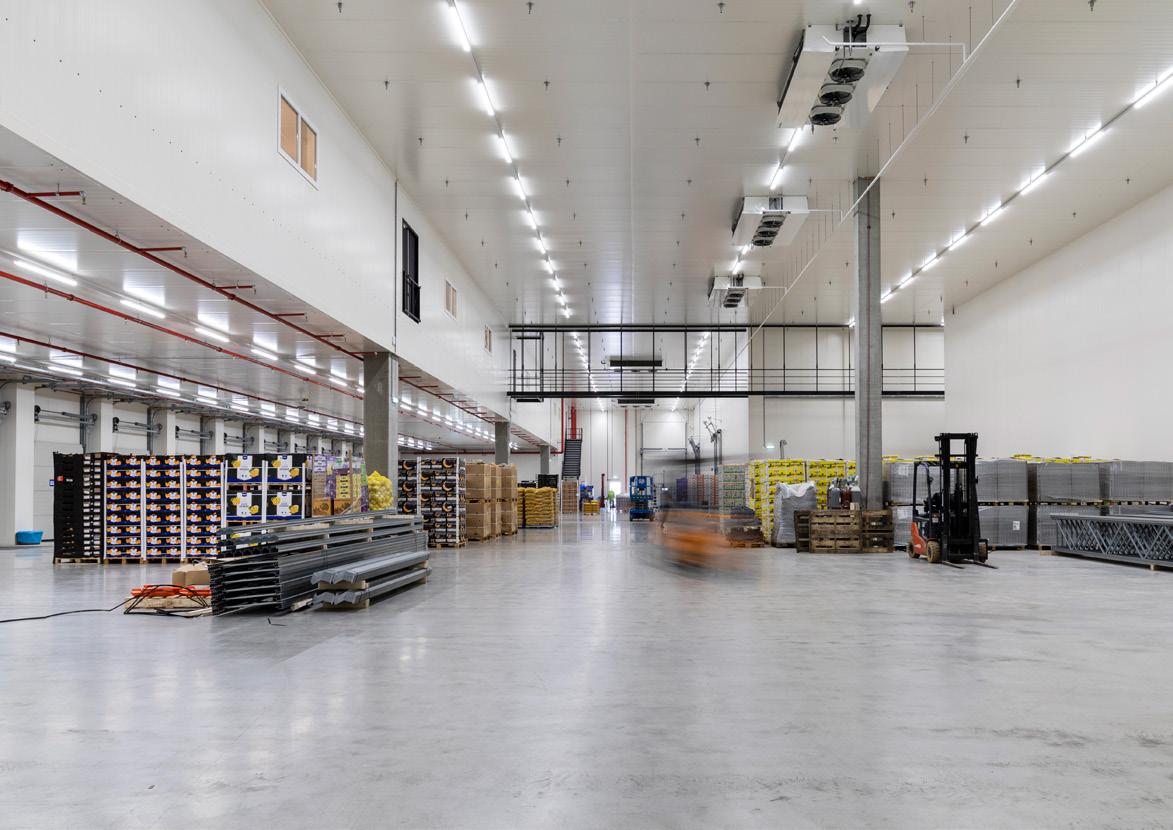
Since its foundation, WDP has prioritised honest and proper business practices, always based on our core values. WDP strives to meet the highest of standards in the area of corporate governance, out of a firm belief that this contributes to the long-term success of the company and to protecting the interests of all stakeholders. The Board of Directors monitors to ensure that the corporate governance principles and processes developed for this purpose are suitable for the Company and meet the applicable corporate governance rules or standards at all times.
The Corporate Governance Charter contains all information on the good governance rules that apply within the company, including the principles and processes of the management structure, conflicts of interest prevention policy, remuneration policy, Dealing Code and good conduct policy. This charter is available on our website as are other internal policies.
Regulations:
1 Code of companies and associations
1 Corporate Governance Code 2020
1 REIT Regulations
1 EU accounting regulations
1 IFRS
1 EU Market Abuse Regulation
1 EU Prospectus Regulation
1 Euronext Rulebook
Internal policies:
1 Corporate Governance Charter
1 Dealing Code
1 Employee Code of Conduct
1 Supplier Code of Conduct
1 Remuneration Policy
1 Anti-Bribery and corruption Policy
1 Diversity Policy
1 Ethics Code
1 Grievance Management Procedure
1 Corporate citizenship
1 Enterprise Risk Management Policy
In accordance with Article 3:6 (§2) CCA and the Royal Decree of 12 May 2019 indicating the mandatory corporate governance code for listed companies, WDP applies the 2020 Belgian Corporate Governance Code (2020 Code), taking into account the special circumstances related to the GVV/SIR legislation. The 2020 Code is available online at www.corporategovernancecommittee.be
The 2020 Code applies the comply or explain principle, meaning that any deviations from the recommendations must be justified. As of the date of this Annual Report, WDP is in compliance with the provisions of the 2020 Code, except for the following principles:
Principles 3.19 to 3.21 of the 2020 Code cover the appointment of secretaries in the company.
EXPLAIN | Given the rather small size of the Board of Directors, and to use the strengths within the company with maximum efficiency, for the time being the Board of Directors has opted not to assign the position of secretary to one specific person. At WDP, the function of secretary is performed by the CFO, who is also present at the Board of Directors’ meetings, and the General Counsel, both of whom have the necessary skills and knowledge with regard to management issues:
1 supporting the Board of Directors and its committees in all governance matters;
1 preparing the Corporate Governance Charter and Corporate Governance Statement;
1 ensuring a proper flow of information within the Board of Directors and its committees and between the executive management and the non-executive directors;
1 accurately recording the essence of the discussions and decisions in the board meetings in the minutes; and
1 facilitating initial training and supporting professional development where necessary.
Each director may contact the CFO or General Council individually.
Principle 7.6 of the 2020 Code states that non-executive directors should receive part of their remuneration in the form of shares in the company.
EXPLAIN | WDP deviates from this principle and does not provide remuneration in shares to non-executive directors. Taking into account the current remuneration amounts and the independent nature of the non-executive directors, WDP is of the view that providing part of the remuneration in shares would not necessarily contribute to the objective of the 2020 Code to have these directors act with the perspective of a long-term shareholder. As a GVV/SIR, WDP strives for a robust profit and dividend per share, in line with the perspective of a long-term shareholder. Since its listing in 1999, WDP has focused on creating stable cash flows over the long-term which, in combination with its high disbursement obligation as a GVV/SIR, makes WDP a fully fledged, profitable and liquid alternative to direct investments in real estate based on rental income. This is the basis of its strategy, as determined by the Board of Directors, which is also clearly reflected in its strategic growth plan.
The remuneration report included in this Corporate Governance Statement gives a summary of the total remuneration for the non-executive directors.
Principle 7.9 of the 2020 Code states that the Board of Directors must set a minimum threshold for shareholdings of members of the Management Committee.
EXPLAIN | WDP deviates from this principle and does not set any explicit minimum threshold for WDP shareholdings for Management Committee members. As a GVV/SIR, WDP strives for a robust profit and dividend per share, in line with the perspective of a long-term shareholder. Since its listing in 1999, WDP has focused on creating stable cash flows over the long-term which, in combination with its high disbursement obligation as a GVV/SIR, makes WDP a fully fledged, profitable and liquid alternative to direct investments in real estate based on rental income. This is the basis of its strategy, as determined by the Board of Directors, which is also clearly reflected in its strategic growth plan. It is this strategy that Management Committee members must roll out operationally. WDP therefore believes that its remuneration policy establishes a clear link with the creation of stable long-term cash flows and thus ensures that Management Committee members act from the perspective of a long-term shareholder. WDP does, however, encourage the members of the Management Committee to build up a shareholding and hold shares in WDP. Both CEOs have now each accrued shareholdings of this kind themselves.
The remuneration report in this Corporate Governance Statement gives a summary of the shareholdings that the Management Committee members have in their own portfolios. This is therefore a shareholding in the Company accumulated by the relevant Management Committee member.
On 1 October 2019, after the conversion of WDP from a partnership limited by shares managed by a Statutory Manager into a public limited company with a unitary board (one-tier governance structure), the directors were appointed for the first time in WDP NV/SA, which is legally a different entity.
However, this appointment took into account the terms of these directors on the Board of Directors of the former statutory manager of WDP, in the sense that:
1 they were appointed for the remaining period of their term with the former statutory manager; and
1 in drawing up their status as an independent director (Article 7:87 CCA), they also took into account the terms they had as independent and/or non-executive director with the former statutory manager.
At least once every three years, the Board of Directors will evaluate the governance structure it has chosen to determine whether it is still suitable, and if not, it will propose a new governance structure to the General Meeting. A final review of the governance structure by the Board of Directors took place in December 2022 where it was decided that the choice of a unitary board is still the appropriate governance structure for WDP today.
The WDP Articles of Association state that the Company must be run by a Board of Directors consisting of at least 3 directors appointed by the General Meeting for up to four years. The majority of the Board of Directors consists of non-executive directors; it also has a suitable number of independent directors. The Articles of Association provide, in accordance with the 2020 Code, that at least three Directors have the status of independent directors in accordance with the criteria described in the 2020 Code and this CG Charter. Moreover, WDP strives for the majority of the Board of Directors to be independent.
The membership of the Board of Directors enables the management of WDP in accordance with its Articles of Association and its permitted activities (as described in Article 4 of the GVV/SIR Act).
Members of the Board of Directors must meet the requirements set on the GVV/SIR under the applicable law, including membership exclusively comprising natural persons that meet the requirements of Articles 14 and 15 of the GVV/SIR Act (fit-and-proper test for directors).
The membership of the Board of Directors as a whole must provide a combination of experience, knowledge and skills from individual members that enables optimal fulfilment of the role of the Board of Directors. Thus, on the whole, the Board of Directors must offer at least the following characteristics:
1 a proper balance in terms of knowledge, competencies and experience, beginning with the requirements for doing business efficiently in the markets where the company operates;
1 its members must ensure that it functions as an agile and effective body at all times, driven by an entrepreneurial spirit;
1 in decisions regarding its membership, the Board of Directors also strives to achieve diversity (in terms of gender, age and nationality) as well as to minimise present or future conflicts of interest between members and the WDP Group (legal, business, economic and ethical conflicts of interest).
The Corporate Governance Charter also sets out the specific qualitative requirements on individual members, including an independent and enterprising personality, an impeccable reputation and proper business ethics.
Moreover, the following principles must also be applied:
1 conformity with diversity requirements (Article 3:6 CCA);
1 conformity with specific gender diversity requirements (Article 7:86 CCA);
1 application of the defined age limit of 70 years, in that the term of a director shall end on conclusion of the annual meeting in the year in which the director turns 70 years of age, unless the Board of Directors resolves otherwise at the proposal of the Nomination Committee;
1 for the non-executive directors: up to 5 appointments as director of a listed company, subject to approval from the Board of Directors (with application of the comply or explain principle).
The articles of association of WDP provide for a binding nomination right for any natural person, legal entity or company (with or without legal personality) that individually and directly holds at least 10% of the shares in the company, under specific conditions as described in Article 15 of the Articles of Association of WDP.
By virtue of this binding nomination right, Tony De Pauw was appointed by the Extraordinary General Meeting of WDP of 11 September 2019 as a director of WDP, effective as of 1 October 2019 at the proposal of the current Reference Shareholder of the company, the management body RTKA. As of the date of this Annual Report, Tony De Pauw is the only director appointed based on this binding nomination.
Membership of the Board of Directors on 31 December 2022
The Board of Directors comprises six members (natural persons):
1 2 executive directors, one of whom has been nominated by the Reference Shareholder (the management body RTKA): Tony De Pauw; and
1 4 non-executive and independent directors within the meaning of Article 7:87 (§ 1) CCA.
Frank Meysman’s mandate as non-executive director came to an end at the 27 April 2022 General Meeting.
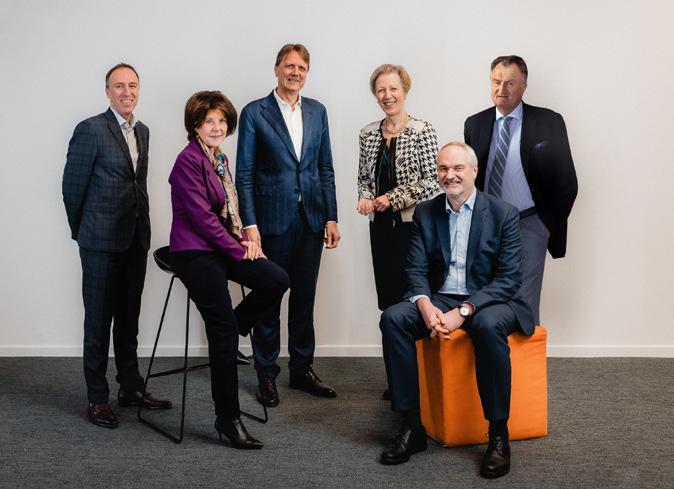 Rik Vandenberghe Born in 1961
Anne Leclercq Born in 1956
Cynthia Van Hulle Born in 1956
Jürgen Ingels Born in 1971
Joost Uwents Born in 1969
From left to right
Rik Vandenberghe Born in 1961
Anne Leclercq Born in 1956
Cynthia Van Hulle Born in 1956
Jürgen Ingels Born in 1971
Joost Uwents Born in 1969
From left to right
has been the independent, non-executive chair of the Board of Directors of WDP since April 2019. He holds a Commercial Engineering diploma from the Catholic University of Leuven.

In the period 2017–2021, he served as CEO of Besix Group, a leading multidisciplinary construction and real estate company operating in twenty-five countries across five continents, where he was instrumental in strengthening Besix Group’s multidisciplinary offering. Today, he is still executive director of Besix Group and assists management in an advisory capacity. Rik Vandenberghe started his career in the banking sector, working at ING for thirty years, where he held numerous leadership roles and, as CEO of ING Luxembourg and ING Belgium, enjoyed close working relationships with key actors in the real estate market and garnered extensive international experience. At ING Belgium, he headed the Real Estate & Development Financing department (1991-97), a department that also fell under his broader responsibilities until 2007. As CEO, he also formed part of the Risk Committee of ING Luxembourg (2007-13) and the Market Risk Committee of ING Belgium (2013-17).
His experience as the chairman of organisations, such as Febelfin, subsidiaries of the Besix Group, and ING, his knowledge of real estate, finance and the stock market, his entrepreneurial spirit as well as his eye for innovation, support the management of WDP and the further growth of the company.
has been an independent non-executive director since April 2015. She studied law at the Catholic University of Leuven and obtained a diploma from the Kellogg School of Management and an MBA from the Vlerick Business School. At the University of Cambridge Institute for Sustainability Leadership, she took the Business Sustainability Management course in 2020.
From 1980 to 1998, she worked at several banks where, as Directeur Trésorerie, she was responsible for the Tresorerie and Trading Books and the investment portfolio. She was also a member of the ALM Committee (asset and liability management) and she was affiliated with the Belgian Debt Agency from 1998 to 2019. As from 2008, she became the Director of Treasury and Capital Markets. In this capacity, she was responsible for defining the financing policy of the Belgian national debt and the organisation of secondary markets. She was a member of the Strategic Committee, which sets the strategy and risk management for sovereign debt financing, and as Director of Treasury and Capital Markets chaired the Market Committee, responsible for the implementation of financing and its continuous assessment against the risk framework. These positions contributed to gaining extensive knowledge and experience in enterprise risk management. Her general management experience, knowledge and expertise regarding financial markets and risk-based, efficient financial management (debt capital markets), provide substantial added value to the financing policy of WDP. In addition, she has served in various roles in supranational institutions such as the IMF, the World Bank and the OECD.


has been an independent non-executive director since February 2015. She earned her doctorate in Applied Economic Sciences at the University of Leuven where she is a professor at the Faculty of Economics and Business Studies.
She had previously studied at Yale University and at the University of Chicago and taught at the University of Columbia. In addition, she has held the Francqui chair at the University of Ghent. Key areas of expertise in her academic work include corporate finance, restructuring and governance issues. She brings thorough knowledge of accounting and auditing to the table.
Other active terms on 31 December 2022
Listed companies –Non-listed companies
Besix Group
T.P.F.
New Vision
Next Day Capital Holding
Next Day Asset Management (chair)
Next Day Investment Management (chair)
Orientalis Nex Day Smart Living (chair)
High Five Next Day Smart Living (chair)
Terms ending on 31 December 2022, but held in the period from 2017 onwards
ING Bank Belgium
ING Luxembourg
Entreprises Jacques Delens
Établissements Jean Wust
Febelfin
Franki Foundations Belgium
LUX T.P.
Olympiades Brussels Hotel
Socogetra
Different companies within the Besix group
Olympic Invest
Vanhout
Compagnie Belge de Bâtiment (chair)
Six Construct
Watpac
Van den Berg
Les News 24
WDP shareholdings as at 27 March 2023
10,200
Other active terms on 31 December 2022
Listed companies –
Non-listed companies
BNP Paribas Fortis (risk committee chair)
Fluxys Belgium
De Warande
AZ Sint-Maria-Ziekenhuis Halle
Terms ending on 31 December 2022, but held in the period from 2017 onwards
Argenta Bank- en Verzekeringsgroep
Argenta Assuranties
Argenta Spaarbank
Catholic University of Leuven (audit committee chair)
LRD (audit committee chair)
Plexus
University Hospital of Leuven (audit committee chair)
Z.org Leuven (audit committee chair)
WDP shareholdings as at 27 March 2023
0
Other active terms on 31 December 2022
Listed companies
Miko (audit committee chair)
Non-listed companies
Argen-Co
Argenta Bank- en Verzekeringsgroep
Argenta Assuranties
Argenta Spaarbank
Rega
Terms ending on 31 December 2022, but held in the period from 2017 onwards
ASL
WDP shareholdings as at 27 March 2023
0
has been an independent non-executive director since April 2018. He holds a master’s in Political and Social Sciences and an MBA from the University of Antwerp.
He started his career as investment manager at Dexia Ventures, Dexia’s venture capital fund. He made his first major breakthrough with Clear2Pay, a pioneering financial technology company. Today, Jürgen is managing partner at SmartFin, a venture capital fund which finances and supports growing European technology companies. He is the engine behind various start-ups and scale-ups, and two important Belgian technology events (SuperNova and The Big Score).
His expertise in financial technology, digital innovation and technology in the broader sense contributes to the growth and future-proofing of WDP.
has been executive director and CEO since 1999 and represents the Reference Shareholder, the Jos De Pauw family (via the family company structure RTKA).


His vast experience and expertise in investing in and managing (logistics) real estate and the sector as a whole go hand in hand with his entrepreneurship.
has been a director since 2002 and executive director and CEO since 2010. He is a commercial engineer and holds an MBA.
His banking background gives him strong knowledge of real estate and finance. Before his appointment as CEO, he was CFO of WDP for ten years. Over the years, he has built up expertise in the logistics and supply chain sector. Together with his drive for innovation, his expertise contributes to the expansion of WDP’s sustainable strategy.
Other active terms on
31 December 2022
Listed companies
Materialise
Non-listed companies
Smartfin
Willemen Groep
Ghelamco
GS Pledge Co.
Itineris
Bright Analytics
NG Data
Projective Mensura
Maria DB
Startups.be / Scaleups.eu
Akinon
Deliverect
Royal Antwerp Football Club Recharge.com
Terms ending on 31 December 2022, but held in the period from 2017 onwards
B_Hive Europe
Trendminer
The Glue Clear2Pay
NG Data Europe
Newtec Silverfin Exellys
Finsight Solutions Innovis
Itiviti AB
Unifiedpost Group Pay-Nxt
Vavato
WDP shareholdings as at 27 March 2023
25,000
Other active terms on 31 December 2022
Listed companies
–
Non-listed companies
VBO (Strategy Committee member)
RSC Anderlecht
Terms ending on 31 December 2022, but held in the period from 2017 onwards
Le Concert Olympique
WDP shareholdings as at 27 March 2023
98,338
Other active terms on 31 December 2022
Listed companies
Xior Student Housing
Unifiedpost Group
Catena
Non-listed companies
nanoGrid
Logistics in Wallonia
EPRA (Advisory Board member)
Terms ending on 31 December 2022, but held in the period from 2017 onwards
–
WDP shareholdings as at 27 March 2023
198,608
The Board of Directors, on the advice of the Nomination Committee, proposes to the General Meeting of 26 April 2023 the renewal of the mandate of Rik Vandenberghe for a term of four years as a non-executive and independent director within the meaning of Article 7:87 §1 of the CCA and the 2020 Code. Subject to the approval of his reappointment by the General Meeting on 26 April 2023 and on the advice of the Nomination Committee, the Board of Directors will also reappoint him as Chairman of the Board of Directors for a similar period. Considering his long-standing (international) experience and extensive knowledge, as well as his complementarity with the other directors, his reasoned contributions to the meetings, as well as the leading role he assumes on the Board of Directors with room for discussion and his ability to reach consensus, the Board of Directors believes that this reappointment guarantees that the Board of Directors will be run properly. So, if approved by the General Meeting, its mandate will run until the 2027 General Meeting.
Moreover, on the advice of the Nomination Committee, the Board of Directors proposes to the General Meeting of 26 April 2023 to renew Tony De Pauw's mandate as executive director of the Company for a term of four years, i.e. until the General Meeting of 2027. He is nominated according to the binding right to appoint under Article 15 of the Company’s Articles of Association by the current reference shareholder of the Company, the partnership RTKA. Considering his extensive experience in the logistics and supply chain sector and his sustained leadership as executive director and CEO since 1999, and – importantly in the current economic conditions – his strong commercial strategic acumen, the Board of Directors believes that his reappointment will provide significant added value so that the Board of Directors will be run properly. The Board of Directors acknowledges that in doing so, it deviates from the principle that a director's mandate comes to an end on the occasion of the general meeting in the year in which the director turns 70 (which in Tony De Pauw's case is 14 December 2024). The Board of Directors justifies its decision by the fact that this period of Tony De Pauw’s four-year term of office should ensure that the succession within the Jos De Pauw family can be further and properly worked out and that a smooth transfer to the next generation of this directorship as Reference Shareholder can be achieved.
The appointment procedure for a member of the Board of Directors is described in detail in WDP's Corporate Governance Charter.
The WDP Board of Directors is authorised to perform all activities that are necessary or useful for achieving the object of the Company, with the exception of activities legally falling to the General Meeting.
The Board of Directors sets the strategy and core values of WDP, decides on investments and the financing strategy and monitors the quality of the management. It prepares the WDP financial statements as well as the Annual Report (including Corporate Governance Statement and remuneration report) and convenes the General Meetings of the company. The Board of Directors decides on the use of the authorised capital. Moreover, it is the Board of Directors that decides on the structure of the management of WDP, and the powers individually or collectively conferred on the CEOs and/or other Management Committee members. Finally, the Board of Directors is the body responsible for facilitating effective dialogue with shareholders by means of, for example, transparent communication in press releases, the annual report and other channels.
The Board of Directors, acting as a collegial body, represents the Company in all judicial and extrajudicial acts. The company is legally represented by two directors acting jointly in all judicial and extrajudicial acts. The Board of Directors has delegated the day-to-day management to both CEOs, each of whom may act alone, within the meaning of Article 7:121 CCA. The Company may also be represented by a special proxy.
The Board of Directors operating rules are described in detail in WDP's Corporate Governance Charter.
The Board of Directors met 34 times during the financial year 2022. The increase in the number of meetings is partly explained by the proactive response to macroeconomic developments and opportunities, including the accelerated implementation of a new financing framework with a credit rating for the Company, the strengthening of equity capital (ABB) as well as debt financing (syndicated loan, US private placement). Moreover, the directors focussed on the implementation of the various business plans including the Climate Action Plan and the cybersecurity roadmap.
Essentially, the following points came up for discussion:
1 operating and financial reporting;
1 communications policy;
1 strategy and investment policy;
1 financing policy;
1 risk management policy;
1 composition and evaluation of the Board of Directors;
1 analysis and approval of the 2023 budget;
1 long-term strategy and analysis and approval of the new 2022-25 growth plan;
1 development of a new remuneration policy adjusted to the new 2022-25 growth plan;
1 follow up on the ESG Roadmap, including the concrete targets in the WDP Climate Action Plan;
1 analysis and approval of investment, divestment and development dossiers;
1 analysis and approval of some credit agreements, including the USPP and syndicated loan, as well as the credit ratings due to Moody’s (Baa1) and Fitch (BBB+);
1 internal audit, digitisation, and business processes;
1 analysis and approval of a delegation matrix;
1 analysis, evaluation and implementation of specific actions with respect to specific risks, such as the regulatory risk surrounding the FBI status, cybersecurity, and the general macroeconomic climate (increasing inflation, energy crisis, Russia-Ukraine conflict);
1 drafting of the Board of Directors reports related to the contribution in kind of a claim (in the context of the optional dividend) and the decision to withdraw it;
1 approval of the capital increase by way of an accelerated bookbuild (ABB) within the authorised capital;
WDP financing framework
Further strengthening of the financing policy with flexibility in its implementation given the economic conditions
Based on credit ratings Fitch BBB+ and Moody’s Baa1
Characterised by further diversification of financing
Risk Management
Cybersecurity roadmap on track
WDP Ownership Team
Delegation Matrix roll out in WDP Group for greater empowerment at the business level
One-tier (monastic) governance structure
Evaluation and decision to retain this structure
Attendance rate
Board of directors 96%
1 capital increases by contribution in kind (i) of immovable property of Qualiphar NV, Sedimmo NV and Sedis Logistics NV and (ii) of shares of Sigmo NV, within the scope of the authorised capital;
1 analysis and approval of a 10% stake in the capital of Catena AB by WDP Invest NV/SA;
1 completion of the aforementioned transactions and calculation of the resulting capital increase within the authorised capital; and
1 approval convocation of the Extraordinary General Meeting to renew the approval of authorised capital;
1 a review of WDP's governance structure and a decision on how to maintain it, i.e. a one-tier board of directors;
1 drafting and approving of the 2021 Universal Registration Document.
At least once every three years, the Board of Directors evaluates its own performance, its interaction with the Management Committee and its members, as well as its size, membership and operation and that of its committees.
The evaluation process is led by the chairman and is also monitored by the Nomination Committee. Its objectives include:
1 assessing the operation of the Board of Directors or of the relevant committee;
1 verifying whether important matters are properly prepared and discussed;
1 assessing the effective contribution of each director on the basis of his/her attendance at the Board of Directors meetings or the relevant committee and his/her constructive involvement in the discussions and decision-making. In this evaluation, a minimum individual attendance rate of 75% applies, unless there is a sufficiently substantiated explanation for a lower attendance rate (e.g. health or family circumstances);
1 verifying whether the actual composition of the Board of Directors and committees is appropriate.
The evaluation is conducted through a formal procedure that may or may not be facilitated externally, in keeping with a methodology approved by the Board of Directors.
On the one hand, evaluation of the directors (as members of the Board of Directors and as members of a committee) is ongoing, in particular mutual evaluation amongst colleagues. If a director has doubts about the contribution of another director, the former director may raise this as an agenda item for the Board of Directors or in the relevant committee, or discuss the matter with the chairman of the Board of Directors. The chairman may then take the necessary steps, at the chairman’s own discretion.
On the other hand, all directors are evaluated individually once a year, and more often where applicable, by the Nomination Committee, taking into account factors such as their attendance rate at the Board of Directors and relevant committee meetings (see above for the minimum attendance rate), level of participation in meetings, commitment,
suggestions brought forward outside of meetings, provision of innovative ideas based on their experience on other boards or committees, constructive involvement in discussions and decision-making and their sense for risk identification and mitigation. The Nomination Committee also assesses whether the contribution of each director adapts to changing circumstances.
The Board of Directors takes action based on the results of this performance evaluation. Where applicable, this means nominating new members for appointment, proposing that existing members not be reappointed, or taking measures that are considered useful for the effective operation of the Board of Directors.
IN 2022 | The Nomination Committee came to the joint conclusion for 2022 that the current collaboration between the directors is satisfactory and proactive. The Committee also believes that the interaction between the Board of Directors (through its chair) and the Management Committee (such as through its CEOs and the CFO) is working extremely well, and that there is a steady flow of information. The governance structure appears to have a sound basis. Once again, the Board of Directors managed to consult regularly, either remotely or in person, and, if necessary, on an ad hoc basis, depending on the changing market conditions and opportunities. This was possible thanks to WDP's coherent and lean governance structure, and also to each director’s significant degree of involvement and flexibility. The Board of Directors, at the recommendation of the Nomination Committee, has concluded that each director individually has fulfilled the role of director in a proper and constructive manner. Discussions and decisions show a high level of commitment, with adequate interest in risk identification and management. Moreover, thanks to their mutually complementary skills, the directors form a formidable collective whole.
Based on the information at its disposal, the WDP Board of Directors states that:
1 the members of the Board of Directors and the Management Committee do not share any kind of familial connections;
1 none of the directors or Management Committee members have been convicted of any fraud-related offences, at least during the past five years;
1 none of the directors or Management Committee members, at least for the last five years, have been the subject of official and public allegations and/or penalties imposed by a statutory or supervisory authority (including a recognised professional association), or have ever been declared by a court to be unfit to act as a member of a managerial, supervisory or oversight body of a company or to act within the framework of the management or performance of the activities of a company;
1 no director and no member of the Management Committee has held – for at least the previous five years – an executive function as a senior manager or as a member of the administrative, management or supervisory bodies of any company at the time of its bankruptcy, receivership or liquidation; and
1 none of the directors or Management Committee members have concluded any management or employment contract that provides for a severance payment at the end of the contract, with the exception of what is listed below in the Remuneration report.
The Board of Directors has formed specialised committees to advise it regarding decisions to be taken, to ensure that certain matters are adequately addressed, and if necessary, to bring specific matters to the attention of the Board of Directors. However, decision-taking remains the collective responsibility of the Board of Directors.
The Board of Directors has formed three specialised committees within WDP, each with its own internal regulations: the Audit Committee, the Nomination Committee, the Remuneration Committee and the ESG Committee. Insofar required, the composition of these committees complies with the conditions imposed by the Companies and Associations Code and the Corporate Governance Code. Each committee’s operating rules are described in detail in WDP’s Corporate Governance Charter.
Audit Committee
* At least one member of the Audit Committee must possess the necessary expertise in the field of accounting and auditing and, as an independent director, must meet Article 7:87 CCA. At this time, Cynthia Van Hulle meets these conditions.
The Audit Committee supports the Board of Directors in the fulfilment of its monitoring responsibilities, ensuring control in the broadest sense, including risk control.
IN 2022 | the Audit Committee mainly discussed the following items in the performance of its duties:
1 quarterly review of accounts, periodic press releases and financial reports;
1 analysis of internal management procedures and independent control function along with effective management (based on the internal audit by the external internal auditor and the audit by the statutory auditor), also with a view to the required reporting to the FSMA;
1 the key risks;
1 monitoring of changes in the law and regulations.
Role and responsibilities of the Nomination Committee
The task of the Nomination Committee is to advise the Board of Directors on appointments of directors, CEOs and other members of the Management Committee (on the proposal of the CEO).
IN 2022 | the Nomination Committee mainly discussed the following items in the performance of its duties:
1 evaluating the composition of the current Board of Directors and determining the next steps towards the (near) future; and
1 starting the procedure for evaluating the non-executive directors whose term of office expires at the end of the General Meeting on 26 April 2023 and who are candidates for a renewal of their term of office;
1 nomination to appoint the chairman of the ESG Committee and the Remuneration Committee;
1 annual evaluation of the members of the Board
Directors.
The role of the Remuneration Committee consists of assisting and advising the Board of Directors on all issues concerning the remuneration policy and remuneration techniques for the directors and members of the Management Committee.
IN 2022 | the Remuneration Committee mainly discussed the following items in the performance of its duties:
1 preparation of the remuneration report of 31 December 2021;
1 proposal of a new remuneration policy adjusted to the 2022-25 growth plan;
1 proposal of the targets for the members of the management committee according to their variable remuneration for 2022;
1 proposal of the individual remuneration for the board members and members of the management committee for the 2023 financial year;
The role of the ESG Committee is to support and advise the Board of Directors on a wide range of ESG-related topics (including but not limited to good governance, risk management, cybersecurity, programmes on talent development, diversity and inclusion, use of materials, climate, biodiversity, environmental management systems, energy efficiency, etc.).
IN 2022 | the ESG Committee mainly discussed the following items in the performance of its duties:
1 initiation of its committee and determination of its operating rules;
1 advice with respect to the implementation of the Climate Action Plan;
1 monitoring of the implementation of the Climate Action Plan.
By a decision of the Board of Directors, a Management Committee was formed on 1 October 2019 which acts as an advisory body to the Board of Directors.
The members are appointed by the Board of Directors on the recommendation of the Nomination Committee. Members of the Management Committee may be either natural persons or legal entities. In the case of a legal entity, it must appoint a single permanent representative who will represent it at Management Committee meetings.
The Board of Directors decides the length of the term of each member of the Management Committee at the time of his appointment.
The remuneration, term and conditions for dismissal of a member of the Management Committee are governed by an agreement between each Management Committee member and the Company (with approvals by the Board of Directors and on the recommendation of the Nomination Committee and Remuneration Committee).
The composition of the Management Committee is shown below as of 31 December 2022 where the Management Committee members selected the address of the registered office of WDP NV/SA as their office address, with a view to their role in WDP NV/SA.
The role of the Management Committee is to consult with the Board of Directors and advise them on the day-to-day management of WDP, and always in accordance with the values, strategy, general policy and business plan determined by the Board of Directors.
The role of the CEOs is to work with the other members of the Management Committee on the following:
1 implementing the WDP mission, policy plan and strategic objectives as determined by the Board of Directors;
1 implementing the decisions of the Board of Directors and following up on the performance and results;
1 reporting to the Board of Directors on the progress of all matters and files that fall under the competence of the Board of Directors.
The Board of Directors has delegated the day-to-day management to both CEOs, each of whom may act alone, within the meaning of Article 7:121 CCA. The day-to-day management comprises all actions and decisions that do not extend beyond the needs of the company’s day-to-day proceedings as well as the actions and decisions which, due to their lesser importance or urgency, do not justify the intervention of the Board of Directors.
Each member of the Management Committee is individually responsible for the tasks delegated to them by the CEOs (or, in the case of the CEOs, by the Board of Directors). The Management Committee has no other responsibility than to act as an advisory committee to the Board of Directors.
The Management Committee’s operating rules are described in detail in WDP's Corporate Governance Charter.
The Management Committee completes an annual evaluation of its own functioning, powers and responsibilities. The chairman of the Management Committee shall present and discuss the results of this evaluation with the Board of Directors. The Board of Directors can, if necessary, take appropriate measures. The Management Committee can in turn act on the results of the evaluation by recognising its strengths and improving its weaknesses.
Other active terms on 31 December 2022
REAL ISTIC
We refer to the description above under Board of Directors.
Chief Financial Officer
Born in 1981
has been CFO of WDP since 2011 and is responsible for Finance, Investor relations, IT & Digitisation. Together with the CTO, he is responsible for Energy & Sustainability. He also sits on the EPRA Regulatory and taxation committee on behalf of WDP. He studied at the Solvay Business School at the Free University of Brussels and is a business engineer specialising in Finance. He started his career as a controller at Unilever Bestfoods Belgium before moving on to Delta Lloyd –Bank Nagelmackers, where he gained experience as a buy-side specialist. In 2005, he accepted a position as a sell-side analyst of property shares for Dexia and four years later for KBC Securities.

Other active terms on 31 December 2022
BE-REIT Association (president)
nanoGrid
Terms ending on 31 December 2022, but held in the period from 2017 onwards
WDP shareholdings as at 27 March 2023
28,600
Other active terms on 31 December 2022
J.B. Top Pro Invest
De Witte is WDP’s Country Manager Belgium, Luxembourg and France since 2014. His responsibility in this role is to coordinate the commercial team and the property managers. He holds a Master in Business Economics and a Master in Real Estate Management. He is also a member of the Royal Institute of Chartered Surveyors.
Christoffel has over 25 years of experience in commercial property. He started his career as a real estate broker before joining UK logistics REIT Segro, serving in several commercial roles in Belgium over a ten-year period. From 2007 to 2008, he was the Europe Development Director and Belgium Country Manager at US REIT First Industrial. After this, he worked as the Managing Director of Belgian real estate developer MG Real Estate for five years.
BM De Witte Comaan (joint shareholder)
Terms ending on 31 December 2022, but held in the period from 2017 onwards –
WDP shareholdings as at 27 March 2023
0
After his law studies, Jeroen specialised in export management and logistics. He first spent two years working at the Bar of Antwerp before taking a position as an international legal and financial controller at Den Braven Sealants. In 2001, Jeroen became an international entrepreneur through joint ventures with Romanian, Dutch and Belgian partners. Since 2007, he has been responsible for expanding the WDP property portfolio in Romania as the Country Manager and coshareholder.
Vuurkruisenbizz
Antonino Invest
Apartementele Trandafirul
Asta Pro Invest
Beltech
Brabuild Invest
Joca Invest
NBR Pro Invest
Paulina Invest
San Carlo Invest
Mills Invest
Lamast Invest
Terms ending on 31 December 2022, but held in the period from 2017 onwards –
WDP shareholdings as at 27 March 2023
0
Other active terms on 31 December 2022 –
Other active terms on 31 December 2022
–
Country Manager NL - DE
in 1977
Assink became the Netherlands Country Manager for WDP in 2017 and is heading the WDP office in Breda. Since 2022, he has coordinated the expansion of the WDP property portfolio in Germany. Previously, he worked at real estate broker CBRE for 13 years, serving in multiple roles, such as Business Unit Director/Senior Industrial & Logistics Director and Associate Capital Markets Director. He holds a BSc in Economics Marketing.


De Bosscher
Terms ending on 31 December 2022, but held in the period from 2017 onwards
CBRE (Senior Director)
WDP shareholdings as at 27 March 2023
0
Chief Technical Officer
Born in 1963
as CTO, is responsible for project development and property management in WDP. Together with the CFO, he is also responsible for Energy & Sustainability. He is also a part of the EPRA PropTech & Innovation Committee (EPRA) on behalf of WDP. He has years of experience in project management and development in numerous roles at renowned companies. For instance, he was Technical Director at Armonea, Project Manager at Besix, and Project Coordinator at the University Hospital of Leuven. He also spent over 14 years working internationally as a Project Coordinator for DEME. After his studies in Applied Science (Civil Engineer, Architect), he was an assistant at the University of Ghent.
Terms ending on 31 December 2022, but held in the period from 2017 onwards –
WDP shareholdings as at 27 March 2023
1,350
In 2022, WDP started implementing a delegation matrix that defines the unique powers of decision and representation for the Company. Partly due to the Company's strong growth and further internationalisation, an appropriate governance framework for decision-making is one of the building blocks needed to achieve greater ownership and responsibility. This puts the company in a better position to assess and manage risks, make decisions and act more decisively and flexibly. The Board of Directors also supports management's quest for greater ownership and responsibility in decision-making in the Company. Of course, the necessary safeguards are in place when using the Delegation matrix, including consistent use of the 4 Eyes Principle, an assessment as a part of an internal audit and as a part of risk management policies.
As a basic principle, each member of the Management Committee is individually responsible for certain aspects of the day-to-day management of the Company and its business:
1 to this end, the Board of Directors delegates special powers of decision and representation to the two CEOs;
1 the allocation of individual and special powers of decision and representation to the other members of the Management Committee via a sub delegated by the two CEOs.
The delegation matrix is described in detail in WDP's Corporate Governance Charter.
Diversity in all of its facets (cultural, gender, language, professional experience, etc.), equal opportunity and respect for human capital and human rights are intrinsic to the WDP company culture. The company firmly believes that these values contribute towards balanced interaction, enrichment of vision and thinking, innovation and an optimal working environment.
WDP has set some diversity guidelines for members of the Board of Directors and the Management Committee. These guidelines are reflected in the internal rules of the Board of Directors and the Nomination Committee, describing the procedure for nomination and evaluation of directors and members of the Management Committee. The selection process for members of the Board of Directors and Management Committee strives to ensure complementary skills, knowledge, expertise, and diversity in terms of education, knowledge, gender, age, experience, nationality, etc.
This results in a Board of Directors that is highly balanced in its skills, knowledge and experience. The membership of the Board of Directors (two women and four men) also meets the legal provisions on gender diversity (Article 7:86 CCA). The members of the Management Committee also represent a balanced team, each with his own required expertise (see below for their curriculum vitae), albeit with regard to gender. However, it must be taken into account that the Management Committee is assisted by a dedicated team of managers within corporate Shared Services.
WDP relies on a fairly small team with a flat structure, so it is more appropriate to consider diversity across the entire group. At the Team WDP level, there is a nice diversity in terms of gender, nationality, age, seniority and educational background.
Introduction
This remuneration report was drafted according to the provisions of 3:6 (§3) CCA and is a special part of the WDP Corporate Governance Statement. It was also prepared in the spirit of the current draft of the non-binding guidelines of the European Commission for the standardised presentation of the remuneration report.1
It covers the period from 1 January 2022 to 31 December 2022.
This remuneration report describes the remuneration of and the application of the remuneration policy to the members of the Board of Directors and Management Committee, as well as on the actual performance of the members of the Management Committee compared to the targets set.
On April 27, 2022, the General Meeting of WDP approved the current remuneration policy by a large majority (92.99% of those present voted to approve the motion). This remuneration policy went into effect as of 1 January 2022 and is fully aligned with the 2022-25 growth plan and is reflected in the Corporate Governance Charter.
The same meeting also approved the remuneration report for the performance year 2021 (under the previously applicable remuneration policy) with a large majority of 93.67% of the votes present. Moreover, there were no specific comments to be taken into account in the remuneration for performance year 2022.
Focusing on sustainable business as a long-term real estate partner for the logistics sector
Just like WDP’s strategy of open and transparent communication towards all of its stakeholders
SIMPLE
Just like WDP’s business plan, it is always based on defined targets
The total remuneration of the non-executive members of the Board of Directors corresponds to the amounts approved by the General Meeting of 27 April 2022. These amounts are in line with WDP's remuneration policy: a fixed directors' fee that takes account of each individual director’s responsibilities and is considered sufficient to attract the right profiles to contribute to WDP's strategy.
The total remuneration in 2022 of the members of the Management Committee is also in line with the remuneration policy. This remuneration consists of a fixed remuneration and a variable remuneration.
1 The fixed remuneration is in line with the provisions of the remuneration policy and with the amounts set by the Board of Directors (on the recommendation of the Remuneration Committee) in January 2022.
1 The short-term and long-term variable remuneration is also in line with the remuneration policy. The criteria for the short-term and long-term variable remuneration is linked to WDP’s financial performance and ESG performance. In this way, the remuneration policy emphasises the creation of stable and sustainable cash flows.
The Board of Directors sets the fixed remuneration annually, taking into account factors such as:
1 position and corresponding responsibilities
1 social security status, experience, competencies
1 local regulations
1 benchmark provided by the Remuneration Committee
The annual remuneration may be reviewed based on changes in the preceding parameters.
Quantitative Qualitative
Each year, the Board of Directors determines the variable remuneration as a percentage of the annual fixed remuneration.
The annual variable remuneration in cash (i.e. the amount related to the 100% achievements of the targets) amounts to:
1 for the CEOs and CFOs: 100% of the annual fixed remuneration.
1 for the other members of the Management Committee: 80% of the annual fixed remuneration.
An overview of the performance targets for 2022 (short-term) and 2022-2025 (long-term) is shown below.
annual payment
125% cap
EPS 2022: 1.20 euros
Portfolio growth 2022: +500 million euros
Occupancy rate 2022: 98%
Net debt/EBITDA (adj.) 2022: approx. 8x
ESG ratings & index
Renewable energy 2022: +50 MWp
partly deferred payment
125% cap
Min. 1 ESG KPI
Min. 1 Risk management policy KPI 2022: Develop programme +100 Track
Progression in net-zero corporate offices 2025
Roll out within WDP Group:
(i) updated Enterprise Risk Management Policy
(ii) cybersecurity action plan
Quantitative Qualitative
EPS 1.50 euros
Portfolio growth to 8 billion euros
Occupancy rate >98%
Net debt/EBITDA (adj.) approx. 8x
ESG ratings & index
Renewable energy +150 MWp
100+ Track: ownership, intrapreneurship, innovation embedded in #TeamWDP
Corporate offices: net zero Digital organisation+ New client-oriented services
The table below sets out the total remuneration of the directors, CEOs, and, on a collective basis, other members of the Management Committee.
1 The executive directors are remunerated only in their capacity as CEO and not in their capacity as members of the Board of Directors.
2 The basic remuneration for the CEOs and non-executive directors includes an expense allowance of 5,000 euros per year.
3 So, the amounts stated here are employer’s contributions to the WDP group insurance (Defined contribution plan) for the year 2022, and are in addition to the variable remuneration received.
4 These additional benefits consist of a company vehicle and a smartphone for example, with a benefit in kind calculated for each one.
5 This relates to the deferred payment of the long-term variable remuneration over the period 2019-2022 (previous remuneration policy).
The fixed remuneration of the members of the Management Committee for 2022 as shown in the above table Total Remuneration is equal to the remuneration as approved by the Board of Directors on the recommendation of the Remuneration Committee in January 2022.
The annual variable remuneration is 100% of the annual fixed remuneration for the CEOs and CFOs of the annual fixed remuneration, 80% of the annual fixed remuneration for the other members of the Management Committee, upon 100% achievement of the performance targets.
The short-term targets set by WDP in its plan are underpinned by linking the shortterm performance targets of members of the Committee to the Company's financial performance, specifically at least each of the following criteria: EPS, portfolio growth, occupancy rate, net debt/EBITDA; as well as ESG performance (+50 MWp renewable energy and achievement for specific ESG ratings). These are weighted to 40% (co-CEOs and CFO) or 50% (other Management Committee members).
| WDP's financial performance criteria were adopted by the Audit Committee in January 2023. Based on this, the Board of Directors – on the advice of the Remuneration Committee – determined in January 2023 that the short-term quantitative performance objectives were achieved and above target.
The following performance thresholds and ceilings were used: < threshold threshold target ceiling
0 50% 100% 125%
The Board of Directors set at least one performance target for the Management Committee members regarding the implementation of the WDP ESG Roadmap and at least one regarding the implementation of WDP’s risk management policy. Furthermore, objectives were also set for operating activities and business lines (this at both the group and individual level). These are weighted to 20% (co-CEOs and CFO) or 25% (other Management Committee members).
PERFORMANCE 2022 | Based on the achievements in 2022, as explained in detail in this annual report, the Board of Directors – on the advice of the Remuneration Committee –assessed in January 2023 that the short-term qualitative performance objectives were achieved on target.
Long-term performance targets were linked to achieving the 2022-25 business plan using both quantitative and qualitative sustainability and financial targets. For more information about the targets set, see pp. 132.
Achieving the quantitative and qualitative performance targets results in the following payments for performance year 2022:
1 Depending on the position where the CFO has a weighting of 40% and 20% that applies in the short term and 40% in the long term. The other members of the Management Committee have a weighting of 50% and 25% for the short term and 25% for the long term.
Shareholdings
1 This number corresponds to a multiple of 8 times his base remuneration for 2022 (WDP share closing price on 31.12.2022, namely 26.7 euros). Naturally, Tony De Pauw via RTKA Maatschap, as Reference Shareholder, retains the majority of his participating interest in the Company.
2 This number corresponds to a multiple of 8 times his base remuneration for 2022 (WDP share closing price on 31.12.2022, namely 26.7 euros).
For the sake of completeness, reference is made to the explanation of the deviation from the recommendations of 2020 Code - principles 7.6 and 7.9.
In 2022, Frank Meysman’s mandate came to an end at the General Meeting of 27 April 2022. In that regard, no severance pay was paid.
Apart from this there were no departures from the Board of Directors or the Management Committee in 2022.
The remuneration policy gives an overview of the various departure times and contractually provided severance payments for members of the Management Committee.
No use was made in 2022 of the contractually provided clawback mechanism in the agreements with the co-CEOs and the CFO.
This mechanism entitles WDP to reclaim a variable remuneration from the beneficiary, in full or in part, up to 1 year after its payment, if it turns out during that period that the payment took place on the basis of incorrect information about meeting the performance targets on which the variable remuneration is based, or about the circumstances on which the variable remuneration was made dependent, if such incorrect information was also due to fraud on the part of the beneficiary.
In the implementation of the remuneration policy in 2022 there was no deviation from the procedures provided for therein, nor were any deviations permitted in the sense of Article 7:89/1, §5 of the CCA.
As part of its annual analysis of the remuneration policy and in line with the decisionmaking process provided for in the remuneration policy, the Board of Directors – on the advice of the Remuneration Committee – decided on 23 January 2023 to implement a one-off indexation of remuneration across the entire workforce (and thus not only the legally required indexation for the Belgian workforce, but also for the workforce in the Netherlands, Romania and Germany), as well as for members of the Management Committee and independent directors. This decision was driven by the macroeconomic environment in which WDP and TeamWDP found itself and the viewpoint of treating everyone within WDP in the same way regardless of location and/or mode of employment.
Thus, with regard to non-executive directors, a proposal will be submitted to the General Meeting on 26 April 2023 to approve the increase in the remuneration of non-executive directors. This is an increase from 50,000 euros to 55,000 euros (including expense allowance in the amount of 5,000 euros) on an annual basis for the non-executive directors and from 100,000 euros to 110,000 euros (including expense allowance in the amount of 5,000 euros) on an annual basis for the chairman.
The performance targets for 2023 et seq. were approved by the Board of Directors – on the advice of the Remuneration Committee – on 14 February 2023. We would like to note that we took into account the fact that – as explained in Chapter 4. Performance and trends on pp. 22 – we will focus on less but more profitable growth of the property portfolio. Moreover, the Board of Directors considers that WDP has achieved a certain
Quantitative
Qualitative
maturity in terms of ESG ratings and that these should no longer qualify as an element of remuneration. These now need to be maintained (and where possible improved). The remuneration will continue to be linked to metrics that support WDP in its plan to further differentiate itself within the logistics property market.
annual payment
125% cap
EPS 2023: 1.35 euro
Portfolio growth 2023: +250 million euros
Occupancy rate 2023: 98%
Net debt/EBITDA (adj.) 2023: approx. 8x
Renewable energy 2023: +50 MWp
Quantitative
Min. 1 ESG KPI
Min. 1 Risk management policy KPI
2023:
Start implementation programme +100 Track Progression in net-zero corporate offices 2025
Roll out within WDP Group:
(iii) updated Enterprise Risk Management Policy
(iv) cybersecurity action plan
Compliance programme development
Qualitative
partly deferred payment 125% cap
EPS 1.50 euros
Occupancy rate >98%
Net debt/EBITDA (adj.) approx. 8x
Renewable energy +150 MWp
100+ Track: ownership, intrapreneurship, innovation embedded in #TeamWDP
Corporate offices: net zero Digital organisation+ New client-oriented services
1 Occasional large fluctuations at the level of the CEOs are entirely due to the fact that an extraordinary bonus was given in 2019 and a settlement took place according to the old remuneration policy. Moreover, as of 2020, a new remuneration policy has been in place with a deferred long-term variable remuneration.
2 This increase is explained by the fact that Jürgen Ingels received a remuneration in 2018 proportional to the basic remuneration for 8 months as his mandate started in April 2018.
3 As the Management Committee was only formally instituted as of 1.10.2019, the evolution of the total remuneration of the Management Committee will be reported for the first time in the Annual Report for 2020.
4 The average employee remuneration is calculated based on Remuneration and direct social benefits divided by the Average number of staff (in FTE) as shown in Note XXIII. Average workforce and breakdown of staff costs in the annual accounts (i.e. on a consolidated basis). This comparison starts in 2018 as WDP Romania S.R.L. has been included in the scope of consolidation as of 1 January 2018.
5 The highest remuneration is currently that of Joost Uwents. The lowest remuneration of employees is calculated based on the workforce (in FTE) as shown in Note XXIII. Average workforce and breakdown of staff costs in the annual accounts (i.e. on a consolidated basis).
6 The large surges are attributable entirely to the fact that there is a settlement according to the remuneration policy for the growth plan 2019-23 where the long-term variable remuneration for each member of the Management Committee was set to 125% of the long-term bonus initially planned over the three performance years. This will be paid out at a rate of 66% in 2022 and 34% in 2023 in accordance with the same remuneration policy. There was no such long-term variable remuneration in performance year 2020 because the performance period to acquire it was still ongoing at that time.
7 This decrease is explained by the fact that Frank Meysman’s mandate came to an end in April 2022.
With respect to preventing conflicts of interest, the Company is subject to the provisions of the CCA and the special provisions of the GVV/SIR legislation regarding an integrity policy and certain transactions referred to in Article 37 of the GVV/SIR Act. The directors and members of the Management Committee must adhere to all statutory and customary principles relating to conflicts of interest and comply with the prevention policy for conflicts of interest. In any case, WDP imposes on every member of the Board of Directors and Management Committee that the occurrence of conflicts of interest, or the perception of such conflicts, must be avoided as much as possible. When the Board of Directors or the members of the Management Committee take a decision, the members do not pursue their personal interests. Furthermore, they do not use business opportunities that are intended for the company for their own benefit.
The directors have a duty to protect the interests of all shareholders equally. Each director acts according to the principles of reasonableness and fairness. Directors nominated by a Reference Shareholder (on the basis of the binding nomination right) must ensure that the interests and intentions of said shareholder are sufficiently clear and are made known to the Board of Directors in a timely manner.
The rules on the prevention of conflicts of interest are described in detail in the Corporate Governance Charter
IN 2022 | An excerpt from the minutes of the Board of Directors' meeting of 17 October 2022 regarding the capital increase via an exempt private placement
Before commencing deliberations on the agenda, the Board took note of the fact that the current (non-controlling) WDP reference shareholder, the management body RTKA, being the family partnership of the Jos De Pauw family (the Jos De Pauw Family) has expressed its intention to submit an order of 20 million euros to subscribe for new shares in the context of the proposed Offer (see below) (the Subscription Application). Also taking into account the conditions of the possible Subscription Application (including the fact that it would occur at the final issue price) and the Board's intention to expressly provide in the solicitation, allocation and pricing protocol to expressly provide that in the allocation of the new shares, the Jos De Pauw Family will be treated with certainty on the same footing (i.e. at the same estimated allocation percentage of the expressed demand) as “long only” investors who were involved in the market sounding that would be carried out prior to the intended Offer, the Board would, insofar necessary, partially waive the statutory preferential right of the existing shareholders in favour of the Jos De Pauw Family. The Board also refers, insofar necessary, to the statement of Mr Tony De Pauw prepared pursuant to Article 7:96 of the CCA dated 17 October 2022. Such statement concerns his possible conflict of interest with regard to the intended waiving of the statutory preferential right, insofar necessary, partly in favour of, the Jos De Pauw Family, in the context of the intended Capital Increase (as defined below), the determination of the final issue price per new share and the allocation of the new shares (including the possible allocation of new shares to the Jos De Pauw Family pursuant to the Subscription Application). If and to the extent that new shares are allocated to the Jos De Pauw family pursuant to the possible Subscription Application and depending on the final issue price of the new shares, the Jos De Pauw family will be able to subscribe to a certain number of new shares at that final issue price. Consequently, the Jos De Pauw family, of which Mr Tony De Pauw is a member, could have diluted its participating interest to a limited degree due to the Capital increase. Pursuant to Article 7:96, §1, fourth paragraph (and Article 7:97, §4, second paragraph) of the CCA, Mr Tony De Pauw will not participate in the deliberation and/or vote on these matters. Due to governance considerations, Mr Tony De Pauw has decided, by extension, not to participate in any Board meeting deliberating and/or voting on the intended Offer.
“CONFLICT OF INTEREST REGULATION – ACKNOWLEDGEMENT OF MR TONY DE PAUW'S STATEMENT PURSUANT TO ARTICLE 7:96 CCA
Mr Tony De Pauw has indicated in his statement, acknowledged by the other members of the Board, that the Board's approval of the proposed waiving of the statutory preferential right, insofar necessary, partly in favour of the Jos De Pauw Family (and by extension, the determination of the issue price and the allocation of the new shares) in the context of the intended Offer, would be in the interest of the Company, in particular considering the following circumstances: (i) The intention to submit the Subscription Application, which is partly behind the intended waiving of the statutory preferential right, insofar necessary, partly in favour of the Jos De Pauw Family, would support the success and pricing of the Offer. (ii) The waiving of the statutory preferential right, insofar necessary, partly in favour of the Jos De Pauw Family and the subsequent possible allocation of new shares to the Jos De Pauw Family pursuant to the Subscription Application would not, in itself, in respect of the Capital Increase through the Offer, result in any additional dilution of the rights of the existing shareholders (other than the Jos De Pauw Family). Nor would they, in respect of the Capital Increase through the Offer, result in additional financial dilution as all new shares will be issued at the same issue price. The Jos De Pauw Family would place its order at strike, meaning it would in no way intervene in the formation of the issue price.”
IN 2022 | An excerpt from the minutes of the Board of Directors meeting of 24 January 2022 regarding the determination of the remuneration of the co-CEOs
“PROPOSAL TO AWARD VARIABLE REMUNERATION FOR PERFORMANCE YEAR 2021 TO THE CO-CEOS, AS WELL AS LONG-TERM VARIABLE REMUNERATION AWARD TAKING INTO ACCOUNT THE EARLY ACHIEVEMENT OF THE 2019-23 GROWTH PLAN.
The Board of Directors took note of the statements of Mr Tony De Pauw and Joost Uwents pursuant to Article 7:96 of the CCA, regarding the interest of a patrimonial nature that could conflict with the decisions mentioned under this agenda item. Tony De Pauw and Joost Uwents refer in their respective statements to the potential conflict of interest of a patrimonial nature in the context of the allocation of the variable remuneration for performance year 2021 and the determination of the remuneration for performance year 2022. Copies of the statements of Tony De Pauw and Joost Uwents are attached to these minutes. Tony De Pauw and Joost Uwents left the meeting before the discussion and decision on this item began.
The chairmen of the Remuneration Committee and the Nomination Committee respectively explained their proposals regarding the allocation of the variable remuneration for performance year 2021 to the co-CEOs, as well as regarding the fixed (and resulting variable) remuneration for performance year 2022 with the corresponding short- and long-term performance targets.
After discussion, the Board of Directors decided on:
1 Awarding a variable short-term remuneration for performance year 2021 in line with the remuneration policy in the amount of 337,400 euros for Joost Uwents and in the amount of 220,500 euros for Tony De Pauw; hereby taking into account the achievement of short-term performance targets where the CEOs achieved the above target.
1 Awarding the variable long-term remuneration resulting from the early achievement of the growth plan 2019-23 (in particular, achieved in 2022), settling 125% of the initially foreseen total long-term bonus (over the period 2020-2021-2022) according to the terms of the remuneration policy, in the amount of 723,000 euros for Joost Uwents and in the amount of 472,500 euros for Tony De Pauw; hereby taking into account the achievement of long-term performance targets with the CEOs achieving the above target, all the more so due to the early achievement of the 2019-23 growth plan.
1 Setting the following performance targets for performance year 2022: EPS, portfolio growth, occupancy rate, and other quantitative and qualitative performance targets.
1 Setting the fixed remuneration for performance year 2022 at 350,000 euros for Tony De Pauw (and therefore 350,000 euros variable as target amount, i.e. 100% of fixed remuneration) and at 700,000 euros for Joost Uwents (and thus 700,000 euros variable as target amount, i.e. 100% of fixed remuneration).”
The procedure pursuant to Article 7:97 CCA was applied within the context of the exempted accelerated private placement with international qualified and/or institutional investors with composition of an order book (accelerated book building) dated 19 October 20222 within the authorised capital with cancellation of the preferential right partly in favour of the current reference shareholder of WDP, the Jos De Pauw Family, and without application of the irreducible allocation right (the Capital Increase). The Jos De Pauw Family is a party related to WDP in the sense of Article 7:97 CCA. In accordance with Article 7:97 CCA, a committee of independent directors of the Company was asked to issue a written and detailed motivated opinion on the Capital Increase. The committee of independent directors came to the joint conclusion that the intended Capital Increase was in the best interests of WDP and its shareholders.
Potential functional conflicts of interest arose, particularly in the context of the optional dividend offered on 27 April 2022 to the shareholders and under which certain directors as well as the Reference Shareholder derived some capital benefit from it, because of their capacity as shareholders of WDP. The Board of Directors approved the optional dividend, given that this transaction was in the interest of WDP (the capital increase accompanying the transaction boosted WDP shareholders’ equity and, consequently, reduced its gearing ratio, which is limited by law). In the end, this transaction was not completed and all shareholders were paid the dividend in cash.3
Functional conflicts of interest may have arisen, particularly in the context of the acquisition of VIB Vermögen AG's shares in WVI GmbH due to the capacity of WDP Invest NV/SA (perimeter company of WDP NV/SA) and VIB Vermögen AG (in its capacity
as a co-shareholder of WDP Invest NV/SA in WVI GmbH). The acquisition of the shares of VIB Vermögen AG by WDP Invest NV/SA took place on 1 July 2022 under normal market conditions and in accordance with the terms and conditions laid down in the joint venture agreement dated 18 December 2019.
Functional conflicts of interest may have arisen, particularly in the context of the participation in a capital increase of Catena AB, due to the capacity of WDP Invest NV/SA (perimeter company of WDP NV/SA) and Catena AB (a company with which WDP Invest NV/SA has a shareholder relationship). WDP Invest NV/SA wished to perpetuate its existing 10% stake and consequently subscribed pro rata to the capital increase dated 29 October 2022 of Catena ABB through an accelerated private placement with the composing of an order book, whereby the issue price and the final number of new shares to be issued was determined by the Catena board of directors in consultation with the joint global coordinators and bookrunners taking into account the provisions in a solicitation, allocation and pricing protocol. The transaction took place under normal market conditions for similar transactions.
Other functional conflict of interest situations within the framework of the WDP Corporate Governance Charter
IN 2022 | There were no such conflicts of interest in 2022.
The WDP Corporate Governance Charter states very clearly that the members of the Board of Directors, as well as the members of the Management Committee, must exercise the required discretion and, in cases of insider information, the required confidentiality with regard to all information and documentation obtained in the context of their role as a member of the Board of Directors and/or the Management Committee.
The code of conduct for financial transactions is included in a separate business code: the Dealing Code. The Dealing Code is intended to inform its readers of the regulations on market abuse and the resulting obligations on (i) WDP in its capacity as the issuer of financial instruments and (ii) everyone carrying out activities within or for the WDP Group who have access to sensitive information. With this policy, WDP strives to prevent market abuse by the persons in question.
Each employee, director or member of the Management Committee who fulfils a role in or on behalf of WDP receives an explanation of this Dealing Code from the compliance officer, as part of the onboarding procedure, and is also asked to sign this Dealing Code as read and agreed.
It is also the compliance officer who must ensure compliance with these rules to limit the risk of market abuse with insider information. For this purpose, the officer maintains insider lists as specified in European regulations and follows the procedures for reporting transactions by supervisors or the questions for trading during blocked or closed periods. The officer does this in consultation with the Market Disclosure Committee. The Corporate Governance Charter also provides for a reporting procedure in case someone would like to report an actual or potential breach of the Dealing Code or other regulations.
The WDP Employee Code of Conduct defines the expectations of staff regarding their actions for or on behalf of the company. The Code of Conduct, in conjunction with the Human rights policy and the Anti-Bribery and corruption policy, reinforces the commitment of everyone within #TeamWDP, regardless of contract type or work location, to help build a strong company culture. A culture built on mutual respect, integrity and ethics.
WDP maintains a complaint management procedure to properly address formal grievances raised by stakeholders about WDP, our property, our services, or any processes we use. A #SpeakUp procedure is used for staff within the WDP group, for any member of the Board of Directors or for any member of the Management Committee. Concerns can be reported here about (possible) violations of the law, ethical standards or procedures, such as the Corporate Governance Charter, the Employee Code of Conduct, the Supplier Code of Conduct, the Human Rights Policy, etc.
WDP organises its internal control and risk management on the basis of the principles of the Enterprise Risk Management (ERM) model developed by COSO (Committee of Sponsoring Organisations of the Treadway Commission). This involves mapping out a control environment, conducting an analysis of the risks to which WDP is exposed, estimating their impact on WDP and determining the degree to which WDP has control over these risks and the actions the company is taking to mitigate these risks. Finally, internal control is assessed annually.
When it comes to risk management, WDP applies an integrated approach based on the ‘three lines of defence model’. This model determines how specific responsibilities can be assigned within WDP’s organisation with a view to achieving WDP’s objectives and control of the associated risks.
This methodology contributes to reinforcing the risk culture, taking responsibility for managing risks and internal control and continued optimisation and integration of independent control functions (risk management, compliance, internal audit).
Business itself is responsible for all risks of its own processes and must ensure their identification and effective controls. Here, business ensures that the right controls are conducted properly, that the self-assessment by the business is qualitatively adequate, that risk awareness is sufficient, and that adequate capacity is allocated to risk matters.
Risk management is an integral part of running the company. It ranges from day-to-day financial and operational management – including the four-eyes principle – analysis of new investment files and formulation of strategy and objectives, to strictly and firmly established decision-making procedures. For this reason, risk management is the responsibility of the entire WDP Group, i.e. across all layers of the organisation, with different responsibilities at each level.
These functions offer support to business and management by applying expertise and formulating an opinion independently of business with regard to the risks facing WDP: risk management function, compliance function, financial control function, IT security function.
These functions offer proper certainty that business itself (via first-line management) has its risks under control. The primary responsibility naturally still lies with the first line. For this, the second line functions serve to identify, measure and report risks.
The internal audit can be understood as an independent assessment function embedded in the organisation, focusing on examination and evaluation of proper functioning, effectiveness and efficiency of the processes, procedures and activities of WDP. This may involve areas such as operational matters (quality and suitability of systems and procedures, organisational structures, policy lines and methods and resources used to meet objectives), financial matters (reliability of accounting, annual financial statements
and the financial reporting process), the compliance with applicable accounting and other regulations, management matters (quality of the management function and staff services with respect to company objectives), as well as the compliance function and risk management function.
The Board of Directors set up an Audit Committee, Remuneration Committee, Nomination Committee and an ESG Committee. A Management Committee was also created in October 2019.
WDP currently has three operational platforms: Belgium/Luxembourg/France, the Netherlands/Germany and Romania. Each platform performs the following functions: Sales & Business Development, Property Management, Contracting, Back Office. These teams can count on the support of the following services: Project Development, Finance, IT, Investor Relations, Legal, Marketing, Human Resources and Administration. This structure is explained in an organisational chart and features a clear internal segregation of duties.
Notwithstanding the further professionalisation and considerable reinforcement of the teams in recent years – because of the growth of the company – the size of the team remains limited, where an overbearing structure and excessive formalism must be avoided, in view of factors such as the nature of the activities of the company. A certain degree of flexibility is still indispensable, with people on call to step in for others for specified tasks, according to the urgency of the case at hand. The responsibilities are however strictly defined and current issues are monitored by means of ongoing daily consultations.
The independent control functions, as also implemented by the GVV/SIR legislation, are fulfilled in a suitable and proportionate manner, and always in accordance with the nature, scope and complexity of WDP’s activities.
1 The independent compliance function is performed by WDP General Counsel Johanna Vermeeren, appointed for an indefinite term. The compliance officer reports directly to the CEO, Joost Uwents.
1 At WDP, CFO Mickaël Van den Hauwe serves in the role of risk manager, appointed for an undetermined period. The risk manager reports directly to the Audit Committee.
1 WDP has entrusted the internal audit function to an external legal entity through the appointment of an independent consultant, namely BDO Advisory BV, permanently represented by a single natural person, Mr Christophe Quiévreux. In his role as manager bearing final responsibility for the internal audit, Rik Vandenberghe is responsible, on behalf of WDP, for supervision of the internal audit function assigned to the external internal auditor.
The effective leaders (Joost Uwents, Tony De Pauw and Mickaël Van den Hauwe) are responsible for the organisation of internal control under the supervision of the Board of Directors of WDP.
Aside from general organisation of the internal audit structures, the Audit Committee has a special task with regard to internal audit. It supports the Board of Directors in the fulfilment of its monitoring responsibilities, ensuring control in the broadest sense, including risk control. The responsibilities, membership, powers and functioning of this Audit Committee are described in the Internal Rules of the Audit Committee, available in the Corporate Governance Charter.
WDP is convinced that risk management should be an integral part of the company culture to foster an environment in which people are motivated to identify and address risks and ensure the necessary transparency with regard to any possible risks. To this end, WDP has drawn up and implemented a risk management policy that applies equally and fully to its entire operations (i.e. across all WDP entities, geographies, operations, etc.).
In 2021 the Group’s enterprise risk management policy was reviewed, enhanced and brought into line with the current complexity, dimension and strategic goals of WDP, as well as changing contexts, such as regulations, ESG, and climate change.
First of all, the Risk Manager has drawn up a risk register that serves as an overview of the risks the business faces. Risks are categorised and labelled (trend, term, source, type). This risk register has been challenged and validated by the Management Committee and the Audit Committee, before being presented to and approved by the Board of Directors. Following its approval, the Board of Directors has determined the risk appetite for each of the risks and – after a risk assessment – defined the risk value of each risk.
The Board of Directors will conduct a thorough review of WDP's risk management and risk register each year because such periodic review and monitoring ensures we can guarantee that WDP's risk management continues to improve (e.g. identify new risks, strengthen WDP's resilience, adjust the level of risk appetite, align the Company's risk management with WDP's strategic objectives, assess the adequacy of the risk assessment tool, etc.).
Top-down strategic risk management
Risk Governance
Board of Directors
Set the risk culture
Review external environment
Monitor the company risk management with an annual in-depth review
Determine risk appetite
Agree the Enterprise Risk Management Policy and the risk assessment tool
Discuss WDP Group’s key risks and emerging risks with the risk manager and Management Committee
1st
Risk management
Management Committee
Identify and monitor key risks and emerging risks
Evaluate proposed strategies against risk appetite
Design, implementation and evaluation of the system of internal control, and for ensuring its operational effectiveness
Risk Ownership Business units and risk ambassadors
Identify and assess risks
Respond to risks
Monitor risks
operational risk management
Bottom-up
Ensure operation effectives of key controls
Risk manager
Assist management with the identification and assessment of key risks and emerging risks
Aggregate risk information and submit to the Management Committee and Board of Directors
Monitor the risks and response plans in line with the risk appetite
Create a general risk framework and common language as well as provide direction on applying that framework
Provide guidance and training
Facilitate risk escalations
Support roles: compliance officer, financial controller, IT security
Provide guidance/support to the risk manager and the business in identifying, assessing, and reporting risks.
Audit Committee
Assist the Board of Directors in balancing risk exposure against risk appetite
Review the efficiency of the company’s risk management and internal control processes
Internal auditing
Providing assurance on the efficacy of the company’s risk management
Test key controls and risk response plans for key risks
On a quarterly basis, the CFO, acting as risk manager, conducts an analysis and evaluation of these risks through the various departments and countries, with attention to the potential negative impact, the expected value in terms of materialisation of the risk, as well as the degree of control of the risk. This analysis is done in collaboration with the compliance officer and the different risk ambassadors across the business, supported where necessary by specialised (external) advisors.
WDP uses a risk assessment tool to ensure risks are evaluated consistently. Within this context, a scenario analysis is also drawn up based on the expected value of each scenario and the possibilities to avoid or remediate a risk, insofar as this can be influenced.
Based on the above evaluation, the implementation of risk management can be done through different methods: prevent, mitigate, share, preserve.
Risk monitoring is embedded in the process of enterprise risk management and the responsibility for monitoring is at the different levels of the organisation: #TeamWDP, the Management Committee, the Board of Directors.
The result of the quarterly analysis, the evaluation of the risks as well as the formulation of concrete recommendations to the other departments of WDP, is formalised in a risk dashboard under the supervision of the risk manager, which is discussed in detail in the Management Committee. Where necessary, the risk dashboard is further adjusted for subsequent submission by the risk manager to the Audit Committee and Board of Directors for pointing out the most significant risks affecting WDP’s strategic goals. Taking into account the input of the risk manager, the Audit Committee and Board of Directors conduct quarterly evaluations of the risks to which WDP is exposed and take the necessary decisions based on these evaluations (such as with regard to setting the interest rate hedging strategy, evaluation of tenant risks, etc.
WDP values transparency and thus communicates to its stakeholders on this topic of risk and risk management both on an ad hoc basis as through the periodic reporting in the quarterly press releases. The annual report also includes a list of specific and material risk factors with their description and an estimate of the potential impact of these risks, as well as the mitigating factors and some examples of key risk indicators.
The various departments of the Company perform checks in response to the identified risks, as shown in Chapter 8. Risk factors.
1 Lease: constant monitoring of the lease vacancy rate, end dates of lease agreements and the risks and opportunities related to rental income, constant monitoring of the client portfolio and regular analysis of customer solvency. Monthly screening of the amounts and validity of the lease deposits of all tenants.
1 Property portfolio: maintenance of a healthy portfolio diversity in various dimensions, such as customers, building types, locations and also continuous monitoring of portfolio quality and sustainability. This is managed based on frequent internal reporting as well as collaboration with renowned construction partners, architects and engineering firms.
1 For each commitment of the company towards third parties, the double signature principle (the four-eyes principle) is applied within the limits of the delegation of powers, for the purchase of property, leases, all types of orders and approvals of invoices and payments.
1 Operational processes, both for the existing portfolio and for new investments, are based on workflows that are harmonised within the WDP Group and are audited regularly.
1 Budget: conducting an extensive quarterly variation analysis (actual versus the preceding period) and updating of this by the Audit Committee and Board of Directors.
1 Purchasing policy: all orders must be preceded by a purchase order and must then be approved by validation of the invoice via a digital approval flow with audit log and application of the four-eyes principle.
1 ERP package: WDP uses SAP Real Estate for accounting, controlling and reporting. SAP contains all accounting and financial aspects and all aspects related to WDP property activities (such as follow-up on lease agreements, settlement of charges, orders, purchases, budget follow-up for new construction projects, etc.).
1 Financing cost: follow-up on the sensitivity of the cost of debts associated with the interest rates based on internal models and using software.
The process for preparing the financial information is structured based on predefined tasks to perform and respective schedules. WDP uses a detailed checklist of all tasks and sub-tasks to perform for closure of the annual, semi-annual and quarterly accounts of WDP (individually for each entity and consolidated for the Group). Each task is assigned to a manager in the finance department and a mandatory timeframe. Based on this checklist, everyone at the finance department knows what tasks to perform and by when.
This checklist is built around the following dimensions:
1 the types of activity are divided up as follows: pre-closing, closing, consolidation, internal and external reporting and audit;
1 subsequently, for the actual closing and consolidation process, a specific task is linked to each account of the balance sheet and profit and loss account, with a SAP transaction code and a description;
1 wherever possible, the tasks are deduplicated and linked to specific deadlines with a responsible person (as well as a backup) in the Finance Department for each task. Moreover, every attempt is made to move tasks forward wherever possible, i.e. before the actual balance sheet date, to guarantee process speed and especially process quality;
1 the above is also linked to standardised templates that serve for control and as a basis for the audit files;
1 WDP and its subsidiaries follow the above procedure.
For efficient performance of the audit process, before the balance sheet date a pre-audit meeting is always held with the statutory auditor, with discussion of all significant trends and special points needing attention over the past period.
Once all accounting tasks are complete and have been processed in the consolidation and reporting set, the figures are checked by the CFO.
This control mainly consists of:
1 a variance analysis between the actual and budgeted figures (the budgeted figures are prepared once a year and updated quarterly based on a forecast);
1 a variance analysis between the actual and historical figures; and
1 an ad hoc analysis of all material amounts and entries.
Once these checks are complete, the figures are submitted to the CEOs of WDP and adopted in mutual consultation with the CFO. The quarterly, semi-annual and annual reports, including corresponding press releases, are submitted to and analysed by the Audit Committee and Board of Directors, which approve them for publication.
The financial reporting is drawn up in accordance with the IFRS (International Financial Reporting Standards) as adopted in the European Union and with the legal and administrative regulations applicable in Belgium. These standards include all new and revised standards and interpretations published by the International Accounting Standards Board (IASB) and the International Financial Reporting Interpretations Committee (IFRIC). Regular discussions are scheduled with the statutory auditor and the required training is arranged for the responsible persons in the organisation in order to meet the accounting standards in their latest versions.
The statutory auditor audits the annual figures (full scope) and semi-annual figures (limited scope). The statutory auditor does not audit quarterly figures.
Over the course of the financial year, the quality of the internal control is assessed by:
1 the statutory auditor: on the one hand within the framework of the audit of the semiannual and annual figures, and on the other hand within the framework of the annual review of underlying processes and procedures. Furthermore, we refer to the statutory auditor's report (see Chapter 12. Appendices on pp. 264). The internal control systems for the key audit matters, i.e. the valuation of the property investments, have been analysed. Based on the recommendations of the statutory auditor, the process is adjusted as needed;
1 the Audit Committee: as indicated above, the Audit Committee performs a special task with regard to internal control and risk management for WDP. The Board of Directors supervises the performance of the tasks of the Audit Committee, using tools such as reports from the Audit Committee to the complete Board of Directors, and
1 internal audit: the company has hired an external internal auditor as a third-line function in the internal audit structure. All critical business processes are audited as part of a three-year cycle. In addition, the compliance function, the risk management function and at least one additional specific process are subject to an annual internal audit. In 2022, an internal audit was carried out on the processes and internal controls related to the project development process.
In accordance with Article 34 of the Belgian Royal Decree of 14 November 2007 on obligations on issuers of financial instruments admitted for trading on a regulated market, WDP gives a summary and, if applicable, explanation of the following items, to the extent that these items, due to their nature, will have an impact in cases of a public acquisition bid.
As of 31 December 2022, the capital of WDP comes to 233,702,382.00 euros, represented by 203,980,363 ordinary shares, each representing 1/203,980,363 of the capital. All
shares are fully paid up and are either registered or dematerialised. None of these shares provides special voting or other rights. Each share confers the right to one vote at the General Meeting.
Share transfer provisions under the law, the Articles of Association or by convention
The transfer of shares in WDP is not subject to any provisions under the law or the Articles of Association. All WDP shares are listed on Euronext Brussels and Amsterdam.
Special rights of control are not granted to any (categories of) shareholders.
Mechanism for auditing a share scheme for employees when rights of control are not exercised directly by employees
WDP does not have a share scheme for employees.
Voting restrictions under the law or the Articles of Association
The law and the Articles of Association do not set any restrictions on voting rights.
As far as WDP is aware, no shareholder agreements exist which could result in restrictions on share transfers or voting rights.
For rules on appointment and replacement of members of the Board of Directors, please refer to the explanatory note in Chapter 8. Corporate Governance Statement, as well as to Article 14 of the Articles of Association of the company, which states that directors are appointed by the General Meeting for a period of four years in principle and that the General Meeting may remove them at any time. Where applicable, the binding nomination right of the Reference Shareholder(s) must be applied in the nomination, as per Article 15 of the Articles of Association.
With regard to the amendment of the Articles of Association of the company, please refer to the GVV/SIR legislation, which provides that any draft amendment of the Articles of Association must be submitted to the FSMA for approval in advance. Moreover, Article 31 of the Articles of Association and the provisions of the Code of Companies and Associations apply.
In accordance with Article 8 of the Articles of Association of the Company, the Board of Directors is authorised, within the constraints of the mandatory provisions contained in the applicable company law, to increase the share capital on the dates and subject to the conditions that it specifies, in one or more increments, up to a maximum amount of:
1 I. 116,851,191.00 euros, if the capital increase to be realised is a capital increase by cash with the possibility for the
1 shareholders of the company to exercise their preferential right or the irreducible allocation right (as referred to in the GVV/SIR legislation); and
1 II. 116,851,191.00 euros if this capital increase is performed in the context of paying an optional dividend; and
1 III. 23,370,238.20 euros, if the capital increase to be realised (a) is a capital increase via a contribution in kind, or (b) a capital increase in cash without the possibility for the
Company's shareholders to exercise the preferential right or the irreducible allocation right (as referred to in the GVV/SIR legislation), or (c) any other form of capital increase; with the proviso that the capital under this authorisation may not be increased by an amount higher than the amount of the capital on the date of the Extraordinary General Meeting which approves the authorisation, being 2 February 2023.
This authorisation is renewable.
As of the date of this annual report, the Board of Directors has not yet made use of the authorisation granted to it to increase the capital, and thus the available balance of the authorised capital still amounts to:
1 I. 116,851,191.00 euros, if the capital increase to be realised is a capital increase in cash with the option of the company’s shareholders to exercise their preferential right or irreducible allocation right (as referred to in the GVV/SIR legislation);
1 II. 116,851,191.00 euros if this capital increase is performed in the context of paying an optional dividend;
1 III. 23,370,238.20 euros if this capital increase is (a) performed by a contribution in kind or (b) performed by a contribution in cash without the option for company shareholders to exercise their statutory preferential rights or irreducible allocation rights (as referred to in the GVV/SIR legislation) or (c) any other form of a capital increase;
with the understanding that in the context of the authorised capital, for the fiveyear authorisation period, the capital can never be increased beyond an amount of 233,702,382.00 euros.
In accordance with Article 11 of the Articles of Association, WDP may acquire, accept in pledge, and sell its own shares and associated depository receipts in accordance with the applicable company legislation.
In addition, the Board of Directors is authorised to perform the following actions for five years starting on 16 February 2023:
1 acquire shares in the Company and associated depository receipts and accept these in pledge, at a minimum price or countervalue equal to 0.01 euros and at a maximum
price or counter value equal to 125% of the closing price on the trading day before the date of the transaction, where the Company shall not be permitted to possess shares in the Company or associated depository receipts that represent more than 10% of the total number of shares;
1 transfer shares in the Company and associated depository receipts, such as to one or more specific persons who are not employees, at a minimum price or countervalue equal to 75% of the closing price of the trading day before the date of the transaction.
On 31 December 2022, as well as at the date of this annual report, WDP does not possess any of its own shares.
Major agreements to which WDP is party that come into force, undergo amendments or expire in cases of a change of control over WDP after a public acquisition bid
The General Meeting of 27 April 2022 adopted the clause for the change of control within the framework of (i) the credit agreement that the Company concluded with ING Bank on 29 October 2021, (ii) the loan agreement that the Company concluded with ABN Amro Bank on 23 November 2021, (iii) the loan agreement that the Company concluded with Argenta Spaarbank and Argenta Assuranties on 29 November 2021, (iv) the loan agreement that the Company concluded with BNP Paribas Fortis on 30 November 2021, (v) the loan agreement that the Company concluded with Belfius Bank on 30 November 2021, and (vi) the loan agreement that the Company concluded with KBC on 8 December 2021, (vii) the loan agreement that the Company concluded with BNP Paribas Fortis on 2 February 2022 and (viii) the loan agreement that the Company concluded with ING Bank on 16 February 2022.
Agreements concluded between WDP and its directors or employees that provide for remuneration if a public acquisition bid results in the resignation of directors or their forced departure without a valid reason or the end of employment of an employee.
The agreements concluded with the co-CEOs and the CFO include a clause stating that if the management agreement with the person in question is terminated by either party within six months after a public acquisition bid, in the absence of a serious error, the person in question is entitled to a severance payment of 18 months for co-CEOs and 12 months for the CFO.
The agreements concluded with other Management Committee members and WDP staff do not include any contractual clauses of this kind.
“Strategically located warehouses within a context of supply chain transformation accommodate the distribution and production of supplies closer to consumer markets.
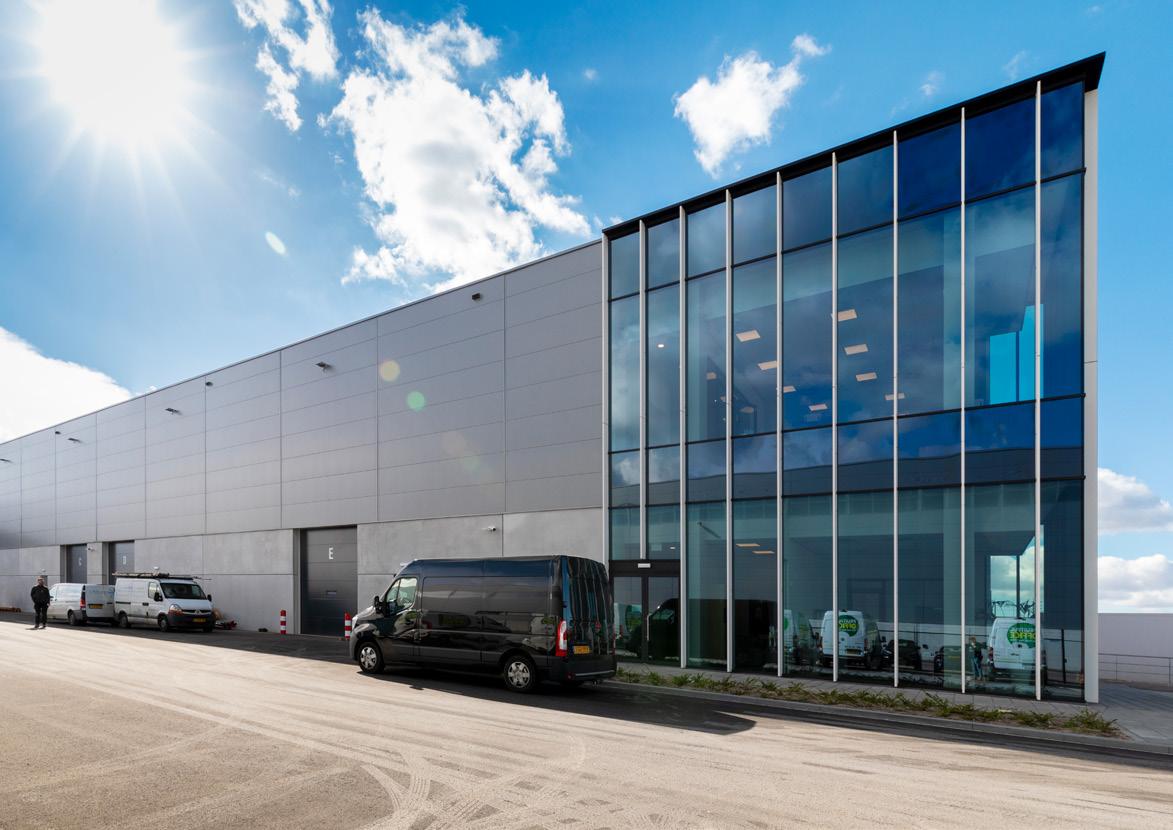
09
Risk factors
The strategy of WDP is aimed at creating long-term value for its clients, its shareholders and all its stakeholders. WDP aims to create a robust and growing income stream and dividend while safeguarding the long-term value of its properties and solid operational and financial KPIs. WDP’s operations are exposed to a number of internal and external risks or uncertainties that could impact the Group’s ability to achieve its overall strategic objectives.
WDP Group’s risk management focuses on risk awareness and control and/or mitigation of real risks or threats whilst allowing controllable risks (combined with opportunities) in pursuit of generating and protecting value for its shareholders, clients and other stakeholders. Risk management is performed on a continuous basis. Moreover, the Group is convinced that risk management should be an integral part of the company culture to foster an environment in which people are motivated to identify and cope with risks and ensuring the necessary transparency with regard to any possible risks. Risk management is embedded in the Company’s day-to-day company activities so that it can easily adapt to changes that may occur in the environment in which it operates.
Review and identification of (new) risks within the risk register
#TeamWDP Risk ambassadors Risk manager Management Committee Board of Directors
Analysis and evaluation of identified risks, taking into account their likelihood and impact
Active risk management through prevention, mitigation, risk sharing and/or retention of risks
Compliance officer Risk ambassadors Risk manager
Continuous monitoring on risk impact and possible changing risks
#TeamWDP
#TeamWDP Risk manager Management Committee Board of Directors
WDP works within the contours of a cautious-to-balanced risk appetite. The near-zero tolerance or cautious appetite relates to legal, regulatory, HSES, compliance as well as financial risks. The Group has a limited to balanced risk appetite in pursuing the achievement of its strategic and operational objectives.
The Board of Directors determines the risk level which is acceptable to WDP in order to achieve its strategic objectives and annually reviews the Group’s risk appetite.
WDP annually reports on its key risks, which are defined based on their specificity and materiality, taking into account their impact and likelihood. Evidently, WDP also faces generic risks, which are considered, mapped and monitored throughout WDP’s Risk management assessment. These risks are not considered as the most significant risks because they are not specific or because their net risk value1 is not considered to be material.
These key risks are presented on the following page based on their net materiality, i.e. after mitigating actions, ranked per category from high to low and are discussed in detail in this chapter. WDP is aware of the fact that other risks may occur, which are unknown, not significant and/or material at the publication date of this annual report. To clarify WDP's risk management process, each of the main risks includes some of their Key Risk Indicators. These Key Risk Indicators can provide an early indication of risk exposure and offer concrete guidelines for risk assessment.
The classification and identification of key risks are based on WDP’s Enterprise Risk Management Policy.
(in order of materiality per category)2
Compliance
Climate transition
Regulatory framework
Impact on WDP’s value pillars
Fair value decline
Future logistics
Sustainable growth
REIT status Sustainable growth
Financial
Fair value decline Sustainable growth
Future logistics
Financing Sustainable growth
Market
Investment market cycle
Credit cycle
Sustainable growth
Sustainable growth
Rental market cycle Sustainable growth
Project developments
Future logistics
Sustainable growth
Impact by responsiblility
Client solvency
Vacancy
Supply chain
Human capital
Sustainable growth
Sustainable growth
Future logistics
Impact by responsiblility
Vitally engaged
Materiality is measured by the net risk value (impact x likelihood) for each risk.
Investment market cycle
Credit cycle
Financing
Project developments
Rental market cycle
Supply chain
Human capital
Client solvency Vacancy
Climate transition
Regulatory framework
Risks related to tightening climate policies and regulations to shift towards a lower-carbon economy
Across the world, we are seeing climate policies and climate regulations are being tightened to shift the economy away from fossil fuels towards a lower-carbon economy.
The consequential requirements through tightening of climate policies can result in restrictions on the letting or the sale of buildings that do not comply with minimum standards. The same goes for technologically obsolete buildings which may require higher maintenance costs or capex requirements to meet minimum efficiency standards and modern work trends.
Tightening climate policies and regulations can cause a rise to shifts in the Company’s entire value chain, going from investors to clients’ demands as this might lead to a reduction in available capital and revenues.
Why is this risk significant to WDP?
1 As a capital intense real estate company we need to secure our access to financing (debt and equity). The clear regulatory shift towards green financing implies a higher demand from investors and financial institutions for green investments and green-certified assets. The Climate Action Plan defines concrete targets for green-certified assets and green financing. For example, we aim to increase the share of green-certified assets in the entire property portfolio from the current 39% to at least 75% and to increase the share of green financing in total liabilities from the current 58% to at least 75% by 2025.
1 More stringent energy performance and efficiency requirements and the goal of reducing embodied carbon in project developments will incur increasing capex.
1 Land use is critical for logistics development projects. In 2022, WDP has completed 500,000 m² of developments, representing a land area of approximately 1,000,000 m².
How does WDP mitigate this risk?
1 Various actions are taken as a part of the WDP Climate Action Plan (see 4. Performance and trends – Future logistics):
1 analysis of the portfolio’s exposure to transition risk;
1 WDP as an energy solutions provider;
1 the implementation of an energy monitoring system in the entire property portfolio.
1 WDP takes part in various specialised industry organisations so it is always up to date on developments with regard to EU and global regulations.
Risk appetite: limited
Which Key Risk Indicators help WDP to monitor this risk?
1 Percentage of green-certified assets.
1 Percentage of green funding.
1 GHG emissions (scope 1, 2, and 3).
1 Percentage of electricity consumption from renewable energy sources for WDP corporate offices and property portfolio.
Risk appetite: near-zero tolerance Regulatory framework
The Flemish Government is considering the abolition of green power certificates linked to the production by PV installations in Flanders that entered service before 2013, with effect from 1 January 2024.
For these projects, the guaranteed support period for the certificates was fixed at 20 years and this period expires gradually in 2028-32.
Why is this risk significant to WDP?
1 Potential loss of the annual revenue stream of approximately 7 million euros that as of 1 January 2024 remains weighted averaged for a period of six years. This corresponds to about 2% of total revenue and 3% of EPRA Earnings in 2022.
How does WDP mitigate this risk?
1 Continuous monitoring of relevant legislation and evolutions in collaboration with legal advisers.
Which Key Risk Indicators help WDP to monitor this risk?
1 Changes in relevant regulations and decisions by the Government of Flanders.
Risk appetite: cautious REIT status
Regulatory risks related to non-compliance with and loss of REIT regimes
WDP has a REIT status in Belgium and France (as GVV/SIR and SIIC) and believes that the company still is entitled to the FBI status in the Netherlands (See chapter 7. Financial results and property report on pp. 77).
To maintain the REIT status – and their fiscally transparent regime – WDP must take into account certain activity restrictions, diversification requirements, restrictions on the level of its subsidiaries, restrictions on its gearing ratio, requirements on profit disbursement, requirements on its shareholder structure, procedures for conflicts of interest, requirements related to corporate governance and other specific requirements as set out in the relevant national REIT legislations.
Why is this risk significant to WDP?
1 Potential loss of the fiscally transparent regime causing a significant negative impact on the net result and NAV.
1 On 31 December 2022, WDP had a total of 2,401.9 million euros in outstanding credit facilities. The contractual provisions of these credit facilities generally stipulate that WDP NV/ SA must remain qualified as a regulated real estate company (GVV/SIR) in Belgium.
How does WDP mitigate this risk?
1 Rigorous internal control procedures. See chapter 8. Corporate Governance Statement pp. 137.
1 Continuous monitoring of statutory requirements and compliance, assisted by specialist external consultants.
1 Intensive dialogue with the regulator as part of the prudential regulation of REIT regimes.
1 Representation of the Company in organisations that represent the REIT industry.
Which Key Risk Indicators help WDP to monitor this risk?
1 Changes in the government’s position related to the REIT status.
1 A regulatory warning for inadequate compliance with REIT regulations.
1 Legal ratios imposed by REIT regulations.
appetite: Annual accounts Governance Results Performance Strategy and value creation This is WDP ESG WDP 2022 Annual Report 153
Risk Financial
The fair value of the real estate investments of the WDP Group is subject to change and depends on various factors. Some of these are exogenous and thus potentially beyond the control of the WDP Group (such as decreasing demand or occupancy rates in the respective sub-markets in which the WDP Group is active and changes in expected investment returns or increases in transaction costs related to the acquisition or disposal of real estate).
1 Negative impact on net result and EPRA NAV. A 1% decrease in the occupancy rate implies a 1.4% decrease in the EPRA Earnings.
1 Negative change in debt ratio. A 5.0% decrease in the fair value of real estate investments leads to a 1.8% increase in the gearing ratio. See chapter 7. Financial results and property report on pp. 104.
1 (Partial) inability for dividend distribution if the cumulative negative change in fair value exceeds the distributable reserves. See chapter 11. Annual accounts on pp. 258.
1 Investment policy that focuses on high-quality property in strategic logistics hubs or secondary locations with growth potential.
1 Highly diversified portfolio with a maximum risk per building of less than 2.5% in terms of fair value.
1 The property portfolio is evaluated by independent experts every quarter to identify trends and take timely proactive measures.
1 Prudent, clearly defined management of capital structures. See chapter 7. Financial results and property report on pp. 82.
1 Sufficient distributable reserves amounting to approximately 1,021 million euros (after payment of the proposed dividend for 2022).
Which Key Risk Indicators help WDP to monitor this risk?
1 Fair value of each building vs. fair value of total portfolio.
1 Occupancy rate.
1 Average age of the portfolio.
1 Average lease duration.
1 Debt ratio.
1 Cumulative unrealised profit/loss of the investment property portfolio.
As a capital-intensive growth company, WDP’s strategy depends largely on its ability to attain financial resources, in the form of either debt or equity capital so that it can finance its activities and investments. Various negative scenarios (such as disruptions in the international financial debt and share capital markets, a reduction in banks’ lending capacities, a deterioration in the WDP Group’s creditworthiness, a negative investor perception towards real estate companies) may occur, resulting in difficulties in accessing funding under the existing or new credit facilities or within the capital markets. A material increase of the cost of capital of the Company may have an impact on the profitability of the Company as a whole and on new investments.
1 Inability to finance acquisitions or projects (both from shareholders’ equity capital and loan capital). As of 31 December 2022, an amount of 337 million euros of identified investments is to be invested.
1 The unavailability of financial resources (via cash flow or available credit facilities) for interest and operating costs and repayment of outstanding capital on loans and/or bonds on the expiry date.
1 Financing at an increased cost resulting in a decrease in targeted profitability. An increase of 100 basis points in Euribor interest rates implies a negative effect on EPRA Earnings of 0.6 million euros.
1 Potentially increased funding risk for current liabilities. 169 million euros or 7% of the outstanding debt is commercial paper and shortterm straight loans.
does WDP mitigate this risk?
1 Conservative and prudent financing strategy with a balanced spread of maturity dates for debts. See 7. Financial results and property report on pp. 82.
1 Securing sufficient credit lines to finance operating costs and planned investments. As of 31 December 2022, the total amount of undrawn and confirmed long-term credit facilities amounted to approximately 1.7 billion euros after covering the commercial paper programme. See chapter 7. Financial results and property report on pp. 82.
1 Protection against interest rate rises with hedging instruments allowing 97% of debt to be hedged. If the rise in interest rates is due to higher inflation, the indexation of rental income is also a mitigating factor.
1 Continuous dialogue with investors and banking partners to build solid long-term relationships.
1 The commercial paper is fully covered by the backup lines and unused credit facilities that serve as a guarantee for refinancing if the full placement or extension of the commercial paper proves impossible. Backup lines and unused credit facilities also required periodic reviews.
Risk appetite: cautious
Which Key Risk Indicators help WDP to monitor this risk?
1 Remaining duration of all drawn and undrawn credit lines.
1 Amount of undrawn and confirmed credit lines.
1 Diversification rate of financing sources.
1 Hedge ratio.
1 Average financing costs.
1 Cost of capital.
Investment market cycle Risk appetite: balanced
The investment market for logistics properties may be negatively impacted by reduced investor demand for real estate. Structural drivers, such as omnichannel, supply chain revision, or sustainability, may cause significant (negative or positive) changes in the companies’ logistics strategy, hence their real estate.
In addition, inappropriate response towards an evolving property market may result in investments or disposals by WDP taking place at unfavourable prices or time in the cycle.
Why is this risk significant to WDP?
1 Every 5% decrease in the value of the property portfolio can lead to a 1.6 euro (-8%) decrease in the EPRA NAV and a 1.8% increase in the gearing ratio.
1 Acquisitions or disposals at unfavourable yields may affect the profitability of the Company and negatively impact the targeted EPRA Earnings.
How does WDP mitigate this risk?
1 Investment strategy aimed at high-quality buildings that generate stable long-term income, embedded in a multi-year growth plan with defined guidance and yield expectation.
1 Continuous monitoring of property market cycle and possible changing market conditions.
1 High percentage of land reserve in the valuation of the property portfolio (28%), which has withstood decreases in value in the past.
Which Key Risk Indicators help WDP to monitor this risk?
1 Geographical diversification for the entire property portfolio.
1 Initial rental yield of realised acquisitions and project developments.
1 Transactions’ prime yields and take-up volumes in relevant regions.
Extreme volatility and uncertainty in international markets may negatively impact the cost of capital and can lead to more difficult access to funding, both to equity markets to raise new capital/ shareholders’ equity and to debt financing through existing and/or new loans.
Why is this risk significant to WDP?
1 More difficult access to equity markets to raise new capital/shareholders’ equity and restrictions in the availability of debt financing with regard to existing and/or new credit facilities. As of 31 December 2022, total financial debt amounted to 2,401.9 million euros, with granular distribution of maturities.
1 Volatility and uncertainty in international markets can lead to sharp fluctuations in share price.
1 Financing at an increased cost resulting in a decrease in targeted profitability. An increase of 100 basis points in Euribor interest rates implies a negative effect on EPRA Earnings of 0.6 million euros.
How does WDP mitigate this risk?
1 Extensive and frequent dialogue with capital markets and financial counterparties and transparent communication with clear targets.
1 Strict monitoring and control of any risk which could negatively affect perceptions of the Company by investors and financiers
1 Aim to build long-term relationships with financial partners and investors.
1 Buffer of 1.7 billion euros of unused and confirmed credit lines in addition to unused credit facilities to cover the commercial paper programme.
1 The Company’s creditworthiness is highlighted by a Baa1 (Moody’s) and BBB+ (Fitch) credit rating.
Risk appetite: cautious
Which Key Risk Indicators help WDP to monitor this risk?
1 Remaining duration of all drawn and undrawn credit lines.
1 Amount of undrawn and confirmed credit lines.
1 Diversification rate of financing sources.
1 Hedge ratio.
1 Average financing costs.
1 Cost of capital.
1 Credit rating scores.
The rental market may face declining demand for logistics property with a possible oversupply. This may impact the occupancy rate of the property portfolio, which is the main driver of our company’s operational activities. Additionally, this may have an impact on the ability of pre-letting the project development pipeline and therefore also on the targets predetermined by WDP in its 2022-25 growth plan.
Why is this risk significant to WDP?
1 A decrease in occupancy rate will affect rental income and vacancy charges. A decrease of 1% in occupancy rate would result in a -1.4% decrease in EPRA Earnings.
1 A decrease in the fair value of the property portfolio and, thus, also of the NAV. Every 5% decrease in the value of the property portfolio decreases the EPRA NAV by 1.6 euros (-8%).
1 Inability to pre-let projects and to further develop and yield land potential within the portfolio. As of 31 December 2022, WDP owns a land reserve of approximately 3.6 million m² with a fair value of 200.6 million euros.
How does WDP mitigate this risk?
1 Diversified client base with a maximum exposure per client and a wide spread across various tenant sectors (as well as tenants’ clients, especially if they are third-party logistics service providers).
1 Thorough integration in the real estate and logistics market thanks to years of experience and in-house commercial teams.
1 Focus on high-quality sites in strategic logistics hubs or secondary locations with growth potential.
Risk appetite: balanced
Which Key Risk Indicators help WDP to monitor this risk?
1 Occupancy rate.
1 Percentage in pre-let transactions within the development pipeline.
1 Diversification of the client base.
Several risks are inherent in developing projects and the rolling out WDP ENERGY: budget, timing, quality, and counterparty.
For example, the quality of the work delivered by the construction partner may pose a risk to the value of the project. Delays may occur during the implementation of the works resulting in loss of potential revenue. Given the focus on pre-let developments, the time lag between the commercial agreement and commitment of the construction partner may result in the unavailability of the construction partner and may cause a delay in the implementation of the work. Moreover, the required materials may increase in price due to scarcity, inflation, etc. Subsequently, this may lead to failure in achieving targeted returns on developments or exceeding investment budgets.
Why is this risk significant to WDP?
1 Within the growth plan, investments are prioritised by the pre-let property developments and accelerated roll-out of WDP ENERGY.
1 In 2022, WDP developed about 500,000 m², representing an investment volume of around 300 million euros. On 31 December 2022, a surface of about 715,000 m² was under construction, i.e. an investment volume of about 578 million euros.
1 In 2022, WDP announced the installation of a Green Mobility Hub at one of its existing sites and the further expansion of its solar panel park to a total capacity of 150 MWp, together accounting for an investment of approximately 150 million euros in the period 2023-24.
How does WDP mitigate this risk?
1 Long-term partnerships with construction partners, with regards to solvency and quality.
1 Strict monitoring of projects under development, including the implementation of penalty clauses for non-compliance with contracts by third parties.
1 In-house specialised development team with a strong track record and in-house Energy & Sustainability Team and engagement of external consultants to hedge risks.
Risk appetite: balanced
Which Key Risk Indicators help WDP to monitor this risk?
1 Outstanding development pipeline.
1 Timely delivery of project developments and sustainability investments.
1 Budget overrun.
1 Financial situation of partners participating in these realisations.
Client solvency
Client solvency risk
(Partial) default of payment by customers can significantly affect the Company’s rental income, cash flow, the portfolio’s occupancy rate, and EPRA Earnings.
Why is this risk significant to WDP?
1 As of 31 December 2022, outstanding trade receivables amounted to 15 million euros. An increase of bad debts by 1 million euros would result in a 0.4% decrease in EPRA Earnings.
1 As of 31 December 2022, a decrease in rental income by 2 million euros would reduce EPRA Earnings per share by -0.7%.
How does WDP mitigate this risk?
1 Extensive tenant solvency check by internal specialists and external rating agencies before inclusion in the portfolio.
1 Rigorous internal procedure for invoicing and rent collection.
1 Lease strategy that aims for long-term contracts with high-quality stable, solvent tenants and client diversification throughout the property portfolio.
Risk appetite: limited
Which Key Risk Indicators help WDP to monitor this risk?
1 Percentage of rent collection.
1 Days Sales Outstanding.
1 Tenant’s financial situation.
1 Tenants’ diversification throughout the property portfolio.
Portfolio vacancy risk
WDP maintains a strategy of long-term leasing of developments and/or acquisitions. WDP keeps the buildings in its portfolio to generate a stable cash flow through leasing, whereby a high and constant occupancy rate is essential for the growth of the Company. Vacancy may arise when expiring lease agreements are not renewed and when lease agreements are terminated before the end date. The occupancy rate of the WDP portfolio at the end of the year was 99.1%. Given the high occupancy rate the risk of future rental vacancies is greater than the potential to increase the occupancy rate.
Why is this risk significant to WDP?
1 A decrease in the occupancy rate will affect rental income and vacancy charges. A decrease of -1% of the occupancy rate would result in a -1.4% decrease in EPRA Earnings.
How does WDP mitigate this risk?
1 Internal property management team and commercial teams.
1 Quality and multi-purpose buildings located at strategical logistics crossroads facilitate re-letting.
1 Preference for realistic rental levels and long-term rental contracts.
1 Diversified client base with limited exposure towards one tenant and well-spread sector base.
Risk appetite: limited
Which Key Risk Indicators help WDP to monitor this risk?
1 Occupancy rate.
1 Solvency of client portfolio (percentage of rent collection and doubtful debts).
1 Buildings’ spread (geography, building type, age) within the property portfolio.
1 Average lease duration and lease renewal rate.
Risk appetite: cautious Supply chain
Supply chain risks related to business continuity, quality, resilience, labour regulations, and working conditions
WDP maintains contact with all kinds of stakeholders who contribute to the operational activities of the Company at various levels within the supply chain. The (re-) development projects are the focal point of our supply chain with an increasing contribution for the realisations through WDP ENERGY. We also call on a wide range of service providers (architects, engineering firms, construction companies, etc.) and are ourselves dependent on the supply chains of (construction) materials (recently disrupted by scarcity, price increases). This interaction does not only affect business processes or services, but also involves corporate responsibility and reputation risks.
Why is this risk significant to WDP?
1 Of the projects under development as at 31 December 2022, 95% were pre-let.
1 In 2022, WDP developed about 500,000 m², representing an investment volume of around 300 million euros. On 31 December 2022, an area of about 715,000 m² was under construction, i.e. an investment volume of about 578 million euros.
1 In 2022, WDP announced the installation of a Green Mobility Hub at one of its existing sites and the further expansion of its solar panel park to a total capacity of 150 MWp, together accounting for an investment of approximately 150 million euros in the period 2023-24.
How does WDP mitigate this risk?
1 By requiring our suppliers to adhere to the WDP Supplier Code of Conduct, we engage them as key stakeholders for achieving our objectives in terms of sustainability.
1 The WDP Grievance mechanism ensures awareness about inappropriate and unlawful practices with the goal of ending and resolving such grievances.
1 Critical suppliers to the Company are subject to regular due diligence.
Which Key Risk Indicators help WDP to monitor this risk?
1 Reported breaches of the Supplier Code of Conduct.
1 Changes in regulations related to the Company’s supply chain.
Risks related to under-resourcing, attracting and retaining talent, and staff development
#TeamWDP is one of WDP’s strategic drivers realising the Group’s business plan. Failure in recruitment, development, and retention of team members with the right skills may result in underperformance, which would impact Company’s decision-making, operational efficiency, and general performance.
Why is this risk significant to WDP?
1 The Company’s activities, business processes, and decisions call for highly qualified and/or experienced staff within a compact team (116 employees as of 31 December 2022).
1 90% of WDP staff holds a university or college degree.
1 WDP activities are constantly evolving (i.e. becoming more complex and specialised), so there is a need for additional highly qualified profiles. In 2022, 6 new positions were created.
How does WDP mitigate this risk?
1 Competitive pay package for employees, which is benchmarked regularly.
1 Annual employee engagement survey.
1 Individual employee training programs for each member of #TeamWDP, combined with – if applicable – internal mobility.
1 Efforts related to well-being, company atmosphere and operational activities. See
4. Performance and trends – Vitally engaged.
Risk appetite: cautious
Which Key Risk Indicators help WDP to monitor this risk?
1 Staff turnover.
1 Average turnaround of vacancies.
1 Employee seniority and age.
1 Employee engagement survey results.
“The switch to electrically driven supply and distribution by our clients has kicked off. Here lies a clear role for the layout of our warehouse sites, i.e. scaling up WDP ENERGY.
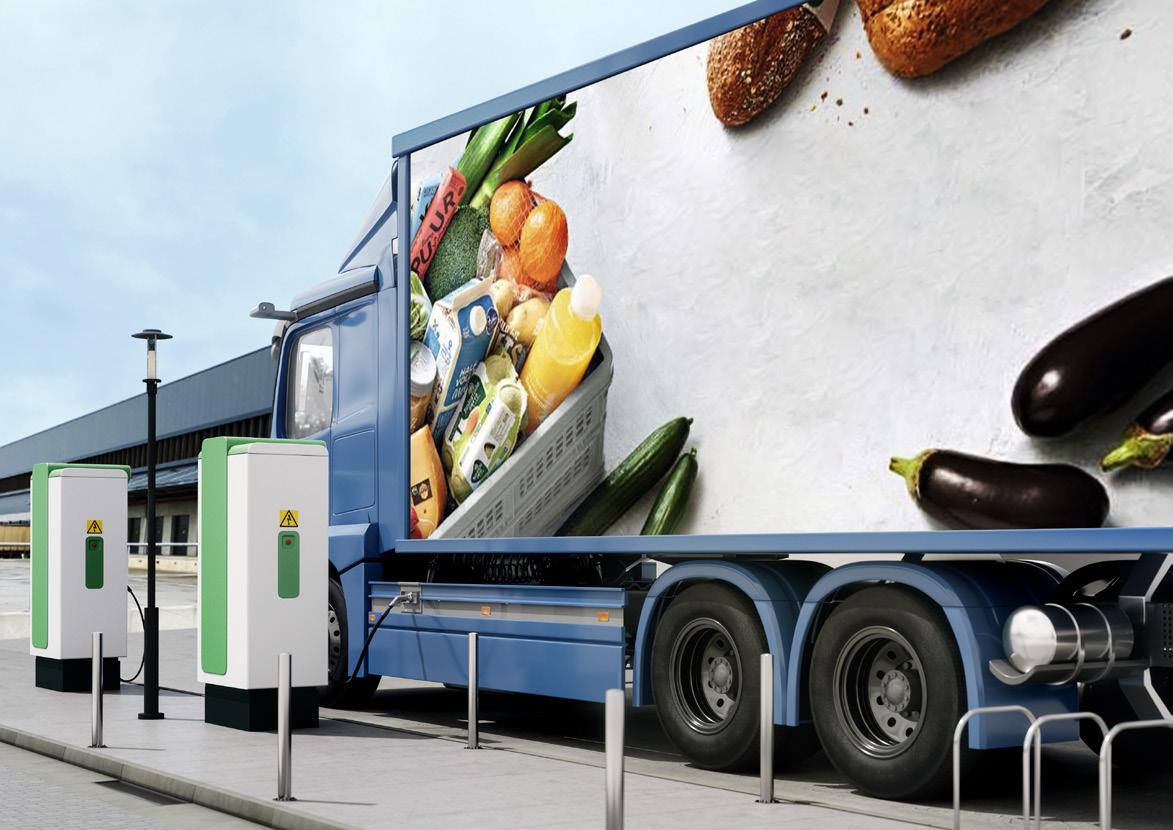
Annual accounts Governance Results Performance Strategy and value creation This is WDP ESG WDP 2022 Annual Report 160
EPRA KEY PERFORMANCE INDICATORS
The statutory auditor confirms that the EPRA Earnings, the EPRA LTV, the EPRA NAV indicators, and the EPRA cost ratio were calculated according to the definitions of the
EPRA key performance indicator Definition
II. EPRA NAV metrics EPRA Net Reinstatement Value (NRV): the aim of the metric is to also reflect what would be needed to recreate the company through the investment markets based on its current capital and financing structure, including real estate transfer taxes.
236,273 1.25
4,614,985 22.6
4,224,384 20.7
4,454,358 21.8 Table EPRA key performance indicator Definition Purpose %
III. EPRA Net Initial Yield (NIY) Annualised rental income based on the cash rents passing at the balance sheet date, less non-recoverable property operating expenses, divided by the market value of the property, increased with (estimated) purchasers’ costs.
III. EPRA TOPPED-UP NIY This measure incorporates an adjustment to the EPRA NIY in respect of the expiration of rent-free periods (or other unexpired lease incentives such as discounted rent periods and step rents).
IV. EPRA vacancy rate Estimated Market Rental Value (ERV) of vacant spaces, divided by ERV of the whole portfolio.
V. EPRA cost ratio Administrative/operating costs including or reduced by the immediate vacancy costs, divided by gross rental income.
A comparable measure for portfolio valuations within Europe. In the past, discussions were held on portfolio valuations in Europe. This measure should make it easier for investors to judge themselves, how the valuation of portfolio X compares with portfolio Y.
Providing detail on the calculation that reconciles the difference between EPRA NIY and EPRA TOPPED-UP NIY.
A pure (in %) measure of investment property space that is vacant, based on ERV.
An important criterion to make a meaningful measurement of changes in the operating costs of a property company possible. Including direct vacancy costs
Excluding direct vacancy costs
5.0%
5.0%
0.9%
10.0%
9.7%
Diluted NAV at fair value (after the exercise of options, convertibles and other equity
The EPRA cost ratio reflects operating expenses net of administrative and operating costs capitalised according to IFRS for an amount of 4.7 million euros. Costs capitalised primarily relate to internal employee staff costs of employees directly involved in developing the property portfolio.
Passing rent of leases coming to their expiry date in euros (x 1,000¹ Average term until first break until expiry date
1 For Luxembourg (55%) the proportionate share of WDP in the passing rent is indicated.
Passing rent of leases coming to their next expiry date in euros (x 1,000)¹
1 The overview below shows which investments were included in the balance sheet in the course of 2022. For an overview of all transactions and realisations that were identified in 2022, see chapter 4. Performance.
2 This is the net investment for all purchases and disposals executed.
3 This concerns the capitalised interests activated for the project developments.
4 The adjustment for non-cash items of -204.9 million euros for the Group (excluding joint ventures) does not only include the accrual to cash basis adjustment, but also includes an adjustment of -179.2 million euros related to the acquisitions realized through a contribution in kind. An overview of the acquisitions realized in 2022 through contribution in kind can be consulted in chapter 7. Financial results and property report.
5 The reconciliation with the cash flow statement (see chapter 11. Financial statements) can be made by abstracting the capitalised interest in the table above, as the capitalised interest is not regarded as an investment activity in the cash flow statement, but as interest paid.
Organisational perimeter
WDP uses the operational control approach for sustainability reporting. WDP manages all of the warehouses in its property portfolio. These warehouses as well as all of the offices where #TeamWDP works (for Belgium in Wolvertem, for the Netherlands in Breda, and for Romania In Bucharest) are included in our sustainability reporting.
Operational perimeter
WDP measures and reports both scope 1, 2, and 3 emissions related to its activities across its value chain.
Interpretation of Scope 1, 2, and 3
Scope Included Application
Scope 1: Direct greenhouse gas emissions
All direct emissions that result from our activities and are caused by the local combustion of a primary energy source (natural gas, fuel oil, diesel, petrol, ...)
1 Offices where #TeamWDP is active
1 The car park of WDP
Scope 2: Indirect greenhouse gas emissions
All indirect emissions that result from our activities and that occur at another location during the combustion of a primary energy source. Possible applications are electricity, heating and cooling (DH&C), steam, ...
1 Offices where #TeamWDP is active
1 The car park of WDP
Scope 3: Indirect greenhouse gas emissions
All other indirect emissions in our value chain, i.e. the emissions during the production and delivery of building materials and the direct emissions that are caused by the consumption of gas and fuel oil by the tenant, as well as the indirect emissions that are caused by the consumption of electricity and/or district heating and cooling by the tenant. As well as the indirect emissions linked to the electricity consumption of #TeamWDP in the corporate offices and to the business travel of #TeamWDP. The Greenhouse Gas Protocol defines 15 categories of scope 3 emissions. These are further explained below.
Since 2017, WDP reports in accordance with the EPRA Best Practice Recommendations for Sustainability Reporting (EPRA sBPR). The EPRA sBPR guidelines are based on the recommendations and methodology of the internationally used Greenhouse Gas Protocol (GHG Protocol). This provides a consistent manner in which listed real estate companies can measure sustainability performance, which contributes to transparency in sustainability reporting. WDP has received a Gold Award for EPRA sBPR every year since 2017.
1 Warehouses in the WDP property portfolio
1 Offices where #TeamWDP is active
WDP reports on each relevant EPRA performance indicator for its property portfolio and the offices where #TeamWDP works.
For our data coverage, we report the performance indicators according to their absolute performance and their Like-for-Like performance:
1 The absolute performance (Abs): the absolute indicators reflect the gross total of the available data for a specific period and utility (e.g. Elec-Abs, DH&C-Abs).
1 Like-for-Like performance (LfL): the Like-for-Like indicators reflect the change in performance unrelated to fluctuations in portfolio size (constant boundary) (e.g. ElecLfL, DH&C-LfL). In WDP’s reporting, only buildings with consumption data available for a specific utility for the entire years 2021 and 2022 are considered in the Like-forLike indicators. For the Energy and GHG figures, the Like-for-Like scope is limited to a perimeter where complete consumption data for each energy supply (i.e. electricity, gas, heating oil, or other heating sources) in a building is available for the full years 2021 and 2022.
Indirect greenhouse gas emissions (both scope 2 and 3 emissions) are reported according to the location-based and market-based accounting method.
1 For the location-based accounting method, a country-average emission factor from the IEA report is used in the calculation.1
1 Under the market-based accounting method, the calculations are based on an inventory of the WDP portfolio in which some issues are tracked, such as the responsibility of managing the utilities (whether contractually through WDP or the client); the origin of the electricity (green, grey or mix) and, if available, the emission factor of the electricity supplied. If no specific data is available for utilities, the countryaverage emission factor is used (as with the location-based method).
The table below shows the distribution of energy in 2022 per landlord-obtained and tenant-obtained, by origin.
1 IEA stands for International Energy Agency. IEA works with countries around the world to shape energy policies for a secure and sustainable future.
The complete reporting on energy consumption and CO2 emissions from the offices where #TeamWDP operates is based on actual data. No estimation or extrapolation of consumption data is used unless the sources for the consumption data were not yet available as of 31 December 2022. These sources are the invoice data that WDP receives from the office owners and the data from the energy monitoring system (nanoGrid) in the Belgian office.
The reporting of the property portfolio figures is solely based on actual data without estimating or extrapolating consumption data. This is possible because WDP has installed an energy monitoring system (nanoGrid) for its entire property portfolio. Consequently, we use a proprietary data model with two sources for consumption data: (1) data from the energy monitoring system and (2) data from the invoices that WDP receives directly from the utilities to supplement the overall data coverage of the portfolio.
The coverage figures listed for 2021 are restated in this Annual Report 2022. This is because the calculation of the coverage figures was based on a year averaged area in the Annual Report 2021. In this Annual Report 2022, the coverage figures are based on the areas as of 31 December 2022 (in accordance with the methodology in the property report, see chapter 7. Financial results and property report). This also restated the intensity indicators for 2021.
The above only applies to the Abs indicators. By definition, the LfL indicators are different from the 2021 Annual Report due to a scope that takes into account all of the 2021 and 2022 data, as explained earlier.
All EPRA environmental performance indicators marked with an ✓ have been reviewed by Deloitte Company Auditors as part of a limited assurance check for 2022.
Starting with the publication of the Annual Report 2021, WDP annually reports its full GHG climate footprint according to the GHG Protocol methodology. This protocol provides a systematic framework for measuring, managing, and reducing the emissions in our value chain and is a tool for WDP to manage and respond to the risks and opportunities related to these emissions.
Starting from this Annual Report 2022, WDP will report 2 additional categories within the Scope 3 emissions: Energy-related emissions (Category 3) and Business Travel (Category 6).
The table below provides an overview of the methodology used at WDP and its activities throughout the value chain for scope 1, 2, and 3.
GHG PROTOCOL categories (scope 1, 2, and 3)
GHG
Scope 1 Scope 1 Yes
from the combustion of fuels used in (1) corporate offices, (2) car park and (3) service activities of WDP
The emissions are calculated according to category by multiplying fuel consumption with a specific emission factor per application.
(1) For our utilities, we refer to our EPRA sBPR methodology on a market-based approach.
(2) For our car park, we apply well-to-wheel vehicle-specific factors combined with general transport data.
(1) Consumption data of invoices (BE and RO); in NL there are no direct emissions
(2) Mileage- and consumption data from lease companies
(1) Location-based: IEAemissionfactors (“IEA –Emission Factors: Database Documentation (2022 edition), page7”)
(2) CO2 specifications of the vehicles
Scope 2 Scope 2 Yes Emissions from the production of electricity and DH&C consumed in (1) corporate offices and (2) car park of WDP
The emissions are calculated according to category by multiplying energy consumption with a specific emission factor per application.
(1) For our utilities, we refer to our EPRA sBPR methodology on a market-based approach.
(2) The car park is charged with green purchased electricity, and so has no emissions.
(1) Consumption data from invoices (BE, NL and RO) supplemented with monitoring data (BE)
(2) Mileage- and consumption data from lease companies
(1) Market-based factors: if green electricity (as far as known): no emission; otherwise see below Location-based: IEAemissionfactors (“IEA –Emission Factors: Database Documentation (2022 edition), page7”)
(2) No emissions because green electricity contracts in WDP offices
upstream (cradle-to-gate) emissions released during the construction of our warehouses (including solar panels) via the building materials (embodied carbon), transport of building materials as well as energy consumption on the construction sites.
The emissions are calculated from a number of reference projects in BE, NL, RO, LU and DE on the basis of a detailed life cycle assessment in cooperation with an external expert. The listing of material types and quantities is combined with the material-specific emission factor from various material databases.
An extrapolation to the total developed area gives the total emission. This analysis is repeated annually, applied to new developments as well as renovations
Bill of materials from reference projects in BE, NL, RO, LU and DE, based on buildings specifications and BREEAM assessments.
Emissionfactors (EF) are based on a combination of two calculationb methods:
(1) expenses (spent-based): “EXIOBASE 3” and
(2) quantity of materials (quantity-based): “Ecoinvent v3.6”
cat.3 Fuel- and energy-related activities
All upstream losses and emissions linked to transport of electricity to the site (being WDP offices)
Emissions indirectly linked to electricity production of our offices, for example grid losses.
Consumption data from invoices (BE, NL and RO) supplemented with monitoring data (BE)
Market-based factors: if green electricity (as far as known): no emission; otherwise application of
Location-based factors: IEA-emissionfactors (“IEA –Emission Factors: Database Documentation (2022 edition), page7")
cat.4 Upstream transportation and distribution
cat.5 Waste generated in operations
Emissions related to the waste collection and processing of the activities in the offices of WDP.
These emissions are included in cat. 2 Capital goods because of the cradle-to-gate definition where both the production of construction materials and transport to the site are included.
Excluded because of:
(1) Only in the BE office is operational control over the waste collection. For offices NL and RO, the waste collection is managed by the office owners and we do not have sufficient data. This is directly reflected in the relatively low coverage in the EPRA Waste-Abs indicator.
(2) No quantification of emissions related to waste collection and processing has yet been established for the 3 offices.
Not yet available n/a
cat.6 Business travel Yes
All flights executed by WDP employees related to their professional activities.
Emissions from the transport of employees for companyrelated activities in vehicles that are not owned or leased by WDP i.e. private car, public transport, airplane. For reasons of materiality and data availability, we currently only map air traffic.
Distances are estimated via Google Flights. The emission factor is provided by the airline companies at which tickets are purchased.
cat.7 Employee commuting Yes
Emissions from commuting travel by employees with private transport (car owned by employee).
cat.8 Upstream leased assets No n/a
Downstream
cat.9 Downstream transportation and distribution
No n/a
Excluded because of: (1) data not yet available
Not yet available n/a
These emissions are already included in scope 1 and 2. n/a n/a
n/a n/a
WDP is a logistics property player, with a clear focus on development and renovation for long-term ownership and letting. The core business of WDP is not oriented towards development with the intention of selling, hence the exclusion of this category in the scope.
WDP is a logistics property player, with a clear focus on development and renovation for long-term ownership and letting. The core business of WDP is not oriented towards development with the intention of selling, hence the exclusion of this category in the scope.
WDP is a logistics property player, with a clear focus on development and renovation for long-term ownership and letting. The core business of WDP is not oriented towards development with the intention of selling, hence the exclusion of this category in the scope.
cat.13 Downstream leased assets Yes Emissions caused by energy consumption in WDP's property portfolio: electricity, DH&C and fuel.
The emissions are calculated according to category by multiplying energy consumption with a specific emission factor per application. For the specific calculation we refer to our EPRA sBPR methodology for a market-based approach.
Invoice data (if available), supplemented with monitoring data (nanoGrid).
Market-based factors: if green electricity (as far as known): no emission; otherwise application of Location-based factors: IEA-emissionfactors (“IEA –Emission Factors: Database Documentation (2022 edition), page7")
cat.14 Franchises No n/a
WDP is a logistics property player, with a clear focus on development and renovation for long-term ownership and letting. The core business of WDP is not oriented towards development with the intention of selling, hence the exclusion of this category in the scope.
n/a
cat.15 Investments No n/a
n/a n/a
Energy – Absolute performance – WDP corporate offices
Greenhouse gases – Absolute performance – WDP corporate offices
Water – Absolute performance – WDP corporate offices
Energy – Like-for-Like performance – WDP corporate offices
Greenhouse gases – Like-for-Like performance – WDP corporate offices
Water – Like-for-Like performance – WDP corporate offices
Waste – WDP corporate offices
1 Calculated based on GRI standard 306-2 (2016).
Energy – Absolute performance – property portfolio
Greenhouse gases – Absolute performance – property portfolio
Water – Absolute performance – property portfolio
1 These are restated figures for the Annual Report 2021, as indicated in the methodology.
Energy – Like-for-Like performance – property portfolio
Greenhouse gases – Like-for-Like performance – property portfolio
Water – Like-for-Like performance – property portfolio
Certification – property portfolio
WDP ENERGY WDP Electricity procurement green | with regard to the contracts that WDP has under its own management
| for relevant
corporate offices | market-based
| market-based
WDP GREEN Adoption of recommendations | Compliance with TCFD by 2024 (Annual Report 2023)
1 Total capacity (in MWp) of solar panel installations on WDP property (land or building).
2 Emissions linked to the combustion of fuels and/or the production of electricity used in the car park of WDP (leased and owned vehicles) divided by the number of FTE’s with a company car (in kg CO2e/FTE).
3 Total fair value of green certified buildings (currently BREEAM, EDGE) divided by the total fair value of WDP’s standing portfolio (in %).
In 2017, the Task Force on Climate-related Financial Disclosures (TCFD) established a framework to provide investors and other stakeholders with useful decision-making information on climate-related risks and opportunities relevant to one's business. The TCFD has structured its recommendations around four thematic areas that represent the core elements of how organisations operate: governance, strategy, risk management, and metrics & targets.
In our WDP Climate Action Plan, we set ourselves the clear target of implementing the recommendations of the TCFD by 2024. In 2021, when beginning this reporting, the focus was on the themes of governance, risk management and metrics & targets. With respect to strategy, we carried out an initial identification and analysis of the climate-related risks and opportunities facing WDP in the short, medium, and long term, as well as the impact of these risks on our operations. In the future, we will continue to develop this subject area by further testing the resilience of our strategies based on various climate-related scenarios and to further describe and quantify the impact of climate-related risks and opportunities on our operations, strategy, and financial planning.
We refer to:
1 Chapter 5. Approach on ESG pp. 64 for further clarification about the decisionmaking process
1 Chapter 3. Strategy and value creation pp. 14 for background on WDP's Climate Action Plan
1 Chapter 8. Corporate Governance Statement on pp. 124 for WDP’s remuneration policy
WDP’s Enterprise Risk Management Policy
In 2022, in combination with the announcement of our Climate Action Plan, the Board of Directors established a dedicated ESG committee to ensure we had a more future-proof approach to ESG. Given the current relevance of sustainability in the European real estate
world, it was decided to have the entire Board of Directors sit on the ESG Committee. Note that the chairman of the ESG Committee, Rik Vandenberghe, is the primary liaison with the ESG team within WDP.
The Board of Directors considered climate as an opportunity and – partly driven by the 2022 energy crisis – even a driver in WDP’s 2022-25 growth plan: ENERGY AS A BUSINESS. Moreover, in the new remuneration policy for the members of the Management Committee and by extension for #TeamWDP, which is fully in line with the aforementioned growth plan, a clear link has been made to ESG with very concrete short-term and longterm climate-related targets (net-zero targets).
The Board of Directors receives a regular ESG policy update (at least twice a year) that addresses the most relevant sustainability themes. This is the basis used for discussing (climate-related) sustainability risks and opportunities. The reporting is combined with that of the risk management policy and includes a dashboard showing the progress on the different tracks embedded in the Company to achieve the ESG objectives.
The primary responsibility for identifying and assessing climate-related risks and opportunities lies with the Head of Energy & Sustainability. At least quarterly, a risk assessment is carried out within the different WDP departments, which also includes climate-related risks. The Head of Energy & Sustainability can rely on input from her team, the risk manager, the risk ambassadors, and the ESG team.
WDP has anchored ESG in the entire organisation for years. The role of the ESG team is to ensure the alignment and necessary interaction between the environmental, social, and governance tracks within WDP. The Head of Energy & Sustainability has ownership over the environmental component, the Head of HR over the social component, and the General Counsel over governance. Investor relations takes the lead in the reporting component. Specifically for the environmental component, the focus is on evaluating and managing climate-related risks and opportunities, following up on the objectives in our Climate Action Plan, evaluating the performance on those objectives, and communicating to internal and external stakeholders.
Our risk management policy includes a reporting process where risks are assessed with our risk assessment tool and reported to the Management Committee via a risk dashboard. Once the Management Committee has reviewed the proposed risk strategy, the Energy & Sustainability team jointly with other relevant teams with WDP will be responsible for the operational implementation of that strategy and continued monitoring of the risk.
We refer to:
1 Chapter 9. Risk factors pp. 147 for an overview of WDP’s key risks
1 Chapter 8. Corporate Governance Statement pp. 137 for further explanation about the WDP risk management policy
1 WDP's Enterprise Risk Management Policy for more information regarding the risk assessment process used in WDP
1 Chapter 3. Strategy and value creation pp. 14 for background on WDP's Climate Action Plan
Climate change risks are identified and assessed within our overall risk management policy. This identification is part of a continuous process where the Sustainability and Energy team plays a crucial role with the support of the ESG team and risk ambassadors.
Climate change, both transitional and physical, is considered an emerging and further increasing risk for the activities of WDP. As previously explained, we consider the risk of climate transition to be one of the key risks for WDP (i.e. both a specific and material risk).
The responsibility for and management of climate-related risks is assigned to the Head of Energy & Sustainability and her team, which ensures the operational implementation of risk response plans, the risk strategy, and continued monitoring of the risk.
For the actions related to managing climate-related risks, we refer to the Climate Action Plan where concrete actions are proposed per track (Decarb+, Green, Energy) to achieve our targets. Here, the input of project managers, property managers, sustainability engineers, and external advisors is essential.
Description of how the processes for identifying, assessing, and managing climaterelated risks are integrated into WDP's overall risk management
Climate change risks are an integral part of our risk management policy and are subject to the same system of identification, control, and monitoring.
Description of how the processes for identifying, assessing, and managing climate-related risks are integrated into WDP’s overall risk management
Climate change risks are an integral part of our risk management policy and are subject to the same system of identification, control, and monitoring.
As a real estate company, our operations are exposed to both physical and transitional risks and opportunities with respect to climate change.
Description Across the world, we see a tightening of climate policies and regulations to shift the economy away from fossil fuels towards a lower-carbon economy. Here, WDP takes into account the obligations and upcoming changes arising from the EU Green Deal, including the EU Taxonomy, EU Directive on sustainability reporting by companies (CSRD), EU Energy Performance of Buildings Directive (EPBD), and EU Emission Trading System.
How does WDP mitigate this risk?
We consider it as one of the key risks that WDP is exposed to and it is further describedboth in terms of its specificity and materiality (financial impact) and our current risk mitigation measures - in Chapter 9. Risk factors on pp. 151
Description As a long-term property owner, we must ensure that our buildings can withstand extreme weather conditions (floods or droughts, rising sea levels, extreme winds, hurricanes, etc.) because such events can cause local closures, asset damage, and repair costs. Assets located in risky locations may be subject to higher insurance premiums and higher maintenance and investment costs to increase the resilience of the assets.
How does WDP mitigate this risk?
WDP’s strategy of developing and investing in high-quality assets in the best locations fits in perfectly with our objective of developing a resilient portfolio.
Description WDP considered climate as an opportunity when drawing up WDP’s 2022-25 growth plan: ENERGY AS A BUSINESS.
How does WDP incorporate this opportunity into its strategy?
M.A.D.E. for FUTURE
We refer to Chapter 3. Strategy and value creation on pp. 14 for more information on the WDP Climate Action Plan and Chapter 4. Performance and trends on pp. 20.
This can result in restrictions being imposed on the letting or the sale of buildings that do not comply with minimum standards, which can have a negative impact on the Company’s income. The same goes for technologically obsolete buildings which may require higher maintenance costs or capex requirements to meet minimum efficiency standards and modern work trends. Tightening climate policies and regulations can give rise to shifts in the Company’s entire value chain, going from investors to clients’ demands as this might lead to a reduction in available capital and revenues.
Moreover, changes in weather patterns associated with rising average temperatures must be taken into account, which can result in higher operating costs (higher cooling requirements, more wear and tear on the building, higher recurring operational costs, and possible property devaluation).
We currently already take specific aspects of climate change into account in our development process. For example, all (legally required) measures regarding the flooding risk in the Netherlands (where 50% of WDP’s assets are currently located) are embedded in the construction and maintenance process.
Here, WDP focuses on the energy transition in which the Company wishes to play an important role with its warehouses that can function as decentralised energy plants of the future.
We refer to:
1 Chapter 3. Strategy and value creation pp. 14 for background on WDP's Climate Action Plan
1 Chapter 8. Corporate Governance Statement on pp. 124 for WDP's remuneration policy
1 Chapter 10. Reporting according to recognised standards pp. 170 for the 2021 and 2022 metrics (sBPR and GHG protocol)
Disclosure of the metrics WDP uses to assess climate-related risks and opportunities in line with its strategy and risk management process.
Climate change and -mitigation
green-certified assets (as % portfolio value)
pp. 188
Disclosure of Scope 1, Scope 2, and Scope 3 GHG-emissions in line with the Greenhouse Gas Protocol
See Chapter 10. Reporting according to recognised standards pp. 176.
Describe WDP's targets for managing climate-related risks and opportunities and its performance against targets
For the targets, we refer to the Climate Action Plan.
Active participation in benchmarks, ratings and reporting according to recognised international standards underlines our ambition to take on an increasingly prominent role in all aspects of sustainability. In our choice, we always keep in mind the complementarity and versatility of the benchmarks, in order to communicate as reliably and transparently as possible to the widest possible audience. We are also considering the added value for WDP itself: our participation should enable us to monitor our
Description
progress and better assess our performance in the sector as a whole. Moreover, the scores assigned to WDP on behalf of these ratings or benchmarks are part of the performance targets within the remuneration policy of the Board of Directors, the Management Committee, and #TeamWDP.
The EPRA Sustainability Best Practices Recommendations (sBPR) are intended to standardise and increase the consistency of sustainability reporting of European listed real estate companies. EPRA sBPR is largely based on the GRI Standards and the Construction and Real Estate Sector Supplement Disclosure.
The GRI (Global Reporting Initiative) is an independent, international organisation that helps companies and other organisations to take responsibility and to report transparently and consistently on their economic, environmental, and human impact, as well as their contribution to sustainable development. The GRI Standards are one of the world's most widely used sustainability reporting standards.
MSCI is a leading supplier of decision support tools and services for investors worldwide. MSCI ESG Research assesses, scores and analyses environmental, social, and governance-related business practices (both in terms of risks and opportunities). These ratings, data, and analyses are also used in compiling the MSCI ESG indexes.
ISS ESG Corporate Solutions helps investors benchmark listed companies on their risks and opportunities and how they manage ESG issues using quantitative and qualitative data based on GRI, SASB, and TCFD.
Importance for WDP
The EPRA reporting standards are closely aligned with the (real estate) activities of WDP and ensure transparent and consistent reporting on sustainability by real estate companies. Their alignment with the GRI international standard emphasises their relevance.
Renowned standard for relevant stakeholders – both investors, policymakers, capital markets, and the community. EPRA aligns its reporting with this standard.
MSCI not only analyses and scores companies on environmental aspects, but also does in-depth analysis on governance and social. This rating is very known within the investor community and links up with CDP.
The ISS ESG Corporate Rating provides investors with a clear picture of the strengths and weaknesses in terms of the sustainability strategy of the companies they have analysed. This rating is widely supported within the investor community. The link with GRI and TCFD is considered a plus by WDP.
The Dow Jones Sustainability Indices (DJSI) are a family of indices that evaluate the sustainability performance of listed companies. The DJSI is the reference point for sustainable investment for investors and companies under the auspices of S&P Global. The DJSI is based on an analysis of companies’ economic, environmental, and social performance, assessing corporate governance, risk management, branding, climate change, supply chain standards, and labour practices.
CDP (Carbon Disclosure Project) is an international environmental disclosure system that provides an overview of the environmental metrics and risk management in the areas of climate change, water and deforestation of participating companies. CDP assigns a score based on this data to each company as an indicator of their climate approach. The indicator reflects the company's progress in the area of environmental stewardship.
Inclusion in the DJSI World Index and in the DJSI Europe Index provides autonomous credibility on sustainability and how WDP is committed to ESG. The versatility and thorough analysis of all aspects of ESG, support WDP in further developing its ESG strategy.
Given WDP's efforts towards the objectives of the EU Green Deal, participation in CDP (Climate Change) is a given. In this way, (potential) investors will be able to benchmark WDP's climate approach in an independent and transparent way.
For the period from 1 January 2022 to 31 December 2022, WDP has reported the information presented in this GRI table of contents with reference to the GRI standards.
GRI 1: Foundation 2021
GRI Standard Disclosure Location
GRI 2: General Disclosures 2021
2-1 Organizational details 6, 211, 284
2-2 Entities included in the organization’s sustainability reporting
146, 170, 211-212 Same entities for financial and sustainability reporting
2-3 Reporting period, frequency and contact point 282 Reporting period for financial and sustainability reporting is 1 January 2022 to 31 December 2022 - Annual reporting - This annual report was published on 27 March 2023
2-4 Restatements of information 170-185
2-5 External assurance 263-273 Corporate Governance Charter
2-6 Activities, value chain and other business relationships 6, 9-10, 146 - No significant changes from previous reporting period, except the entry under 27
2-7 Employees 49, 123, 186, 249
2-8 Workers who are not employees 48
2-9 Governance structure and composition 108-119
2-10 Nomination and selection of the highest governance body 108, 118 Corporate Governance Charter
2-11 Chair of the highest governance body 109-113, 117
GRI Standard Disclosure Location
2-12 Role of the highest governance body in overseeing the management of impacts
64, 108-123 Corporate Governance Charter
2-13 Delegation of responsibility for managing impacts 64, 108-119, 122 Corporate Governance Charter Delegation matrix
2-14 Role of the highest governance body in sustainability reporting 59, 64, 114-115, 117-119
2-15 Conflicts of interest 134-136
2-16 Communication of critical concerns 21-22 Grievance mechanism 0 breaches reported
2-17 Collective knowledge of the highest governance body 108-119, 122-123
2-18 Evaluation of the performance of the highest governance body 116 Corporate Governance Charter
2-19 Remuneration policies 124-133 Corporate Governance Charter
2-20 Process to determine remuneration 124-133 Corporate Governance Charter
2-21 Annual total compensation ratio 133
2-22 Statement on sustainable development strategy 3-4 Statement by the Board of Directors and the CEO on sustainability
2-23 Policy commitments WDP policies
2-24 Embedding policy commitments 30, 46-48, 54-56
2-25 Processes to remediate negative impacts 20-56, 137-143 Supplier Code of Conduct
2-26 Mechanisms for seeking advice and raising concerns 63
2-27 Compliance with laws and regulations 21-30 Grievance mechanism 0 breaches reported
2-28 Membership associations Membership in associations and societies
2-29
GRI Standard Disclosure Location
Corporate governance & business ethics
GRI 3: Material Topics 2021 3-3 Management of material topics 30, 63, 105-146
Corporate Governance Charter Code of Ethics
Dealing Code
GRI 205: Anticorruption 2016 205-1 Operations assessed for risks related to corruption Anti-bribery and corruption policy 205-2 Communication and training about anti-corruption policies and procedures
Anti-bribery and corruption policy
205-3 Confirmed incidents of corruption and actions taken 0 breaches reported GRI 415: Public Policy 2016 415-1 Political contributions Membership in associations and societies
Material selection & scarcity
GRI 3: Material Topics 2021 3-3 Management of material topics 31-43, 53-56, 63 Supplier Code of Conduct
Human Rights Policy Climate Action Plan Energy Efficiency
GRI 3: Material Topics 2021 3-3 Management of material topics 31-43, 63, 170-184, 188
Climate Action Plan
GRI 302: Energy 2016 302-1 Energy consumption within the organization 176, 178 302-2
consumption outside of the organization 180, 182
assessed for risks related to corruption
–
–
Communication and training about anti-corruption policies and procedures
Confirmed incidents of corruption and actions taken
–
Fuels-Abs
Fuels-Abs
302-2 Energy consumption outside the organization
Energy consumption within the organization
Energy consumption outside the organization
Fuels-LfL
Energy-Int
Energy consumption within the organization
Group¹ –Fuels-LfL
Energy consumption outside of the organization
Energy intensity
Reduction of energy consumption
Clients – 302-5 Reductions in energy requirements of products and services
Climate change adaptation Cert-Tot CRE8 WDP Group¹ Clients
Energy-Int 302-3 Energy intensity WDP Group¹ Clients
Energy-Int CRE1 WDP Group¹ Clients
– 302-4 Reduction of energy consumption WDP Group¹ Clients
GHG-Int 305-4 GHG emissions intensity
GHG-Int CRE3
1 See also 8. Corporate Governance Statement – Group structure
Group¹ Clients
Group¹ Clients
“Our objectives are based on an ambitious and solid framework and transparent reporting and dialogue with our stakeholders.
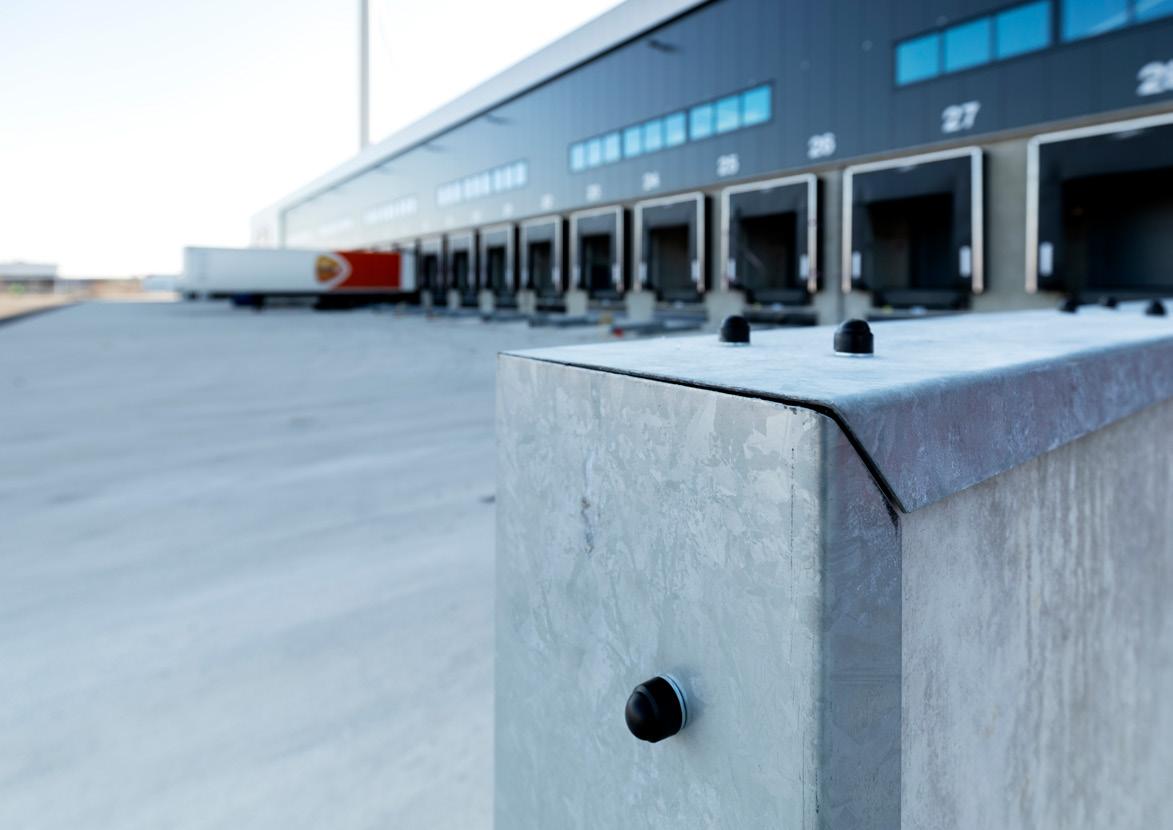
Consolidated statement of the overall result in
1 Including deferred taxes on portfolio result.
2 Calculated on the weighted average number of shares.
1 Including the deferred taxes on the investment portfolio as well as the deferred income tax.
2 This is only the cash-out: after all, in 2021 an optional dividend was offered, with 58% of the shareholders opting for payout of the dividend in shares instead of cash.
3 This also includes the cash revenues from the sale of two pre-hedging instruments amounting to 125 million euros. See also 7. Financial results and property report
1 This includes the variations in the fair value of the portfolio of WDP NV and of the portfolio of the participation interest held for 100% by the mother company.
WDP NV/SA is a public regulated real estate company under Belgian law and has the form of an NV/SA under Belgian law. Its registered office is at Blakebergen 15, 1861 Wolvertem (Belgium). The phone number is +32 (0)52 338 400.
The annual consolidated financial statements of the company as of 31 december 2022 include the company and its subsidiaries. The financial statements were prepared and released for publication by the Board of Directors on 22 March 2023.
WDP is listed on Euronext Brussels and Amsterdam.
The annual consolidated financial statements are drawn up in accordance with the IFRS (Inter national Financial Reporting Standards) as adopted in the European Union and with the legal and administrative regulations applicable in Belgium. These standards include all new and revised standards and interpretations issued by the International Accounting Standards Board (IASB) and the International Financial Reporting Interpretations Committee (IFRIC) that apply to the Group's activities and apply to the financial years beginning as of 1 januari 2022.
The annual consolidated financial statements are presented in thousands of euros, rounded to the nearest thousand. The financial years 2022 and 2021 are listed. For historical financial information about financial year 2020, please refer to the annual reports for 2021 and 2020.
The Dutch-language version of the annual report was drawn up in accordance with the ESEF (European Single Electronic Format) reporting requirements. According to ESEF requirements, the primary financial statements are tagged with XBRL tags and, as of the current financial year, the notes to the financial statements are also block tagged. You can find the annual report in the iXBRL standard at www.wdp.eu. See also 12. Appendices –Report of the statutory auditor on the annual financial statements
Standards and interpretations applicable for the financial year beginning on or after 1 januari 2022
1 Amendment to IFRS 16 Leases: COVID-19-Related Rent Concessions beyond 30 June 2021 (applicable for financial years beginning on or after 1 April 2021 but not yet endorsed in the European Union)
1 Amendments to IAS 16 Tangible fixed assets: Proceeds before Intended Use (applicable for financial years as of 1 January 2022)
1 Amendments to IAS 37 Provisions, Contingent Liabilities and Contingent Assets: Onerous Contracts – Cost of Fulfilling a Contract (applicable for financial years as of 1 January 2022)
1 Amendments to IFRS 3 Business Combinations: Reference to the Conceptual Framework (applicable for financial years as of 1 January 2022)
1 Annual Improvements to IFRS Standards 2018-2020 (applicable for financial years as of 1 January 2022)
New or amended standards and interpretations that have not yet taken effect
A number of new standards, amendments to standards and interpretations were not yet in force in 2022, but could have been applied earlier. Unless stated otherwise, WDP has not yet adopted these. Below is a description of the potential influence of any new standards, amendments or interpretations relevant to WDP on the consolidated financial statements for 2023 and beyond.
1 IFRS 17 Insurance Contracts (applicable for financial years as of 1 January 2023)
1 Amendments to IFRS 17 Insurance Contracts: Initial application of IFRS 17 and IFRS 9 – Comparative information (applicable for financial years as of 1 January 2023, but not yet endorsed in the European Union)
1 Amendments to IAS 1 Presentation of Financial Statements: Classification of Liabilities as Current or Non-current (applicable for financial years beginning on or after 1 January 2023, but not yet endorsed in the European Union)
1 Amendments to IAS 1 Presentation of Financial Statements and IFRS Practice Statement 2: Disclosure of Accounting Policies (applicable for financial years as of 1 January 2023)
1 Amendments to IAS 8 Accounting Policies, Changes in Accounting Estimates and Errors: Definition of Accounting Estimates (applicable for financial years as of 1 January 2023)
1 Amendments to IAS 12 Income Taxes: Deferred Tax related to Assets and Liabilities arising from a Single Transaction (applicable for financial years beginning on or after 1 January 2023, but not yet endorsed in the European Union)
Subsidiaries
Subsidiaries are entities over which the company exercises control. A company exercises control over a subsidiary if, and only if, the parent company:
1 has control over the shareholding;
1 is exposed to, or has rights to variable revenues, by virtue of its involvement in the participation; and
1 has the ability to use its control over the shareholding to influence the amount of investor returns.
The companies in which the Group has control over the financial and operational policy in order to benefit from its activities are included in full in the Group’s annual consolidated financial statements.
This means that the Group’s assets, liabilities and results are indicated in full. All intragroup transactions and profits are fully eliminated. Minority holdings are holdings in subsidiaries that are not held directly or indirectly by the Group.
Joint ventures are companies over which the Group has joint control, as specified by contractual agreement. Such joint control is applicable when the strategic financial and operational decisions with regard to the business require unanimous agreement from the parties that share the control (the shareholders in the joint venture).
Associated companies are the companies over which it is established that the Group has significant control.
As set out in IAS 28 Investments and joint ventures, the results and balance sheet impact of the joint ventures I Love Hungaria NV (in which WDP holds a 50% stake), WDPort of Ghent Big Box NV (in which WDP holds a 29% stake), WDP Luxembourg SA (in which WDP holds a 55% stake) and nanoGrid BV (in which WDP holds as a 25% stake + 1 share) and of the associated company Catena AB (in which WDP holds as a 10% stake) are processed using the equity accounting method. With regard to the statistics in relation to the reporting on the portfolio, WDP’s proportionate share in the portfolio of I Love Hungaria NV, WDPort of Ghent Big Box NV and WDP Luxembourg SA is still shown.
The result from transactions with the above joint ventures is not eliminated in the amount of the share of the WDP Group, but rather fully recognised in the result (under the headings Operating result (before the result on the portfolio) and Financial result).
All transactions between Group companies, balances and unrealised profits and losses on transactions between Group companies are eliminated in the preparation of the annual consolidated financial statements.
If WDP acquires control over an integrated set of activities and assets, as defined in IFRS 3 Business combinations, the identifiable assets, liabilities and contingent liabilities of the acquired company are booked at fair value on the acquisition date. Goodwill is the positive difference between the acquisition costs and the share of the Group in the fair value of the acquired net asset. If this difference is negative (negative goodwill), it is immediately booked in the result after revaluation of the values.
After the initial recognition, goodwill is not written off, but rather subjected to an impairment test conducted every year on the cash flow generating units to which the goodwill is allocated. If the book value of a cash-flow-generating unit exceeds the value in use, the loss of value following from this will be booked in the result and initially included in the reduction of any goodwill, and subsequently to the other assets of the unit, in proportion to their book value. An impairment of goodwill cannot be reversed in a subsequent financial year.
The individual financial statements of each Group member are presented in the currency of the primary economic environment in which the entity operates (its functional currency). For the preparation of the annual consolidated financial statements, the results and the financial position of each entity are expressed in euros, which is the functional currency of the parent company, and the currency used for the presentation of the annual consolidated financial statements.
Transactions in foreign currency are immediately booked at the exchange rate on the transaction date. Monetary assets and liabilities in foreign currency are converted at the closing rate.
Realised and unrealised exchange rate differences are recognised in the profit and loss account, except when they relate to intra-group borrowing that meets the definition of a net investment in a foreign activity. In that case, the exchange rate differences are included in a separate component of shareholders’ equity and recognised in profit and loss after disposal of a net investment.
Assets and liabilities are converted at the closing rate, except for properties, which are converted at the historical rate. The profit and loss account is converted at the average rate over the financial year.
The resulting conversion differences are included in a separate component of shareholders’ equity. These conversion differences are included in the profit and loss account when the foreign entity is disposed of, sold or liquidated.
Land and buildings held to generate rental income over the long term are included as investment properties. On initial recognition, investment properties are valued at the purchase price, including the transaction costs and directly attributable costs.
Land held for the purposes of initiating property developments with a view to subsequent leasing and long-term increase in value, but for which no specific construction plans or project developments (as referred to in the definition of project development) have been initiated (land reserves), is also deemed to be investment property.
The rights of use recognised in the balance sheet for the concession, ground lease, or similar leases (due to entry into force of IFRS 16) are also considered investment properties.
The financing costs directly attributable to acquisition of an investment property are capitalised as well. If special funds are borrowed for a specific asset, the actual financing costs for this loan are capitalised during the period, minus any investment returns from temporary investment of this loan.
After initial recognition, the investment properties are valued at fair value, in accordance with IAS 40. From the seller’s perspective, the valuation is after deduction of the registration fees. These transaction costs depend on the geographical area where these properties are located.
This entails that the transaction costs are incorporated into the profit and loss account as per IAS 40. According to the GVV/SIR Royal Decree, this must then be included in the designated reserves at the end of the financial year.
Property under construction or development for future use as investment property (project development) is also included in Investment properties at fair value.
After initial recognition, the projects are valuated at fair value. The fair value takes substantial development risks into account. In this respect, the following criteria must be met: there must be a clear understanding of the project costs, all permits required for the project development must have been obtained and a substantial part of the project development must be pre-leased (finalised and signed lease). This fair value measurement is based on the valuation by the independent property expert (in accordance with customary methods and assumptions) and takes into account costs to be incurred (including an estimation of unforeseen costs) before final completion of the project.
All charges directly related to the purchase or construction of immovable goods and all other investment expenditures are included in the cost of the development project. In accordance with IAS 23, financing costs attributable directly to the construction or acquisition of an investment property are also capitalised for the period during which the investment property is prepared for leasing.
Capitalisation of financing costs as part of the cost of an eligible asset must begin as soon as:
1 expenses are incurred for the asset;
1 financing costs are incurred;
1 activities are in progress to prepare the asset for its intended use.
The activities required to prepare the asset for its intended use include more than just physical construction of the asset. They also encompass the technical and administrative work before the start of actual construction, such as activities related to obtaining permits. However, such activities do not include holding an asset without carrying out any production or development that changes the condition of the property:
1 financing costs that are incurred during preparation of land, for instance, are capitalised during the period in which these activities occur;
1 on the other hand, financing costs incurred in the period that the land is held for construction purposes without any development activity are not eligible for capitalisation.
Capitalisation of financing costs is suspended during long periods of interruption in active development. Capitalisation is not suspended during periods of extensive technical and administrative work. Nor is capitalisation suspended if a temporary delay constitutes an essential part of the process to prepare a property for its intended use or sale.
The profit/loss realised on the sale is included in the profit and loss account under Result on disposal of investment properties. The result is determined as per IAS 40 and is the difference between the sale price and the fair value from the most recent valuation. This result achieved is recognised at the time of execution of the notarial deed for the sale.
Other tangible fixed assets are valued at their cost less the cumulative depreciations and write-downs. The cost includes all directly attributable costs and the relevant part of the indirect costs incurred in preparing the assets for use.
Future disbursements for repairs are immediately recorded in the result unless they increase the future financial profits of the asset.
The straight-line depreciation method is applied over the estimated useful life of the assets. The useful life and depreciation method are reviewed at least once a year at the end of each financial year. The tangible fixed assets are depreciated according to the following depreciation rates:
1 plant, machinery and equipment: 10-33%;
1 rolling stock: 10-33%;
1 office equipment and furniture: 10-33%;
1 computers: 10-33%;
1 other tangible fixed assets: 10-20%.
These are valuated under the revaluation model as per IAS 16 Tangible fixed assets After initial recognition, assets whose fair value can be reliably established must be booked at the revalued value, which is the fair value at the time of the revaluation, less any subsequent accumulated depreciation and special impairments. The fair value is determined based on the discounting method for future revenues.
The useful life of the solar panels is estimated at thirty years, without taking into account any residual value.
The capital gain when starting a new site is recognised in a separate component of shareholders’ equity. Capital losses are also recognised in this component, unless they have been realised or the fair value drops below the original cost less cumulative depreciation. In the latter case, they are included in the result.
At the start of the lease period, the leases (except for leases with a maximum term of twelve months and leases whose underlying assets are of low value) are recognised on the balance sheet as rights of use and lease liabilities at the present value of the future lease payments. Next, all rights of use that qualify as investment properties are valued at fair value, in accordance with the valuation rules detailed under Investment properties The minimum lease payments are recognised in part as financing costs and in part as settlement of the outstanding liability, in a manner resulting in a constant periodic interest rate on the remaining balance of the liability. The cost of financing is offset directly against the result. The cost of financing is offset directly against the result. Conditional lease payments are incorporated as costs in the periods in which they were made.
If a lease meets the conditions of a financial lease (according to IFRS 16), WDP as the lessor will recognise the lease from its start date as a receivable in the balance sheet at an amount equal to the net investment in the lease. The difference between this latter amount and the book value of the leased property (exclusive of the value of the residual right held by WDP) at the start of the lease will be recognised in the profit and loss account
for that period. Each periodic payment made by the lessee will be partly recognised by WDP as a repayment of the capital and partly as financial income based on a constant periodic return for WDP.
The residual right held by WDP will be recognised at its fair value on each balance sheet date. This value will increase every year and will correspond to the market value of the full right of ownership at the end of the lease. These increases will be recognised in Variations in the fair value of investment properties in the profit and loss account.
On the balance sheet date, the tangible and intangible fixed assets of the Group are examined for indications that the book value of an asset is greater than the recoverable value.
If such indications are present, the realisable value of the asset must be estimated. Goodwill is subject to an annual test for special impairment, regardless of whether there is an indication of such.
A special impairment is booked if the book value of an asset or the cash flow generating unit to which the asset belongs is higher than the realisable value.
The realisable value is the value in use or the fair value less sales charges, whichever is higher. The value in use is the capitalised value of the expected future cash flows for the continued use of the asset and its disposal at the end of its useful life, on the basis of a discount rate that takes into account the current market evaluations for the time value of the cash and the risks inherent to its assets. The fair value minus sales charges is the amount that may be realised from the sale of an asset in a commercial, objective transaction between well-informed independent parties between whom there is a consensus ad idem, after deduction of the disposal costs.
For an asset that does not generate significant cash income in itself, the realisable value is established for the cash flow generating unit to which the asset belongs.
If the book value of an asset or a cash flow generating unit is higher than the realisable value, the surplus is recorded immediately as a special impairment in the profit and loss account.
Special impairments recognised in previous financial years are reversed if a subsequent increase in the recoverable value can be objectively connected to a circumstance or event that took place after the special impairment was booked. Special impairments on goodwill are not reversed.
All financial assets are recognised or no longer recognised in the balance sheet on the transaction date if the purchase or sale of a financial asset is based on a contract prescribing conditions for delivery of the asset within the term generally prescribed or agreed on the market in question and initially valued at fair value, plus transaction costs, except for financial assets at fair value with changes in value in the profit and loss account, which are initially valued at fair value.
The financial assets are classified in one of the categories provided for in IFRS 9 Financial instruments based on both the business model of the entity for management of the financial assets and the properties of the contractual cash flows of the financial assets and are recorded on their initial recognition. This classification determines the valuation of the financial assets on future balance sheet dates: amortised cost or fair value.
Financial assets are classified at fair value with changes in value through profit or loss if they are held for trading purposes. Financial assets at fair value with changes in value through profit or loss are valued at fair value, with all resulting income and expenditures recognised in the result. Derivatives are also included in the category at fair value with changes in value through profit or loss, unless they are considered to be hedges and are effective.
Financial assets are classified at fair value with changes in value through shareholders’ equity if they are held for hedge accounting. Financial assets at fair value with changes in value due to shareholders’ equity are valued at fair value, with any resulting gain or loss recognised in shareholders’ equity. Derivatives also belong to the category at fair value with changes in value through shareholders’ equity if they were designated and effective as hedges.
Financial assets at amortised cost are not derivatives and are retained within a business model geared towards retaining financial assets to receive contractual cash flows (Held to collect) and on certain dates, the contractual conditions of the financial asset give rise to cash flows that are exclusively for settlement of and interest payments on the outstanding principal (Solely Payments of Principal and Interest – SPPI). This category includes cash and cash equivalents, non-current receivables and trade receivables. Cash equivalents are short-term, very often liquid investments that can be immediately converted to cash of a known amount, have an original term of no more than three months and entail no significant risks of impairment. The cash equivalents held by WDP consist of bank deposits and are therefore fully valuated at amortised cost.
Financial liabilities are classified as financial liabilities at fair value through profit or loss or as financial liabilities at amortised cost.
Financial liabilities are classified at fair value through profit or loss if they are held for trading purposes. Specifically, for WDP, these are Interest Rate Swaps for which hedge accounting is not applied to the extent that they have a negative fair value. Financial liabilities at fair value through profit or loss are valued at fair value, with all resulting income and expenditures recognised in the result. A financial liability is included in this category if it is primarily acquired for sale in the short term. Derivatives are also included in the category at fair value through profit or loss, unless they are considered to be hedges and are effective.
Financial liabilities are classified at fair value through shareholders’ equity if these are held for hedge accounting. Financial liabilities at fair value through shareholders’ equity are valued at fair value, with all resulting income or expenditures recognised in shareholders’ equity. Derivatives also belong to the category at fair value through shareholders’ equity if these were designated as hedges and are effective.
Financial liabilities valuated at amortised cost, including debts, are initially valuated at fair value after deduction of the transaction costs. After initial recognition, they are valuated at amortised cost. The Group’s financial liabilities valued at amortised cost include the non-current financial liabilities (bank debts, lease debts, bond loans), other non-current liabilities, current financial liabilities, trade debts and payable dividends in the other current liabilities.
valued at amortised cost in foreign currency are a non-cash item and are considered unavailable as such.
Equity instruments issued by the Group are classified based on the economic reality of the contractual agreements and the definitions of an equity instrument. An equity instrument is any contract that includes the remaining interest in the assets of the Group, after deduction of all liabilities. The accounting policies with regard to equityinstruments are described below.
Equity instruments issued by the company are recognised for the sum of the amounts received (after deduction of directly attributable issue costs).
The Group uses derivatives to limit risks related to unfavourable interest rates resulting from the operational, financial and investment activities within the framework of its operational management. The Group does not use these instruments for speculative purposes, does not hold any derivatives and does not issue derivatives for trading purposes.
Changes in the fair value of derivatives that do not qualify as hedges are recognised immediately in profit or loss. Changes in the fair value of derivatives allocated specifically to hedge the variability of cash flows of a recognised asset or liability or a forecast transaction are recognised in Other elements in the overall result
Fixed assets and groups of assets to be disposed of are classified as Assets held for sale if their book value will mainly be realised in a sale transaction and not by their continued use. This condition is only met if the sale is highly likely and the asset (or group assets to be disposed of) is immediately available for sale in its current state. The management must have agreed to a plan for the sale of the asset (or group assets to be disposed of), which is expected to be eligible for recognition as a completed sale within one year after the date of the classification.
A fixed asset (or group of assets being disposed of) classified as held for sale is recognised at book value or fair value less costs of sale, whichever is lower.
Investment properties intended for sale are valued the same way as other investment properties (at fair value). These investment properties are presented separately in the balance sheet.
A provision is included when:
1 the Group has an existing – legal or constructive – obligation as a result of an event in the past;
1 it is likely that an outflow of funds may be required to settle the obligation; and
1 the amount of the liability can be reliably estimated.
The recognised provision is the best estimate on the balance sheet date of the funds needed to settle the existing liability, possibly discounted if the time value of the cash is relevant.
The Company has a number of defined contribution retirement schemes. A defined contribution pension scheme is a pension plan under which the Company pays fixed contributions to a separate company. The Company has no legal or constructive obligation to pay further contributions should the fund not have sufficient assets to pay out the pensions of all employees with regard to services that they have provided in current or past periods of employment. Contributions are recognised as expenses when they are due and will be included under staff costs at that time.
For permanent personnel, salaries, additional remunerations, retirement compensations, and compensations for dismissal or disruption are included in the profit and loss account in the period to which they pertain.
Rental income includes rents and revenues directly related to these, such as compensation for early lease termination.
Revenue is valued at the fair value of the received or receivable compensation. Revenue is only recognised if it is likely that the economic benefits will befall the entity and can be determined with sufficient certainty.
Rental income, and other income and expenses, are recognised in the profit and loss account in the period to which they pertain.
The fees for premature lease termination are recognised immediately in the result for the financial year.
The proceeds from the sale of green energy to the tenant, the sale of green energy to the lessor and green energy certificates are recognised when the green energy is generated.
Lease-related costs pertaining to write-downs and decreases in trade receivables that are recognised in the results if the book value is higher than the estimated realisation value and the rent to be paid on leased assets.
Rental charges and tax on leased buildings and the recovery of these costs that fall to the tenant or lessee by law or custom. Depending on the contractual agreements, the owner may or may not pass these charges on to the tenant.
Other income and charges related to leases include the passing of management fees on to tenants as well as other revenues that do not fall under rental income (including revenue from solar energy).
The General company expenses are expenses related to the management and general operation of WDP. This includes expenses such as general administrative costs, staff costs for general management, and depreciation of assets used for general management.
Costs related to works performed in the buildings are booked in various ways depending on the type of works:
1 maintenance and repair: maintenance and repair costs are booked as property costs for the accounting period, given that these do not increase the expected future economic benefits of the building and do not add any functionality or improve the level of comfort in the building;
1 improvement and renovation: these are works carried out occasionally to add features to the property and considerably increase the expected future economic benefits of the building. The costs of these works (materials, contractor remuneration, technical studies, internal expenses, architect remuneration and interest during the construction period) are capitalised. Examples: installation of a new air conditioning system, new roof, thorough renovation of all or part of the building. Worksites for which costs are being capitalised are identified beforehand according to the above-mentioned criteria.
GVV/SIR status offers a fiscally transparent status, given that a GVV/SIR is only subject to tax on specific components of the result, such as disallowed expenses and exceptional and gratuitous advantages. No corporate tax is paid on profits from leases or realised capital gains.
Tax on the result for the financial year includes taxes due and deductible taxes for the current and previous reporting periods, the deferred tax and the exit tax due. The tax charge is recognised in the profit and loss account unless it pertains to components recognised directly in the shareholders’ equity. This latter case also includes the tax on shareholders’ equity.
To calculate the tax on the year’s taxable profit, tax rates applicable on the balance sheet date are used.
Exit taxes – tax on capital gains resulting from a merger of a GVV/SIR with a non-regulated real estate company – are deducted from the established revaluation surplus at merger and if applicable are recognised as a liability.
In general, deferred income taxes (tax assets) are recognised for all taxable (deductible) temporary differences. Such claims and liabilities are not recorded if the temporary differences result from the initial recognition of goodwill or the initial recognition (other than in a business combination) of other assets or liabilities. Deferred tax assets are recognised to the extent that it is likely that a tax benefit will be available against which the deductible temporary difference can be offset. Deferred tax assets are reduced when it is no longer likely that the associated tax benefit will be realised.
1 Determining whether control, joint control or significant influence is being exercised over investments (see explanatory note III. Accounting principles).
1 Determining whether an entity holding investment property is a business, and thus also determining, in the acquisition of control over an entity of this kind, whether the acquisition is regarded as an IFRS 3 Business combination, is a significant assessment. As of July 2022, WVI GmbH is a wholly owned subsidiary of WDP Invest NV/SA, under the name of WDP Deutschland GmbH. WDP Deutschland GmbH is fully consolidated within the WDP Group as of 1 July 2022. Given the current definition of a “business” under IFRS 3 and accompanying guidelines, management concluded that WDP Deutschland is not a business given that the full fair value of the assets acquired is contained in one portfolio of similar assets.
The fair value of the investment properties is determined by independent property experts according to the GVV/SIR regulations (see explanatory note XII. Investment properties).
1 In 2022, income from solar energy totalled 22.902 million euros against 17.754 million euros in 2021. This income was generated in Belgium (13.277 million euros), the Netherlands (4.908 million euros) and Romania (4.717 million euros). In addition to the income from solar energy, the property management fees and other operating income/costs are part of the Other income and charges related to leases
2 The joint ventures are incorporated using the equity accounting method, as per IFRS 11 Joint arrangements. The table shows the operating result (before overhead expenses and based on the proportionate share of WDP) and then gives the reconciliation with the proportionate share in the results of these entities, as reported under the equity accounting method as per IFRS. WDP Deutschland GmbH was until 30th of June 2022 a joint venture.
The basis for reporting per segment within WDP is the geographical region. This segmentation basis reflects the geographical markets in Europe in which WDP is active. WDP’s business is subdivided in five regions. More information on which subsidiaries are located within the geographical regions can be found in the group structure, see note VII. Information on subsidiaries
This segmentation is important for WDP given that the nature of its business, its clients, etc. represent similar economic characteristics within these segments. Business decisions are taken at this level and different key performance indicators (such as rental income, occupancy rates, etc.) are monitored in this manner.
A second segmenting basis is not considered relevant by WDP as the business mainly focuses on the leasing of logistics sites.
Ghent Big Box NV - Blakebergen 15 - 1861 Wolvertem - Belgium6
- Churchillsteenweg 17 - 9320 Aalst - Belgium7
Luxembourg SA - Zone d'activité économique Wolser G 440 - 3434 DudelangeLuxembourg8
GmbH - Lothringenweg 12 - 14974 Ludwigsfelde - Germany9
AB - Landskronavägen 23 - 252 32 Helsingborg - Sweden10
1 WDP Development NL N.V. was founded in August 2011 as a permanent development company for own account of WDP Nederland N.V.
2 On 7 June 2013 WDP acquired 100% of the shares in Eurologistik 1 Freehold BVBA, holding the rights to an existing logistic site in Vilvoorde.
3 As part of the streamlining of the Group and its foreign non-REIT participations, the shares of WDP Romania SRL and WDP Luxembourg SA held by WDP NV/SA were contributed to WDP Invest NV/SA on 22 December 2020 by way of capital increase by contribution in kind. WDP Invest acts as an autonomous investment and financing vehicle for the international activities of the Group as from the aforementioned date.
4 At the beginning of March 2022, WDP acquired through a contribution in kind 100% of the shares of Sigmo NV, which ownes three sites in Dendermonde. This transaction is not considerated as a business combination.
5 This is a joint venture founded in May of 2015 between WDP NV/SA and project developer L.I.F.E. NV/SA with a view to redevelopment of the Hungaria building in Leuven.
6 The joint venture was set up in December 2020 between WDP NV/SA and the co-shareholders Sakolaki and Vendis Capital (shareholders of Exterioo, Juntoo and X²O Badkamers), in view of the expansion of the WDPort of Ghent that will be leased by these retailers.
7 WDP and energy proptech company nanoGrid (founded by Joost Desmedt) cemented their partnership with a 25%+1 stake int the last quarter of 2021. The consolidated result before tax of nanoGrid BV amounts to -0,02% of the consolidated result before tax of WDP NV. The consolidated assets of nanoGrid BV amounts to 0,03% of the consolidated assets of WDP NV.
8 This is a joint venture, of which the Luxembourg government owns 45% and of which WDP acquired 55% of the shares on 13 October 2017.
9 On the 18th of December 2019 WDP NV/SA bought, through its fully subsidiary WDP Invest NV/SA, a participation in of 50% in WVI Gmbh, a joint venture with VIB Vermögen. From July 2022, WVI GmbH is a 100% subsidiary of WDP Invest NV, forming WDP Deutschland GmbH. This transaction is not deemed to be a business combination.
10 At the beginning of April 2022, WDP and Catena AB realized a stategic partnership (see note XXIII. Transactions between related parties). Joost Uwents was appointed as a director on Catena's Board of Directors at Catena's annual General Meeting.
The group structure is shown visually under 8. Corporate Governance Statement.
I love Hungaria NV/SA, WDPort of Ghent Big Box NV, nanoGrid BV and WDP Luxembourg SA are the joint ventures in the Group and are consolidated under the equity accounting method. The stake in associated company Catena AB is also accounted for in the consolidated accounts using the equity method.
A reconciliation difference does not exist between the value recognised on the balance sheet under the equity accounting method and the proportionate share of the shareholders’ equity of these joint ventures, nor were dividends paid out from these joint ventures, nor do any limits apply to cash transfers to other Group companies.
In the segment information, WDP Luxembourg SA and WDP Deutschland GmbH (until 30 June 2022) are shown separately given their geographical distance. I Love Hungaria NV, WDPort of Ghent Big Box NV and nanoGrid BV are shown under Other joint ventures
This table contains an overview of the future rental income (including the income from solar energy) under the current agreements. It is based on the non-indexed rents received up to and including the first due date, as set out in the leases.
The impact of the applied indexing of rents in the financial years 2022 and 2021 amounts to an average of respectively 4.2% and 1.3%.
The future income with respect to the previous year rose by 12.4%. This mainly stems from the strong portfolio growth (see also 7. Financial results and property report) as well as the impact of the indexation of 2022 and 2021 as explained above.
Currently, WDP sees stability on a high level in both increased construction prices and longer delivery times for new projects. WDP charges this on via higher rents for the new projects.
Moreover, WDP relies on an inflation-proof cash flow profile thanks to indexation clauses in the leases combined with rising market rents.
Rents are normally paid monthly in advance (sometimes quarterly). They are indexed annually on the anniversary date of the lease.
According to the contractual provisions, taxes and charges (including withholding tax), insurance premiums and collective charges are passed on to the tenant. The tenant must pay a monthly (or quarterly) charge for this. The tenant receives an annual invoice for the actual expenses.
To ensure compliance with the duties that the contract imposes on the tenant, the latter must provide a deposit, usually in the form of a bank deposit equivalent to six months of rent.
At the start of the lease contract, a joint property survey is conducted between the parties by an independent expert. On expiry of the contract, the tenant must return the leased space in the same condition as described in the move-in inspection report, apart from normal wear and tear. A move-out inspection report is prepared. The tenant must pay for repairing any damage that is determined, and should the premises be unavailable during repair.
The tenant is not permitted to carry out any high-risk activities in the spaces it rents, without the prior written approval of WDP. In such cases, WDP may demand that the tenant take certain precautions. Before the end of the contract, tenants who have performed a risk activity during the lease period must have an exploratory soil inspection carried out, and if soil pollution is established, pay for any clean-up operations and consequential damage.
The tenant is responsible for obtaining operational and environmental authorisation. Refusal or withdrawal of such authorisation will not be cause for dissolution or annulment of the contract.
The tenant may not transfer the contract or sublease the leased premises without prior written authorisation from WDP.
If approval is granted to transfer a lease, the original tenant shall remain jointly and severally liable to WDP. The tenant is obligated to register the agreement at its own expense.
A capital gain of 0.5 million euros was achieved. In 2022, we sold the sites at Ghimbav (Brasov) – DE 301/305, KM 0+500 (Romania), Zwolle – Kleefstraat 8 (The Netherlands) and part of the site at Leuven – Vaart 25-35 (Belgium).
The comments on the Financial result are available under 7. Financial results and property report pp. 74
The cost of capital is increasing due to the accelerated evolution of a number of external factors (including market volatility and weakening macroeconomic outlook) combined with geopolitical tensions. WDP remains focused on its long-term profit targets using measures that include a high hedge ratio for the debts with limited maturity over the next five years.
WDP’s risk policy with respect to the financial policy is explained in 9. Risk factors pp. 153.
When preparing the profit and loss account, a situation was taken into account as of 1 January 2021 in which WDP could not continue to qualify as FBI in the Netherlands, due to the current significant uncertainty in view of the tax ruling that was revoked as of 1 January 2021, as explained earlier.1
The impact on EPRA earnings is approximately -1 million euros per quarter and on the portfolio results is over 2022 of 41.8 million euros via deferred tax on the property. WDP processes these commissions in its accounts out of a principle of prudence. Given that a tax ruling is not an absolute requirement to be able to apply the FBI regime, and that WDP believes that it meets all the conditions and the circumstances and facts are unchanged, the company will continue to file its tax returns as an FBI.
In the announcement of the Dutch 2023 budget on 20 September 2022, WDP noted the declaration of intent to use a legislative amendment to exclude real estate from the Dutch FBI regime as of 1 January 2024. WDP is disappointed with this chosen path given the previously favourable report by the independent Dutch research institute SEO commissioned by the Dutch Ministry of Finance and given the social and economic contribution that can be made by listed REITs. In response to this report, the Finance Cabinet decided to postpone its entry into force to 1 January 2025.
However, this announcement has no direct impact on WDP because the company took the precaution of assuming a non-FBI scenario in the preparation of its accounts – and thus also for the 2022-25 growth plan. However, for the period prior to 1 January 2025 (specifically 2021-24), the competent authorities in the Netherlands have not yet taken a position. Nevertheless, WDP remains convinced that the company continues to meet all conditions within the current legislative framework and that the facts and circumstances remain unchanged in the period leading up to 1 January 2025 (if the Dutch government follows through with plans to abolish the real estate FBI).
1 The insured value is the new-build value for which 100% of the property portfolio is insured. This is excluding the land.
Capital expenditures pertain to investments made as part of new acquisitions, in-house project developments, and investments within the existing portfolio (for more information, see 7. Financial results and property report pp. 89.
WDP is aware of the evolution of certain external factors, including market volatility, a weakening macroeconomic outlook, a rising cost of capital and changed credit cycle and heightened geopolitical tensions. Currently, WDP sees stability on a high level in both increased construction prices and longer delivery times for new projects. WDP charges this on via higher rents for the new projects.
The property portfolio is valued at fair value. The fair value is based on non-observable inputs, which means assets in the investment properties fall under level 3 of the fair value hierarchy as defined in accordance with IFRS. No changes in the fair value hierarchy level took place in 2022. For information: Level 1 of the fair-value hierarchy specifies that the fair value is based on listed (non-adjusted) prices in an active market for identical assets or liabilities, while level 2 is based on different information from level 1, which can be determined directly or indirectly for the assets or liabilities in question.
No assets are not valued according to their highest, optimum use, as no assets are being used for less than their optimum use.
The negative change in the valuation of investment property is explained by an adjustment in yields. The sharp rise in interest rates, scarcer and more expensive capital and an uncertain macroeconomic outlook have led to sharply reduced liquidity in the property market. Indeed, the changed price expectation today creates a high bid/ask spread between buyers and sellers and has led to a significantly lower number of transactions in the investment market. On the other hand, there is sufficient interest and capital available for investment in logistics property because of its solid long-term fundamentals. However, the market is searching for a new balance given the new economic parameters. This trend has led to an adjustment in yields applied by property appraisers as of the fourth quarter of 2022.
The result for the Netherlands is negatively impacted by an increase of the registration costs (transfer tax) from 8 to 10.4% as of 1 January 2023, which will be deducted in calculation of the fair value. WDP has already recognised this impact of -61 million euros in the fourth quarter of 2022.
The gross rental yield – after the addition of the estimated market rent value of the nonleased parts – is 5.7% as of 31 December 2022 compared to 5.2% at the end of 2021.
During 2022, WDP identified a net investment volume of approximately 530 million euros (including solar panels), consisting of new projects and land as well as the purchase of existing buildings and investments in energy transition, in addition to the existing strategic 10% stake in Catena AB. For a detailed description of the various individual acquisitions and the pre-leased and other projects completed and under construction, please see 4. Performance and trends on pp. 25.
The following table shows a comparison between the annual rental income for purchased properties and the rental income actually received since the purchase of the properties in the course of 2022 (in particular the year of purchase of these properties). In 2022, it was also decided to sell some non-strategic sites at Leuven (BE), Zwolle (NL) and Ghimbav (RO). These sites generated rents in an amount of 306,447 euros in 2022.
The estimation of a site consists of determining its value on a specific date, in other words, the price at which the site would likely be tradable between well-informed buyers and sellers, in the absence of information asymmetries, who wish to perform a similar transaction, without taking account of any particular agreement between them. This value is the investment value when it corresponds to the total price payable by the buyer, plus any transaction costs or VAT, if the purchase is subject to VAT. The fair value, in the sense of the IAS/IFRS reference scheme, can be obtained by deducting an adjusted minimum charge for transaction costs and/or the VAT from the investment value. To calculate the changes in the fair value, the hypothetical local transaction costs are deducted from the investment value. On average, these breakdown as follows by country: Belgium: 2.5%, The Netherlands: 10.4%, France: 6.9%, Germany: 7.75%, Luxembourg: 7% and Romania: 1.5%.
1 For other non-observable inputs not shown in the above table, please refer to section 10. Reporting according to recognised standards on pp. 159 and 7. Financial results and property report on pp. 89. The summary above shows the non-observable inputs used to determine the fair value of the existing property portfolio and for the projects under development.
2 For the ERV, only the rents for the available spaces are taken into account. The wide range (min./max.) is due to the different kinds of storage premises (from outdoor storage to refrigerated warehouses).
The sensitivity of the fair value with regard to changes in significant non-observable inputs used in determining the fair value of objects classified as level 3 according to the IFRS fair-value hierarchy, is as follows (ceteris paribus):
Impact on fair value at:
Decrease Increase
ERV (in euros/m²) negative positive
Discount rate positive negative
Required yield positive negative
Remaining lease duration (until first break) negative positive
Remaining lease duration (until expiry date) negative positive
Occupation rate (EPRA) negative positive
Projected growth in rent (inflation) negative positive
In addition, it is usually the case that an increase (decrease) in the remaining period of a rental contract leads to an increase (decrease) in the discount rate (and required yield). An increase (decrease) in the occupancy rate may result in a decrease (increase) in the discount rate (and required yield).
In addition, the sensitivity of the fair value of the portfolio can be estimated as follows (based on a ceteris paribus approach): the effect of an increase (decrease) of 1% of rental income leads to an increase (decrease) in the fair value of the portfolio of approximately 62 million euros (ceteris paribus). The effect of an increase (decrease) in the required return of 25 basis points gives rise to a decrease (increase) in the fair value of the portfolio of approximately 306 million euros (ceteris paribus).
The valuation process at WDP follows a centralised approach where the policy and procedures with regard to property estimates are determined by the CEO and CFO, after approval by the audit committee. In addition, it is determined which independent property expert will be appointed for the various parts of the property portfolio. Contracts will typically be signed for a renewable term of three years subject to a double rotation obligation according to the Law of 12 May 2014 in the scope of a GVV/SIR. Some examples of the selection criteria would be local market knowledge, reputation, independence and insurance of the highest professional standards. Property expert fees are set for the period of their appointment and are not related to the value of the objects appraised.
Independent property experts are appointed for each country, to ensure proper consideration for the special characteristics of each geographical region and thus also the diversified, pan-European nature of the property portfolio. The property portfolio is valued externally by independent property experts on a quarterly basis. The valuation method is determined by the external expert and is based on a multi-criteria approach. The independent property expert determines the fair market value based on a discounted cash-flow model, an income capitalisation method and/or comparable market transactions. In addition, estimates determined in this way are compared to the initial yield and available points of comparison via recent market transactions for comparable objects (including those purchased by WDP itself during that year). The valuation cycle within one financial year consists of a site visit after which a detailed estimate report is drawn up for each object as well as three desktop reviews in which new information provided by WDP with regard to the lease situation are reflected, and the most important assumptions with regard to significant non-observable inputs are recognised.
The independent property expert has full access to all quantitative and qualitative information with regard to the property portfolio. The Controllers are responsible for continuous contact with and provision of information to the relevant property experts (such as all leases, information on occupancy rate, maturity dates, investments and maintenance and repair costs). Twice a year, the CEO and Country Manager also discuss the asset management plan for each object in detail with the property expert. When estimate reports are handed in quarterly, all material differences (positive and negative) are compared in absolute and relative terms with the previous four quarters and analysed by the Controllers and the CFO. Based on this, the CEO and CFO then conduct a detailed discussion with the respective property experts to ensure that all data with regard to the sites are reflected accurately and exhaustively in the estimate, with specific attention to property development projects. The property experts draw up an independent estimate of the future cash-flow profile and reflect the risks via a combination of cash-flow projections (rental growth, vacancy, incentives, investments, etc.) as well as the applied required yields or discount rates. Next, the final property estimates are submitted to the Audit Committee.
1 The revenues consist of the sale of green energy certificates and of green energy to the tenant and/or energy supplier, minus costs associated.
Valuation method Discounted cash flow Discounted cash flow
Implicit number of sunshine hours
The model assumes an implicit 950 sunshine hours per year. This is based on weather statistics and the available data at the end of the year. On 31 December 2022, the solar park consisted of 50 sites.
Green Energy Certificates (GECs) Green Energy Certificates (GECs) in Flanders are issued to each project by the Flemish Electricity and Gas Market Regulator (the ‘VREG’) at a fixed price per certificate for a fixed period of twenty years. The price of certificates for operational sites vary between 0-450 euros per MWh.
Green energy certificates in Wallonia are issued to each project by the Wallonia Energy Commission (the 'CWaPE') at a guaranteed price per certificate for a fixed period of ten years. The price of certificates for operational sites is 67.5 euros per certificate.
The model assumes an implicit 900 sunshine hours per year. This is based on weather statistics and the available data at the end of the year. On 31 December 2022, the solar park consisted of 56 sites.
Each project receives a subsidy from the Netherlands Enterprise Agency (the ‘RVO’) for a period of fifteen years. The maximum subsidy amount allocated per MWh produced depends on the time of request and is set so the maximum yield including subsidy is 79 to 148 euros per MWh.
The model assumes an implicit 1,250 sunshine hours per year. This is based on weather statistics and the available data at the end of the year. As at 31 December 2020, the solar panel installations were spread across four sites.
Green Energy Certificates (GEC) are issued to each project by the ANRE (Romanian Energy Regulatory Authority) for a fixed period of fifteen years. The PV projects for WDP in Romania receive 6 GECs per MWh of green energy produced . Certificates can subsequently be sold on the regulated market at a price of 29 euros per certificate. With regard to solar parks, WDP has a 10-year purchasing agreement with Enel (a global leader in the energy market) that expires in 2023, after which the new certificates must be sold on the market.
Energy price
Discount rate
For the energy-price, long-term expectations based on research models are used and an inflation rate of 1.5% per annum.
The required yield is calculated as the weighted average cost of the capital according to long-term interest, market risk premium and country-specific risk.
For the energy-price, long-term expectations based on research models are used and an inflation rate of 1.5% per annum.
The required yield is calculated as the weighted average cost of the capital according to long-term interest, market risk premium and country-specific risk.
For the energy-price, long-term expectations based on research models are used and an inflation rate of 1.5% per annum.
The required yield is calculated as the weighted average cost of the capital according to long-term interest, market risk premium and country-specific risk.
Decrease in yield
The yield of the PV installation has decreased by 0.6% per year and will be decommissioned after thirty years. No account was taken here of any possible residual value of the installation, nor of the costs of dismantling the installation.
Maintenance and CapEx Account is taken of the various operational costs related to exploitation as well as a ten-year maintenance cost in order to keep the expected evolution of the operational condition intact.
The yield of the PV installation has decreased by 0.6% per year and will be decommissioned after thirty years. No account was taken here of any possible residual value of the installation, nor of the costs of dismantling the installation.
Account is taken of the various operational costs related to exploitation as well as a ten-year maintenance cost in order to keep the expected evolution of the operational condition intact.
The sensitivity of the fair value with regard to changes in significant non-observable inputs used in determining the fair value of objects classified as level 3 according to the IFRS fair-value hierarchy, is as follows (ceteris paribus):
Impact on fair value at:
Non-observable inputs decrease increase
Implicit number of sunshine hours negative positive
Green Energy Certificates (GECs) negative positive
Energy price negative positive
Discount rate positive negative
Efficiency of solar panels negative positive
Maintenance and capex positive negative
In addition, the sensitivity of the fair value of the solar panels can be estimated as follows (based on a ceteris paribus approach): the effect of an increase (decrease) of the required yield of 25 base points leads to a decrease (increase) in the fair value of the solar panels of approximately 3 million euros.
There is no standardised valuation model for investments in solar panels. The fair value of these assets is calculated by WDP according to a discounted cash flow model based on future cash flows.
The valuation cycle within a financial year consists of a fully detailed estimate update per year end of all assumptions and the expected cash flows as well as three desktop reviews in which a roll forward of the model is performed and the most important assumptions with regard to significant non-observable inputs are recognised.
The data and input with regard to the expected future cash flows are continuously verified with the available statistics over the totality of the PV systems, whereas a consistent, comparable analysis is made of the financial return requirements of investors. The Audit Committee validates the definitive fair value calculations on a quarterly basis.
The Flemish Government is considering the abolition of green energy certificates linked to the production of PV plants in Flanders that went into service before 2013, with effect from 1 January 2024. For these projects, the guaranteed support period for the certificates was fixed at 20 years and this period expires gradually over the years 2028-32. This is an annual revenue stream of approximately 7 million euros that as of 1 January 2024 has a remaining weighted average of six years. This corresponds to about 2% of total sales and 3% of EPRA Earnings in 2022. WDP is monitoring this closely with its legal advisors.
The entirety of the financial instruments of the Group corresponds to levels 1, 2 and 3 in the hierarchy of the fair values. Valuation against fair value occurs regularly.
In the event of bankruptcy of one of both contracting parties, the net position of the derivatives will be considered for the counterparty.
Level 1 in the hierarchy of fair values includes money investments, funds, and cash equivalents regarding which the fair value is based on the share price.
Level 2 in the hierarchy of fair values concerns the other financial assets and liabilities of which the fair value is based on observable inputs and other data that can be determined, directly or indirectly, for the assets or liabilities concerned. The valuation techniques concerning the fair value of the financial instruments at level 2 are as follows: the fair value of the above financial assets and liabilities are valued at the book value, except for bond loans and fixed-rate loans, where fair value is determined under a discounted cash flow model based on quarter-end market interest rates since they are not traded frequently (level 2). Because the other financial liabilities are incurred at a floating interest rate, the fair value is very close to the book value.
Level 3 in the fair value hierarchy retains the property portfolio and financial liabilities recognised in accordance with IFRS 16 whose fair value is determined using nonobservable inputs.
For some of its investments, WDP does not have full ownership, but rather only usufruct through a concession, ground lease, or similar arrangement. Specifically, a financial liability is recognised for this in accordance with IFRS 16. This financial liability is included under Other non-current financial liabilities and Other current financial liabilities. The financial liability is the present value of all future lease payments. The discount rate applied in determining this liability was based on a combination of the interest curve plus a spread according to the WDP credit risk, both in line with the remaining duration of the underlying right of use.
The sensitivity of the calculation of this financial liability can be estimated as follows (based on a ceteris paribus approach): the effect of an increase respectively a decrease in the discount rate of 50 basis points would give rise to a decrease (increase) in the financial liability of 3.7 million euros, respectively 4.3 million euros, with an impact of 0.06% on the gearing ratio (in accordance with the GVV/SIR Royal Decree).
(contractual cash flows and non-updated interest)
The Group uses derivative financial instruments to hedge the interest rate risk on its financial debts in order to reduce the volatility of EPRA Earnings (which forms the basis for the dividend) while minimising the cost of debt. Given the high hedge ratio of 97.4% at year end 2022, both the interest rate risk and the volatility of the EPRA Earnings are limited. These hedges are managed centrally through a macro-hedging policy. The Group does not use derivative financial instruments for speculative purposes and does not hold derivatives for trading purposes.
Changes in the fair value of derivatives that do not qualify as hedges are recognised immediately in profit or loss. Changes in the fair value of derivatives allocated specifically to hedge the variability of cash flows of a recognised asset or liability or a forecast transaction are recognised in the section Other elements in the overall result
In January 2022, the Group entered into two pre-hedges (interest rate swaps) for a total nominal amount of 500 million euros each, which enable the Group to convert the variable interest rate for its expected future debt issues into a fixed interest rate. The pre-hedges were settled on the issuance of the debt (the placement of 500 million euros of green
bonds through US private placement2 and the syndicated loan of 440 million euros3). Their fair value was settled in cash at that time.
The Group has determined that these financial instruments meet the conditions for hedge accounting. These instruments were initially recognised at fair value on the date in which the derivatives hedging interest rate risk were entered into, and subsequently measured at their fair values on subsequent closing dates. The pre-hedges were viewed as hedging instruments in a cash flow hedging relationship of a highly probable expected future transaction (debt issuance), changes in the fair value of the pre-hedges were included in the section Other components in the overall result for the period until the pre-hedges were settled. This positive value will be distributed over the profit and loss over the life of the loans issued. These hedges are considered fully effective given that the terms of these pre-hedges are consistent with the characteristics of the debt issued and the pre-hedges were settled on or around the date of issuance of the debt. Consequently, no ineffectiveness was included in the profit and loss account as of 31 December 2022.
The contracts are valued at fair value as per IFRS 9 on the balance sheet date. This information is received from the various financial institutions and verified by WDP by discounting the future contractual cash flows based on the corresponding interest rate curves.
Fair value is based on observable inputs, and as such, the IRS contracts fall under level 2 in the fair value hierarchy as defined in IFRS. The fair value is calculated based on a discounted cash flow model using the relevant market interest rates indicated in the forward interest curve on the balance sheet date. No changes in the fair value hierarchy level took place in the past year. During this period, no hedging instruments were arranged prior to the maturity date. A number of existing hedging instruments were extended by flattening them over time in a cash-neutral manner.
The changes in fair value and the valuation of the hedging instruments at fair value on the balance sheet date are as follows:
Besides the above, 122 million euros was also included via Other elements in the overall result for pre-hedging instruments.
The table below gives an overview of the impact of the fair value of the IRS if the interest rate rises or falls by a max. of 0.50%
Change in the interest rate Impact on the change in fair value of the IRSes as at 31.12.2022 (in euros x 1,000,000)
For the impact of interest rate changes on EPRA Earnings, please refer to 7. Financial results and property report pp. 103.
Liquidity requirement on the maturity dates linked to the derivatives
For a detailed overview of financial and other risks, their limiting factors and control, see Chapter 9. Risk factors pp. 153. For a discussion of the management of financial risks (including credit risk, liquidity risk, interest risk, counterparty risk), see Chapter 7. Financial results and property report pp. 82. Please also refer to the sensitivity analysis in Chapter 7. Financial results and property report pp. 104 and explanatory note XX. Statement of financial debt.
At present, an amount of 8.6 million euros of Assets held for sale is listed on the balance sheet.
The provision for doubtful debts is 3.3 million euros and has increased slightly compared to last year.
A clear procedure is followed to determine provisions to be created for doubtful debts, with quarterly estimates of the expected losses on outstanding trade receivables and with application of corresponding write-downs. Under this method, the book value of the trade receivables approaches their fair value. With regard to the policy on accounts receivable, WDP ensures a regular screening of the creditworthiness of its tenant portfolio. In addition, outstanding customer balances are reported internally to all sales and technical staff every month. They can ensure adequate follow-up on rent in arrears by means of their direct contact with the customer.
Trade receivables are payable prior to the regular lease period. The table below shows the past due trade receivables.
More generally, credit risks are limited by the fact that WDP guarantees an adequate distribution amongst its tenants. Besides the legal standard of 20%, an in-house goal has been set that no more than 10% of the rental income may come from one customer (currently 4%). For the main tenants, see 7. Financial results and property report pp. 93. Moreover, credit risks are limited by a maximum risk of 5% per site (currently 2%).
The section Acquisition of associated companies and joint ventures includes the interest in Swedish listed logistics real estate company Catena AB (see note XXIII. Transactions between related parties)
The tax receivables are primarily related to the investments in Romania and the Netherlands for the new construction projects. This is because of the absence of a cocontractor system, so 19% and 21% VAT is recoverable on each investment respectively. The increase in other current assets is attributable to receivables from joint ventures and advances related to property investments.
1 With a view to increased marketability, accessibility and attractiveness of WDP shares, the WDP share was split by a factor of 7 with effect from 2 January 2020. The figures displayed already take into account the WDP share split.
1 In March 2022, a capital increase via contribution in kind for 36.8 million euros took place. As a result, the number of shares entitled to a dividend for the 2021 (payable in 2022) amounts to 185,931,267.
2 Calculated on the weighted average number of shares.
WDP has only one class of shares, namely ordinary shares (without face value). Holders are entitled to receive the declared dividend and have one vote per share at the Annual General Meeting of Shareholders.
All shares are fully paid up and are either registered or dematerialised.
The Board of Directors is authorised, within the limits of the mandatory provisions of the applicable company law, to increase the capital in accordance with the authorisation granted to it regarding authorised capital. On 31 December 2022, the Board of Directors used the authorisation granted to it on 27 April 2022 for the Sigmo NV, Qualiphar,
Sedimmo / Sedis and the ABB (accelerated bookbuild) transactions. The decision was made in the Extraordinary General Meeting of 2 February 2023 to renew the authorisation of the authorised capital. For more information on authorised capital, see chapter 12. Appendices pp. 289.
For the shareholder structure as of the balance sheet date, see chapter 6. Shares and bonds
For further background information on the financial debts, please refer to Chapter 7. Financial results and property report pp. 82.
For further information on the applicable financial covenants, see explanatory note XXIV. Rights and obligations not recognised in the balance sheet. For a complete overview of sensitivity, please refer to the relevant table in Chapter 7. Financial results and property report pp. 104.
For the calculation of the gearing ratio according to the GVV/SIR legislation, please refer to 12. Appendices pp. 277.
For some of its investments, WDP does not have full ownership, but rather only usufruct through a concession, ground lease, or similar arrangement. The financial liability is the present value of all future lease payments. The table below shows the maturity dates for this liability.
In October 2022, a capital increase was realised through an exempted accelerated private placement with international institutional investors with order book composition. A sum of 16,588,000 euros (i.e. 715,000 shares) were assigned to the management body RTKA.
WDP acquired 100% of the shares of WVI, following the buyout of partner VIB Vermögen AG, and this entity was fully consolidated as of 1 July 2022. The purchase took place under normal market conditions and in accordance with the terms and conditions laid down in the original joint venture agreement dated 18 December 2019.
In the first half of 2022, WDP took a 10% stake in Swedish-listed logistics property company Catena AB with a view to a strategic partnership. Moreover, WDP subscribed to a capital increase using an accelerated exempted private placement in November 2022. To maintain the 10% stake, 454,494 shares for 164 million SEK were granted to WDP.
1 FTE stands for Full-Time Equivalents.
For its permanent personnel, WDP has taken out a group insurance contract with a defined contribution plan with an external insurance company. The Company makes contributions to this fund, which is independent of the Company. The company funds the insurance plan contributions. The group insurance contract applies the Vandenbroucke Law on pensions. The insurance company confirmed on 31 December 2022 that the shortfall for guaranteeing the statutory minimum yield is not substantial.
The remuneration in 2022 of the non-executive directors (in the amount of 265,000 euros), the remuneration of Tony De Pauw (in the amount of 763,816 euros), the remuneration of Joost Uwents (in the amount of 1,440,539 euros), as well as the remunerations of the members of the Management Committee (in the amount of 2,643,959 euros, excluding the remunerations of the two CEOs) are explained in the remuneration report in Chapter 8. Corporate Governance Statement pp. 124.
In 2022, transactions also occurred between WDP and its joint ventures I Love Hungaria NV, WDP Luxembourg SA, nanoGrid BV, WDPort of Ghent Big Box NV, and its associated company Catena AB. The table below provides an overview of the WDP outstanding receivables for the joint ventures. This primarily involves the long-term receivables, short-term receivables, charged management fee, and financial income booked in WDP and received from I Love Hungaria NV, WDP Luxembourg SA, nanoGrid BV, and WDPort of Ghent Big Box NV. The transactions were effected on market terms.
WDP NV/SA and its subsidiaries had bank guarantees in place for a total of 5,195,009 euros as of 31 December 2022, the beneficiaries of which fall under the following categories for the following amounts:
1 Limitation on projects that have still not been pre-let (speculative developments) to 15% of the book value of the portfolio (excluding land reserves). As of 31 December 2022, this ratio is 0.1%.
1 A maximum of 30% of the financial debts with the subsidiaries compared to the financial debts of the group. As of 31 December 2022, this ratio is 2.5%.
WDP has entered into the following commitments with financiers2:
1 Commitment not to burden the assets with collateral, such as mortgages (negative pledge). WDP confirms that as of 31 December 2022, no mortgages or other collateral are outstanding in the property portfolio or other assets.
1 A commitment that it will continue to qualify as a GVV/SIR. For the conditions on this, please see the Belgian Act of 12 May 2014 and the Royal Decree of 13 July 2014. For more information, see 12. Appendices pp. 284.
WDP has undertaken several commitments as a part of its ongoing investment programme related to projects and acquisitions, as stated in 4. Performance and trends pp. 25.
Parent company WDP NV/SA has extended the following sureties for its various subsidiaries:
1 A security for the commitments of WDP Nederland N.V. amounting to 25 million euros for ABN AMRO (for the short-term amounts financed through a straight loan of max. 25 million euros, 5.8 million euros of which has been drawn).
1 A security for the commitments of WDP Luxembourg SA amounting to 30 million euros in favour of Banque et Caisse d’Epargne de l’Etat.
The WDP financing agreements include the following covenants:
1 An Interest Coverage Ratio1 of at least 1.5x. For 2022, this is 5.9x.
1 A statutory and consolidated gearing ratio below 65% in line with the GVV/SIR Law. As of 31 December 2022, these are 37.3% and 37.6% respectively.
1 For some financiers, WDP has agreed to repay the credit if a change of control occurs and the financier consequently asks for repayment.
As of 31 December 2022, WDP complies with all covenants with and commitments to all financiers.
1 Defined as operating result (before result on the portfolio), divided by interest rates, minus interest and dividend collection, minus compensation for financial leasing and others.
2 The term ‘financiers’ means the credit institutions as well as financiers through debt capital markets, such as, bondholders or investors in the commercial paper programme.
The statutory auditor(s) and the people with whom they are associated
special assignments that the statutory auditor(s) perform within the Company
Pursuant to Article 3:64, §1-5 CCA: without prejudice to the prohibitions arising from Article 3:63 CCA, the statutory auditor may not perform any services other than the assignments entrusted by law or European Union legislation to the statutory auditor, insofar as the total amount of the fees for these services amounts to more than seventy percent of the total amount of the fees referred to in article 3:65, § 2 of the CCA. The 70% rule must be calculated as an average over the duration of the current mandate. The fees for services invoiced by Deloitte Bedrijfsrevisoren BV are considered with regard to this calculation, with the exception of fees for legal assignments entrusted to the statutory auditor of the company. WDP NV has not exceeded the 70% rule as of 31 December 2022.
Across the world, we see a tightening of climate policies and regulations to shift the economy away from fossil fuels towards a lower-carbon economy. The consequential requirements through tightening of climate policies can result in restrictions on the letting or the sale of buildings that do not comply with minimum standards. The same goes for technologically obsolete buildings which may require higher maintenance costs or capex requirements to meet minimum efficiency standards and modern work trends. This could potentially impact how the market views such risks and how this is reflected in property sales and rentals. In the valuations, the independent property experts reflect their understanding of how the market currently allows for sustainability and climate regulations in real estate transactions.
There are no significant events after the balance sheet date.
The management of these climate-related risks is an integral part of the WDP Group's risk management approach, see Chapter 9. Risk factors pp. 153. So, WDP launched its ambitious climate plan in January 2022, the WDP Climate Action Plan. The WDP Climate Action Plan is a clear and transparent framework addressing both climate risks and business opportunities (see 4. Performance and trends pp. 20 For example, among other things, WDP set itself the target of implementing the recommendations of the TCFD (Task pp. 20). Force on Climate-related Financial Disclosures) by 2024, see 10. Reporting according to recognised standards pp. 159.
The statutory auditor has issued an unqualified opinion on the statutory annual financial statements of WDP NV/SA. These are drawn up in accordance with IFRS as adopted within the European Union and as per the Belgian Royal Decree of 7 December 2010.
The statutory financial statements had not yet been submitted at the time of publication of this annual report.
Share in the profit or loss and in the unrealised results of subsidiaries, associated shareholding, joint ventures that are administratively
profit
loss and in
unrealised results of
associated shareholding, joint ventures that are administratively processed according to the 'equity'-method
1 Calculated on the weighted average number of shares.
1. Addition to/withdrawal from the reserve for the (positive or negative) balance of the variations in the fair value of investment properties¹
2. Addition to the reserve for the balance of variations in the fair value of permitted hedging instruments that are not subject to hedging accounting as defined in IFRS
3. Withdrawal from the reserve for the balance of variations in the fair value of permitted hedging instruments that are subject to hedging accounting as defined in
4. Addition to the reserve for the balance of variations in the fair value of permitted hedging instruments that are not subject to hedging accounting as defined in IFRS
5. Withdrawal from the reserve for the balance of variations in the fair value of permitted hedging instruments that are not subject to hedging accounting as defined in IFRS
from the reserves for the balance of exchange rate differences for monetary assets and liabilities
from deferred tax reserves in relation to foreign property
from reserves for the receipt of dividends intended for financial debt repayment
1 This item consists out of the result on the portfolio of the 100%-affiliates. Deferred taxes on investment properties are not taken into account.
2 This item mainly includes the result on the portfolio of the participating interests of which WDP holds less than 100%.
WDP applies the look-through approach in its statutory financial statements. This means that as far as 100% subsidiaries are concerned, EPRA Earnings (being the underlying cash earnings of the core activity) are considered to be available and distributable at the level of the parent company, regardless of whether these earnings have flowed up to the parent company as dividends. In this context, the share in the results of these 100% subsidiaries is not fully allocated to the unavailable reserves. Instead, the different elements that make up these results are considered separately. The share in the result
of these 100% participations is allocated to the unavailable and available reserve items as if it were the results of the parent company-GVV/SIR itself (there is, as it were, a consolidation approach in the separate annual accounts at the level of the result processing). The results of non-100% subsidiaries are fully allocated to the unavailable reserves.
Distribution obligation in accordance with the GVV/SIR Royal Decree of 13 July 2014
The mandatory distribution in the GVV/SIR legislation only relates to the adjusted net result as shown in the separate annual accounts for the GVV/SIR (drawn up in accordance with the IFRS). The FSMA circular of 2 July 2020 recommends that the look-through approach, when applied, should also be taken into account in determining the mandatory distribution amount. WDP has applied this in the above table for its 100% subsidiaries, which means, in concrete terms, that the EPRA Earnings of these subsidiaries have been included in the calculation of the mandatory distribution amount (also taking into account the company law rules applicable to the subsidiary concerned; in other words: the parent GVV/SIR is not obliged to distribute any results that cannot be distributed by the subsidiary due mainly to differences between the IFRS and local accounting rules).
of companies and associations in euros (x 1,000)
capital or, if it is higher, called-up capital
Issue premiums not available according to the Articles of Association¹
for the positive balance of the variations in the fair value
for the balance of changes in fair value of authorised hedging instruments subject to hedge accounting as defined by
Reserves for the balance of variations in the fair value of permitted hedging instruments that are not subject to hedging accounting as defined in IFRS
de changes liées à la conversion
Reserve voor het aandeel in de winst of het verlies en in de niet-gerealiseerde resultaten van de niet 100%-deelnemingen die adminstratief verwerkt worden volgens de 'equity'-
WDP applies the look-through approach in its statutory financial statements. This means that as far as 100% subsidiaries are concerned, EPRA Earnings (being the underlying cash earnings of the core activity) are considered to be available and distributable at the level of the parent company, regardless of whether these earnings have flowed up to the parent company as dividends.
After all, the subsidiaries of the WDP parent company generally draw up their separate financial statements in line with local accounting standards, which often deviate from the IFRS rules applicable to the consolidated (and separate) financial statements of the parent company as a GVV/SIR. As a result, the net result of the subsidiary in its separate annual accounts (on which its distribution of dividends is based) often differs from the contribution of that subsidiary to the consolidated net result. In addition, restrictions apply under local legislation, meaning the full cash earnings of the subsidiaries cannot flow up as dividends, with the latter also effectively being distributed with a one-year delay. Based on the look-through approach, these earnings are considered to be distributable at the level of the parent company, even though they have not yet effectively been realised at the parent company from a statutory perspective.
Non-distributable shareholders’ equity as per Article 7:212 of
Given the international character of the WDP group, the company considers it important to be able to apply the look-through approach in the context of its dividend policy. In that context, WDP pays out more as dividends on a consolidated level than what it generates on a statutory level as cash profits (but realises on a consolidated group level, whereby it has a low pay-out ratio on a consolidated level), by using the look-through approach to view the cash profits (including undistributed profits) of the 100% subsidiaries as distributable at the group level. WDP believes that this does not constitute a problem neither for the parent company nor for the subsidiaries, since they are fundamentally sound and this cash has been effectively realised in the subsidiaries and is also fully available in the parent company (among other things, by accrual through interest, dividends, repayment of loans,
1 The issue premiums issued in 2022 and 2021 were not included here as these are booked on an available account.
2 It relates to the reserve for the positive balance of the variation in the fair value of properties from the mother company and the 100% subsidiaries.
3 Based mainly on the revaluation reserves for the solar panels and the related deferred tax (including variations in the fair value of subsidiaries with regard to solar panels and the related deferred tax) and the impact of IFRS 16 on shareholders’ equity (including variations in the fair value of subsidiaries with regard to IFRS 16), given that these are a non-distributable reserves. This pertains to a non-cash item.
are administratively processed
Reserves for the balance of variations in the fair value of permitted hedging instruments that are not subject to hedging accounting as defined in IFRS
Net result of the financial
1 This concerns the changes in fair value of the real estate of WDP NV/SA and the real estate of the participations held for 100%.
Dear Sirs,
We are pleased to present you with our estimate of the value of the property portfolio of WDP NV as of 31 December 2022.
WDP appointed us as independent property experts to determine the fair value of its property portfolio. Estimates were made taking into account both the observations and definitions mentioned in the reports, and the guidelines of the International Valuation Standards issued by the IVSC.
The fair value is defined in standard IAS 40 as the amount for which the property could be exchanged between knowledgeable, willing parties in an arm's length transaction. IVSC deems these conditions to be met if the above-mentioned definition of fair value is respected. The fair value must reflect the current lease contracts, the reasonable assumptions relating to potential rental income and the expected costs.
As property experts, we possess relevant and recognized credentials as well as up-todate experience with properties of a type and location similar to those of the properties in WDP's property portfolio.
In giving an estimate of the properties, we took into account both the current rental agreements and all rights and obligations arising from these agreements. Each property was valuated separately. The estimates do not account for any potential capital gain that might be realized by offering the portfolio on the market in its entirety. Our estimates also do not account for marketing costs specific to a transaction, such as estate agents' fees or publicity costs. In addition to an annual inspection of these properties, our estimates are also based on the information provided by WDP regarding the rental situation, surface areas, sketches or plans, rental charges and taxes associated with each property concerned, compliance and environmental pollution. The information provided was deemed accurate and complete. Our estimates assume that undisclosed items are not such that they would affect the value of the property.
Each independent property expert is responsible for valuing the part of the portfolio that was contractually assigned to him or her.
Based on the above statements, we can confirm that the fair value of the property portfolio of WDP (excluding solar panels but including assets held for sale) on 31st of December 2022 amounted to 6,492,139,542 euros (six billion, four hundred ninety two million, hundred thirty nine thousand five hundred forty two euros) 1
Yours faithfully,
Nicolas Janssens
Partner | Stadim
Greet Hex
Director, Valuations & Advisory | Jones Lang LaSalle Belgium
Willem Rodermond
Executive Director | CBRE Netherlands
Kristiaan Engelman
Partner Valuations & Advisory – The Netherlands | Cushman & Wakefield
Jean-Claude Dubois
President of the Valuation department | BNP Paribas Real Estate Valuation France
Roderick Scrivener
Head of Valuations & Consulting Belux | Jones Lang LaSalle Secs
Florin Ianculescu-Popa Director | CBRE Romania
Kristine Kühn Director | CBRE GmbH
Statutory auditor’s report to the shareholders’ meeting of Warehouses De Pauw NV/SA for the year ended 31 December 2022 - Consolidated financial statements.
In the context of the statutory audit of the consolidated financial statements of Warehouses De Pauw NV/SA (“the company”) and its subsidiaries (jointly “the group”), we hereby submit our statutory audit report. This report includes our report on the consolidated financial statements and the other legal and regulatory requirements. These parts should be considered as integral to the report.
We were appointed in our capacity as statutory auditor by the shareholders’ meeting of 29 April 2020, in accordance with the proposal of the board of directors (“bestuursorgaan”/“organe d’administration”) issued upon recommendation of the audit committee. Our mandate will expire on the date of the shareholders’ meeting deliberating on the financial statements for the year ending 31 December 2022. We have performed the statutory audit of the consolidated financial statements of Warehouses De Pauw NV/SA for 16 consecutive periods.
We have audited the consolidated financial statements of the group, which comprise the consolidated balance sheet as of 31 December 2022, the consolidated profit and loss account, the consolidated statement of overall result, the consolidated statement of changes in equity and the consolidated statement of cash flow for the year then ended, as well as the summary of significant accounting policies and other explanatory notes. The consolidated balance sheet shows total assets of 7 053 848 (000) EUR and the consolidated income statement shows a profit for the year then ended of 363 453 (000) EUR.
In our opinion, the consolidated financial statements give a true and fair view of the group’s net equity and financial position as of 31 December 2022 and of its consolidated results and its consolidated cash flow for the year then ended, in accordance with International Financial Reporting Standards (IFRS) as adopted by the European Union and with the legal and regulatory requirements applicable in Belgium.
We conducted our audit in accordance with International Standards on Auditing (ISA), as applicable in Belgium. In addition, we have applied the International Standards on Auditing approved by the IAASB applicable to the current financial year, but not yet approved at national level. Our responsibilities under those standards are further described in the “Responsibilities of the statutory auditor for the audit of the consolidated financial statements” section of our report. We have complied with all ethical requirements relevant to the statutory audit of consolidated financial statements in Belgium, including those regarding independence.
We have obtained from the board of directors and the company’s officials the explanations and information necessary for performing our audit.
We believe that the audit evidence obtained is sufficient and appropriate to provide a basis for our opinion.
Key audit matters are those matters that, in our professional judgment, were of most significance in our audit of the consolidated financial statements of the current period. These matters were addressed in the context of our audit of the consolidated financial statements as a whole and in forming our opinion thereon, and we do not provide a separate opinion on these matters.
Valuation of investment properties
1 Investment properties measured at fair value (6 351 916 (000) EUR) represent more than 91 percent of the consolidated balance sheet total as of 31 December 2022. Changes in the fair value of the investment properties have a significant impact on the consolidated net result for the period and equity.
1 The portfolio includes completed investments and properties under construction. Acquisitions and divestments of investment properties are individually significant transactions.
1 The Group uses professionally qualified external valuers to fair value the Group’s portfolio at three-monthly intervals. The valuers are engaged by the Directors and they perform their work in accordance with the International Valuation Standards issued by the ‘IVSC’. The valuers used by the Group have considerable experience in the markets in which the Group operates.
1 The portfolio is valued based on a discounted cash flow model, or income capitalisation model and / or based on comparative market transactions. Development properties are valued by the same methodology with a deduction for all costs necessary to complete the development together with a remaining allowance for risk. The key inputs into the valuation exercise are yields and current market rent, which are influenced by prevailing market forces, comparable transactions and the specific characteristics of each property in the portfolio.
1 Therefore, the audit risk relates to the assumptions and critical judgments linked to those key inputs.
1 We considered the internal control implemented by management and we tested the design and implementation of controls over investment properties.
1 We assessed the competence, independence and integrity of the external valuers.
1 We analysed and challenged the valuation process, performance of the portfolio and significant assumptions and critical judgement areas, including yields and estimated rental values.
1 We benchmarked and challenged the key assumptions that were used in the valuation to external industry data and comparable property transactions, in particular the yield.
1 We performed audit procedures to assess the integrity and completeness of information provided to the independent valuers relating to rental income, key rent contract characteristics and occupancy.
1 We agreed the amounts per the valuation reports to the accounting records and from there we agreed the related balances through to the financial statements.
1 As part of our audit procedures performed on the acquisitions and divestments of investment properties, we examined the most significant contracts and documentation on the accounting treatment applied to these transactions.
1 For development properties, we also confirmed that the supporting information for construction contracts and budgets was consistent with the cost to complete deducted from the valuation of development properties. Capitalized expenditure was tested on a sample basis to invoices, and budgeted costs to complete were compared to supporting evidence (for example by inspecting original construction contracts).
1 Furthermore, we assessed the appropriateness of the disclosures provided on the fair values of investment properties.
We refer to the Annual Accounts, including notes to the Annual Accounts: Note III. Accounting principles and Note XII. Investment properties
The board of directors is responsible for the preparation and fair presentation of the consolidated financial statements in accordance with International Financial Reporting Standards (IFRS) as adopted by the European Union and with the legal and regulatory requirements applicable in Belgium and for such internal control as the board of directors determines is necessary to enable the preparation of consolidated financial statements that are free from material misstatement, whether due to fraud or error.
In preparing the consolidated financial statements, the board of directors is responsible for assessing the group’s ability to continue as a going concern, disclosing, as applicable, matters to be considered for going concern and using the going concern basis of accounting unless the board of directors either intends to liquidate the group or to cease operations, or has no other realistic alternative but to do so.
Our objectives are to obtain reasonable assurance about whether the consolidated financial statements as a whole are free from material misstatement, whether due to fraud or error, and to issue a statutory auditor’s report that includes our opinion. Reasonable assurance is a high level of assurance, but is not a guarantee that an audit conducted in accordance with ISA will always detect a material misstatement when it exists.
Misstatements can arise from fraud or error and are considered material if, individually or in the aggregate, they could reasonably be expected to influence the economic decisions of users taken on the basis of these consolidated financial statements.
During the performance of our audit, we comply with the legal, regulatory and normative framework as applicable to the audit of consolidated financial statements in Belgium. The scope of the audit does not comprise any assurance regarding the future viability of the company nor regarding the efficiency or effectiveness demonstrated by the board of directors in the way that the company’s business has been conducted or will be conducted.
As part of an audit in accordance with ISA, we exercise professional judgment and maintain professional skepticism throughout the audit. We also:
1 identify and assess the risks of material misstatement of the consolidated financial statements, whether due to fraud or error, design and perform audit procedures responsive to those risks, and obtain audit evidence that is sufficient and appropriate to provide a basis for our opinion. The risk of not detecting a material misstatement resulting from fraud is higher than for one resulting from an error, as fraud may involve collusion, forgery, intentional omissions, misrepresentations, or the override of internal control;
1 obtain an understanding of internal control relevant to the audit in order to design audit procedures that are appropriate in the circumstances, but not for the purpose of expressing an opinion on the effectiveness of the group’s internal control;
1 evaluate the appropriateness of accounting policies used and the reasonableness of accounting estimates and related disclosures made by the board of directors;
1 conclude on the appropriateness of the use of the going concern basis of accounting by the board of directors and, based on the audit evidence obtained, whether a material uncertainty exists related to events or conditions that may cast significant doubt on the group’s ability to continue as a going concern. If we conclude that a material uncertainty exists, we are required to draw attention in our statutory auditor’s report to the related disclosures in the consolidated financial statements or, if such disclosures are inadequate, to modify our opinion. Our conclusions are based on the audit evidence obtained up to the date of our statutory auditor’s report. However, future events or conditions may cause the group to cease to continue as a going concern;
1 evaluate the overall presentation, structure and content of the consolidated financial statements, and whether the consolidated financial statements represent the underlying transactions and events in a manner that achieves fair presentation;
1 obtain sufficient appropriate audit evidence regarding the financial information of the entities and business activities within the group to express an opinion on the consolidated financial statements. We are responsible for the direction, supervision and performance of the group audit. We remain solely responsible for our audit opinion.
We communicate with the audit committee regarding, amongst other matters, the planned scope and timing of the audit and significant audit findings, including any significant deficiencies in internal control that we identify during our audit.
We also provide the audit committee with a statement that we have complied with relevant ethical requirements regarding independence, and we communicate with them about all relationships and other matters that may reasonably be thought to bear on our independence, and where applicable, related safeguards.
From the matters communicated to the audit committee, we determine those matters that were of most significance in the audit of the consolidated financial statements of the current period and are therefore the key audit matters. We describe these matters in our report unless law or regulation precludes any public disclosure about the matter.
The board of directors is responsible for the preparation and the content of the directors’ report on the consolidated financial statements.
As part of our mandate and in accordance with the Belgian standard complementary to the International Standards on Auditing (ISA) as applicable in Belgium, our responsibility is to verify, in all material respects, the director’s report on the consolidated financial statements and other matters disclosed in the annual report on the consolidated financial statements, as well as to report on these matters.
In our opinion, after performing the specific procedures on the directors’ report on the consolidated financial statements, this report is consistent with the consolidated financial statements for that same year and has been established in accordance with the requirements of article 3:32 of the Code of companies and associations.
In the context of our statutory audit of the consolidated financial statements we are responsible to consider, in particular based on information that we became aware of during the audit, if the directors’ report on the consolidated financial statements and other information disclosed in the annual report on the consolidated financial statements, i.e.:
1 the required sections of Warehouses De Pauw NV's annual report in accordance with articles 3:6 and 3:32 of the Belgian Companies and Associations Code, as set out in the following sections of the annual report: 3. Strategy and value creation, 4. Performance and trends, 6. Financial results and property report, 8. Corporate Governance Statement, 9. Risk factors and 11. Annual accounts are free of material misstatements, either by information that is incorrectly stated or otherwise misleading. In the context of the procedures performed, we are not aware of such a material misstatement.
1 Our audit firm and our network have not performed any prohibited services and our audit firm has remained independent from the group during the performance of our mandate.
1 The fees for the additional non-audit services compatible with the statutory audit, as defined in article 3:65 of the Code of companies and associations, have been properly disclosed and disaggregated in the notes to the consolidated financial statements.
In accordance with the draft standard on the audit of the compliance of the financial statements with the Single European Electronic Format (“ESEF”), we have also performed the audit of the compliance of the ESEF format and of the tagging with the technical regulatory standards as defined by the European Delegated Regulation No. 2019/815 of 17 December 2018 (“Delegated Regulation”).
The board of directors is responsible for the preparation, in accordance with the ESEF requirements, of the consolidated financial statements in the form of an electronic file in ESEF format (“digital consolidated financial statements”) included in the annual financial report.
Our responsibility is to obtain sufficient and appropriate evidence to conclude that the format and the tagging of the digital consolidated financial statements comply, in all material respects, with the ESEF requirements as stipulated by the Delegated Regulation.
Based on our work, in our opinion, the format and the tagging of information in the official language of the digital consolidated financial statements included in the annual financial report of Warehouses De Pauw NV as of 31 December 2022 are, in all material respects, prepared in accordance with the ESEF requirements as stipulated by the Delegated Regulation.
1 This report is consistent with our additional report to the audit committee referred to in article 11 of Regulation (EU) No 537/2014.
Signed at Zaventem.
The statutory auditor
Deloitte Bedrijfsrevisoren/Réviseurs d’Entreprises BV/SRLTo the board of directors of Warehouses De Pauw NV/SA Blakebergen 15
B-1861 Wolvertem
Dear ladies and gentlemen
We report on the forecasted EPRA earnings (as defined in August 2011 (and amended in November 2016) in the report “Best Practices Recommendations Guidelines” of the European Public Real Estate Association) of Warehouses De Pauw NV/SA (“WDP”, “the Company”) and its subsidiaries (together “the Group”) for the 12 months period ending 31 December 2023 (the “Profit Forecast”). The Profit Forecast, and the material assumptions upon which it is based are set out in Chapter 7 Financial results and property report, paragraph Outlook of the 2022 annual report of the WDP Group (the “Annual Report”) issued by the Company. We do not report on the other elements of the net result nor on the EPRA earnings per share, the projected dividend or the projected balance sheet.
This report is voluntarily required upon request by the board of directors of the Company for the purpose to confirm the Profit Forecast has been compiled and prepared in accordance with elements (a) and (b) as defined under item 11.2 of Annex 1 of the Commission Delegated Regulation (EU) 2019/980 supplementing Regulation (EU) 2017/1129 of the European Parliament and of the Council as regards the format, content, scrutiny and approval of the prospectus to be published when securities are offered to the public or admitted to trading on a regulated market and repealing Commission Regulation (EC) No 809/2004 (the “Commission Delegated Regulation”) and for no other purpose.
It is the responsibility of the directors of the Company (the “Directors”) to prepare the Profit Forecast in accordance with Annex 1 section 11 of the Commission Delegated Regulation.
It is our responsibility to form an opinion as to the proper compilation of the Profit Forecast and to report that opinion to you.
Save for any responsibility arising under art. 26 of the Law of 11 July 2018 to any person as and to the extent there provided, to the fullest extent permitted by law we do not assume any responsibility and will not accept any liability to any other person for any loss suffered by any such other person as a result of, arising out of, or in accordance with this report or our statement, required by and given solely for the purposes of complying with Annex 1 item 1.3 of the Commission Delated Regulation, consenting to its inclusion in the Universal Registration document.
The Profit Forecast has been prepared on the basis stated in Chapter 7 Financial results and property report, paragraph Outlook of the annual report and is based on a forecast for the 12 months to 31 December 2023. The Profit Forecast is required to be presented on a basis consistent with the accounting policies of the Group.
We conducted our work in accordance with the International Standard on Assurance Engagement 3400 “The Examination of Prospective Financial Information” (“ISAE 3400”) issued by the International Auditing and Assurance Standards Board (“IAASB”). Our work included evaluating the basis on which the historical financial information included in the Profit Forecast has been prepared and considering whether the Profit Forecast has been accurately computed based upon the disclosed assumptions and the accounting policies of the Group. Whilst the assumptions upon which the Profit Forecast are based are solely the responsibility of the Directors, we considered whether anything came to
our attention to indicate that any of the assumptions adopted by the Directors which, in our opinion, are necessary for a proper understanding of the Profit Forecast have not been disclosed or if any material assumption made by the Directors appears to us to be unrealistic.
We planned and performed our work so as to obtain the information and explanations we considered necessary in order to provide us with reasonable assurance that the Profit Forecast has been properly compiled on the basis stated.
Since the Profit Forecast and the assumptions on which it is based relate to the future and may therefore be affected by unforeseen events, we can express no opinion as to whether the actual results reported will correspond to those shown in the Profit Forecast and differences may be material.
Our work has not been carried out in accordance with auditing or other standards and practices generally accepted in jurisdictions outside Belgium, including the United States of America, and accordingly should not be relied upon as if it had been carried out in accordance with those standards and practices.
In our opinion, the Profit Forecast has been properly compiled on the basis stated which is comparable with the historical financial information and is consistent with the accounting policies of the Group.
For the purposes of art. 26 of the Law of 11 July 2018 we are responsible for this report as part of the Universal Registration document and declare that we have taken all reasonable care to ensure that the information contained in this report is, to the best of our knowledge, in accordance with the facts and contains no omission likely to affect its import. This declaration is included in the Universal Registration document in compliance with Annex 1 item 1.2 of the Commission Delegated Regulation.
Signed at Zaventem. The statutory auditor Deloitte Bedrijfsrevisoren / Réviseurs d’Entreprises BV/SRLRepresented by Rik Neckebroeck
Independent assurance report on selected environmental, social and governance performance indicators published in the Annual report of Warehouses De Pauw NV/SA for the year ended 31 December 2022.
We have been engaged to conduct a limited assurance engagement on selected environmental, social and governance performance indicators (“Selected Information”) published in the Annual report of Warehouses De Pauw NV/SA (“the Company”) for the year ending 31 December 2022. In preparing the Selected Information, Warehouses De Pauw NV/SA applied the Best Practices Recommendations for the European Public Real Esta te Association regarding sustainability reporting (EPRA sBPR) and a set of own indicators (“Applicable Criteria”) as included in Chapter 10. Reporting according to recognised standards in the annual report. The Selected Information needs to be read and understood together with the Applicable Criteria. The Selected Information in scope of our engagement is identified with ✔ in Chapter 10. Reporting according to recognised standards of the Annual Report.
Based on our work as described in this report, nothing has come to our attention that causes us to believe that the Selected Information identified with ✔ in Chapter 10. Reporting according to recognised standards of the Annual Report of Warehouses De Pauw NV/SA, has not been prepared, in all material respects, in accordance with the Appliable Criteria
The board of directors of Warehouses De Pauw NV/SA is responsible for the preparation of Selected Information and the references made to it presented in the Annual Report as well as for the declaration that its reporting meets the requirements of Applicable Criteria.
The board of directors is also responsible for:
1 Selecting and establishing the Applicable Criteria.
1 Preparing, measuring, presenting and reporting the Selected Information in accordance with the Applicable Criteria.
1 Designing, implementing, and maintaining internal processes and controls over information relevant to the preparation of the Selected Information to ensure that they are free from material misstatement, including whether due to fraud or error.
1 Providing sufficient access and making available all necessary records, correspondence, information and explanations to allow the successful completion of the Services.
1 Confirming to us through written representations that you have provided us with all information relevant to our Services of which you are aware, and that the measurement or evaluation of the underlying subject matter against the Applicable Criteria, including that all relevant matters, are reflected in the Selected Information.
Our responsibility is to express a conclusion on the Selected Information based on our procedures. We conducted our engagement in accordance with International Standard on Assurance Engagements ISAE 3000 (Revised) Assurance Engagements Other than Audits or Reviews of Historical Financial Information, issued by the International Auditing and Assurance Standards Board (IAASB), in order to state whether anything had come to our attention that causes us to believe that the Selected Information have not been prepared, in all material respects, in accordance with the Applicable Criteria.
Applying these standards, our procedures are aimed at obtaining limited assurance on the fact that the Selected Information do not contain material misstatements. The procedures performed in a limited assurance engagement vary in nature and timing from, and are less in extent than for, a reasonable assurance engagement and consequently, the level of assurance obtained in a limited assurance engagement is substantially lower than the assurance that would have been obtained had a reasonable assurance engagement been performed.
Our work was performed on the data gathered and retained in the reporting scope by Warehouses De Pauw NV/SA as mentioned above. Our conclusion covers therefore only the Selected Information identified with in Chapter 10. Reporting according to recognised standards of the Annual Report and not all information included in the Annual Report. Specifically for the Waste KPI’s “Waste-Abs” and “Waste-LfL”, the limited assurance on the corporate offices only covers the Belgian office. The limited assurance on the Selected Information was only performed on the Selected Information covering the year ending 31 December 2022.
We are required to plan and perform our work to address the areas where we have identified that a material misstatement of the description of activities undertaken in respect of the Selected Information is likely to arise. The procedures we performed were based on our professional judgment. In carrying out our limited assurance engagement on the description of activities undertaken in respect of the Selected Information, we performed the following key procedures:
1 Obtaining an understanding of the Company’s business, including internal controls relevant to collection of the Selected Information. This included inquiry with Warehouses De Pauw NV/SA’s management responsible for operational performance in the areas responsible for the data underlying the Selected Information;
1 Considering the risk of material misstatement of the Selected Information;
1 Performing analytical procedures;
1 Recalculation of relevant formula’s used in manual calculations and assessment whether the data has been appropriately consolidated;
1 Assessing management’s assumptions and estimates;
1 examining, on a sample basis, internal and external supporting evidence and performing consistency checks on the consolidation of the Selected Information.
We apply International Standard on Quality Control 1 and, accordingly, maintain a comprehensive system of quality control including documented policies and procedures regarding compliance with ethical requirements, professional standards and applicable legal and regulatory requirements.
In conducting our engagement, we have complied with the independence and other ethical requirements of the Code of Ethics for Professional Accountants issued by the International Ethics Standards Board for Accountants (IESBA), which is founded on fundamental principles of integrity, objectivity, professional competence and due care, confidentiality and professional behaviour. This includes the verification that there are no conflicts of interest with this assurance engagement.
We obtained limited assurance over the preparation of the Selected Information in accordance with the Applicable Criteria. Inherent limitations exist in all assurance engagements.
Any internal control structure, no matter how effective, cannot eliminate the possibility that fraud, errors or irregularities may occur and remain undetected and because we use selective testing in our engagement, we cannot guarantee that errors or irregularities, if present, will be detected.
The self-defined Applicable Criteria, the nature of the Selected Information, and absence of consistent external standards allow for different, but acceptable, measurement methodologies to be adopted which may result in variances between entities. The adopted measurement methodologies may also impact comparability of the Selected Information reported by different organizations and from year to year within an organization as methodologies develop.
This report is made solely to the board of directors of Warehouses De Pauw NV/SA in accordance with ISAE 3000 (Revised) and our agreed terms of engagement. Our work has been undertaken so that we might state to the board of directors those matters we have agreed to state to them in this report and for no other purpose.
Without assuming or accepting any responsibility or liability in respect of this report to any party other than the Company and its board of directors, we acknowledge that the board of directors may choose to make this report publicly available for others wishing to have access to it, which does not and will not affect or extend for any purpose or on any basis our responsibilities. To the fullest extent permitted by law, we do not accept or assume responsibility to anyone other than Warehouses De Pauw NV/SA and its board of directors as a body, for our work, for this report, or for the conclusions we have formed.
Signed at Zaventem.
Deloitte Bedrijfsrevisoren / Réviseurs d’Entreprises BV/SRLRepresented by Rik
NeckebroeckThis relates to the realised and unrealised capital gains/losses with respect to the latest valuation by the property expert, taking into account the effective or deferred capital gains tax due, including WDP’s proportionate share in the portfolio of associated companies and joint ventures and excluding the minority interests.
This is the organic growth of the gross rental income year-on-year on the basis of an unchanged portfolio, excluding development projects, acquisitions and disposals during both periods of this comparison.
The operating margin, obtained by dividing the operating result (before the result on the portfolio) by the property result. Operating margin is a measure of profitability that can indicate how well the company is managing its operating property operations.
This refers to the weighted average yearly interest rate for the reporting period, taking into account the average outstanding debt and the hedging instruments during that same period.
This is the financial result according to IFRS exclusive of the change in fair value of financial assets and liabilities, and reflects the actual financial expenses of the company.
Percentage of fixed-rate and floating-rate debts hedged against interest rate fluctuations by means of derivatives. This economic parameter is not an obligatory parameter under the Belgian regulated real-estate investment companies Law (Wet betreffende de gereglementeerde vastgoedvennootschappen or 'GVV-Wet').
Statutory ratio calculated based on the GVV/SIR legislation by dividing the financial and other liabilities by the total assets. For the method used in the calculation of the gearing ratio, refer to the RD on Regulated real Estate Companies.
The loan-to-value is obtained from the IFRS statements by dividing the net financial liabilities by the sum of the fair value of the property portfolio, the fair value of the solar panels and financing to and holdings in associated companies and joint ventures.
The net debt / EBITDA (adjusted) is calculated starting from the proportional accounts (WDP's joint ventures are included for their proportionate share): in the denominator taking into account the trailing-twelve-months normalized EBITDA and adjusted to reflect the annualized impact of external growth; in the numerator taking into consideration the net financial indebtedness adjusted for the projects under development multiplied by the loan-to-value of the group (as these projects are not yet income contributing but already (partially) financed on the balance sheet). For associated companies only the dividends are taken into account.
1 For the calculation of this APM, it is assumed that the operating result (before the result on the portfolio) is a proxy for EBITDA. TTM stands for trailing 12 months and means that the calculation is based on financial figures for the past 12 months.
2 On a normalized basis and including the annualized impact of external growth in function of the realized disposals, acquisitions and projects.
Information included by way of reference Document1
Operating activities
Annual Report 2021
2. This is WDP (pp. 4-11)
3. Strategy and value creation (pp. 12-28)
4. Performance (pp. 29-60)
6. Financial results and property report – Property report – Review of the consolidated property portfolio (pp. 84-94)
Annual Report for 2020 2. This is WDP (pp. 5-14)
3. Strategy and value creation (pp. 16-21)
5. Transactions and realisations (pp. 40-60)
7. Financial results and property report – Property report – Review of the consolidated property portfolio (pp. 87-98)
Main markets
Annual Report 2021
2. This is WDP – Our profile (pp. 8)
6. Financial results and property report – Property report – Review of the consolidated property portfolio (pp. 84-94)
6. Financial results and property report – Property report – Review of the logistics property market (pp. 95-96)
10. Annual accounts – 2. Notes – V. Segment information – Operating result (pp. 215-217)
10. Annual accounts – 2. Notes - VI. Segmented information – Assets (pp. 218)
10. Annual accounts – 2. Notes - XII. Investment properties (pp. 223-227)
Annual Report for 2020
7. Financial results and property report – Property report – Review of the consolidated property portfolio (pp. 87-98)
7. Financial results and property report – Property report – Review of the logistics property market (pp. 99-100)
11. Financial statements – 2. Notes – V. Segment information – Operating result (pp. 209-211)
11. Financial statements – 2. Notes – VI. Segmented information – Assets (pp. 212)
11. Financial statements – 2. Notes – XII. Investment properties (pp. 216-220)
Investments
Annual Report 2021
Annual Report for 2020
Financial condition Annual Report 2021
4. Performance – Sustainable growth (pp. 40-45)
5. Transactions and realisations (pp. 40-60)
4. Performance – Sustainable growth (pp. 40-45)
6. Financial results and property report (pp. 66-101)
12. Appendices – External verification – Conclusions of the property experts (pp. 269)
9. Reporting according to recognised standards – EPRA key performance indicators (pp. 160-168)
10. Annual accounts (pp. 195-254)
12. Appendices – External verification – Statutory auditor’s report on the financial statements (pp. 270-274)
12. Appendices – Alternative Performance Measures (pp. 279-284)
Information included by way of reference Document1
Annual Report for 2020
5. Transactions and realisations (pp. 40-60)
7. Financial results and property report (pp. 68-105)
13. Annexes – External verification – Conclusions of the property experts (pp. 261)
10. Reporting according to recognised standards – EPRA key performance indicators (pp. 161-170)
11. Financial statements (pp. 190-247)
13. Annexes – External verification – Statutory auditor’s report on the financial statements (pp. 262-266)
13. Annexes – Alternative Performance Measures (pp. 271-276)
Historical financial information Annual Report 2021
10. Annual accounts – 1. Consolidated financial statements for the 2021 financial year – Profit and loss account (pp. 198-199)
10. Annual accounts – 1. Consolidated financial statements for the 2021 financial year – Balance sheet (pp. 201)
10. Annual accounts – 1. Consolidated financial statements for the 2021 financial year – Cash flow statement (pp. 202)
10. Annual accounts – 2. Notes (pp. 205-244)
Annual Report for 2020
11. Financial statements – 1. Consolidated financial statements for the 2020 financial year – Profit and loss account (pp. 192-193)
11. Financial statements – 1. Consolidated financial statements for the 2020 financial year – Balance sheet (pp. 195)
11. Financial statements – 1. Consolidated financial statements for the 2020 financial year – Cash flow statement (pp. 196)
11. Financial statements – 2. Notes (pp. 199-237) Statement
Annual Report for 2020
Transactions with affiliated parties Annual Report 2021
Annual Report for 2020
Information on the workforce Annual Report 2021
Annual Report for 2020
7. Financial results and property report – Outlook – Growth Plan 2022-25 (pp. 100-101)
5. Shares and bonds – The share (pp. 62-63)
7. Financial results and property report – Outlook – Projected consolidated results (pp. 102-103)
7. Financial results and property report – Outlook – Growth Plan 2019-23 (pp. 104)
6. Shares and bonds – The share (pp. 63)
10. Annual accounts – 2. Notes – XXIV. Transactions between parties (pp. 242)
11. Financial statements – 2. Notes – XXV. Transactions between affiliates (pp. 235-236)
10. Annual accounts – 2. Notes – XXIII. Average workforce and breakdown of staff costs (pp. 242)
11. Financial statements – 2. Notes – XXIV. Average workforce and breakdown of employee costs (pp. 235)
The annual report is available at the Company’s registered office and can be consulted on the website www.wdp.eu in three language versions (Dutch, French and English).
The Dutch-language version of the annual report was drawn up in accordance with the ESEF (European Single Electronic Format) reporting requirements and therefore is the official version of the annual report. This version in ESEF in het Nederlands can also be found at the website www.wdp.eu. The electronic versions of the annual reports may not be copied or made available anywhere. It is also prohibited to print the text for further distribution.
Contact persons and additional information:
Joost Uwents, CEO joost.uwents@wdp.eu
Mickaël Van den Hauwe, CFO mickael.vandenhauwe@wdp.eu
Joke Cordeels, Investor relations investorrelations@wdp.eu
WDP declares that:
1 the 2022 Annual Report was filed with the FSMA as a Universal Registration Document on the date 27 March 2023, as the competent authority under Regulation (EU) 2017/1129 without prior approval under Article 9 of Regulation (EU) 2017/1129;
1 the Universal Registration Document may be used with a view to offering securities to the public or the admission of securities to trading on a regulated market, provided that it is approved by the FSMA, where applicable, along with any amendments and a securities note and summary approved in accordance with Regulation (EU) 2017/1129.
The information made available via the website does not form part of this Universal Registration Document unless such information is included as a reference.
The members of the Board of Directors of WDP NV/SA, the composition of which is described in Chapter 8. Corporate Governance Statement, are responsible for the information provided in this annual report.
Tony De Pauw and Joost Uwents, both managing directors and co-CEOs, hereby declare, on behalf of the Board of Directors, the composition of which is described in Chapter 8. Corporate Governance Statement, after taking all measures to guarantee the same, that to their knowledge, the data in this annual report are a fair presentation of reality, and that no information has been omitted which would, if reported, alter the effect of this annual report, and that as far as they are aware:
1 the financial statements, which have been drawn up in accordance with the applicable standards for financial statements, give a true and fair view of the group’s equity, financial position and of the results of the issuer and of the companies included in the consolidation;
1 the annual report gives a true overview of the development and the results of the company and of the position of the issuer and the companies included in the consolidation, as well as a description of the main risks and uncertainties they are faced with;
1 no significant changes have occurred in the financial position or financial performance of the Group since 31 December 2022; and
1 subject to what has been publicised with regard to the Dutch REIT status (pp. 77 and 227) and the abolition of the green energy certificates linked to the production of the PV installations in Flanders (pp. 236), no government interventions, lawsuits or cases of arbitration exist – or have recently occurred – that could influence WDP’s financial position or profitability. They also declare that, to their knowledge, no circumstances or facts exist that could lead to such government interventions, lawsuits or cases of arbitration.
WDP hereby declares that, at least during the period of validity of the Universal Registration Document, the following documents are available for viewing on its website at www.wdp.eu:
1 the latest deed of incorporation and Articles of Association of WDP;
1 the annual reports;
1 the reports, and respectively, the conclusions of the statutory auditor and the property experts;
1 press releases and mandatory financial information.The company’s financial reporting is published in the financial press where required by law;
1 the Corporate Governance Charter;
1 the obligations of the Company and the rights of the shareholders with regard to the General Meeting are published on the Investors section of WDP’s website from the meeting notice until participation and voting in full. This information remains available on the Company website for a period of at least five years starting from the date of the General Meeting to which it pertains.
In accordance with the relevant provisions of the law, the separate and consolidated financial statements of the Company are deposited with the National Bank of Belgium.
Decisions related to the appointment and dismissal of members of the Board of Directors are published in the Annexes to the Belgian Official Journal.
WDP declares that the information provided by the property experts and the statutory auditor has been faithfully reproduced. To WDP’s knowledge, and based on what it has been able to deduce from the information published by the property experts and the statutory auditor, no facts were omitted that would render the information provided by the property experts or the statutory auditor incorrect or misleading. WDP also confirms that the statutory auditor and property experts have given their approval for the content of their report and conclusions respectively to be included in the annual report.
For confidentiality reasons, the full report of the property experts has not been included and cannot be consulted.
In accordance with Articles 3:6 and 3:32 of the Belgian Code of companies and associations, the required components of the WDP annual report appear in the following chapters:
1 7. Financial results and property report;
1 8. Corporate Governance Statement;
1 9. Risk factors; and
1 11. Annual accounts.
This annual report provides an overview of the activities and financial statements for the financial year ending on 31 December 2022.
Company name (Article 1 of the coordinated Articles of Association)
Warehouses De Pauw, or WDP for short.
The Company is registered in the Crossroads Bank for Enterprises, in the district of Brussels, Dutch language division, under the legal entity registration number 0417.199.869. Its identification code for legal entities (LEI – legal entity identifier) is 549300HWDYC5JXC85138.
The Company was founded as a public limited company (‘NV’/'SA') under the name Rederij De Pauw by a deed executed before civil-law notary Paul De Ruyver in Liedekerke on 27 May 1977, published in the Annexes to the Belgian Official Journal on 21 June 1977 under number 2249-1. By means of a general merger and demerger operation, this NV became the holding company bringing together the property portfolios of nine companies. At the same time, the name of the Company was changed to Warehousing & Distribution De Pauw and was converted into a partnership limited by shares under Belgian law (Comm. VA). The associated amendments to the Articles of Association were provisionally enacted by a deed executed by civil-law-notary Siegfried Defrancq in AsseZellik, acting as substitute for civil-law-notary Jean-Jacques Boel in Asse due to his statutory incapacity, on 20 May 1999, subsequently published in the annexes to the Belgian Official Journal on 16 June under number 990616-21, and endorsed in two deeds dated 28 June 1999 by the same civil-law notary, subsequently published in the annexes to the Belgian Official Journal on 20 July under numbers 990720-757 and 758.
The company name was changed during the Extraordinary General Meeting of 25 April 2001 into Warehouses De Pauw, as set out in the deed executed by the
aforementioned notary Siegfried Defrancq, replacing the aforementioned notary Jean-Jacques Boel, due to his statutory incapacity, published in the annexes to the Belgian Official Journal on 18 May 2001 under number 20010518-652.
At the Extraordinary General Meeting of 11 September 2019, the legal form of WDP was changed to a public limited company ('naamloze vennootschap') effective as of 1 October 2019, as established in the deed executed before civil-law-notary Tim Carnewal, published in the annexes to the Belgian Official Journal of the following 25 September 2019, under number 19127672.
At the Extraordinary General Meeting on 11 September 2019, it was decided to split the share by a factor of 7. This declaration deed was executed before Civil-Law Notary Eric Spruyt in Brussels and was published in the Annexes to the Belgian Official Journal on 5 February 2020 under number 20020249.
The Articles of Association of WDP were amended one last time on 2 February 2023 by deed before notary Alexis Lemmerling in Brussels, following the decision to amend the articles of association. This deed was published in the Annexes to the Belgian Official Journal of 16 February 2023 under number 23314652.
BELGIUM: Regulated Real Estate Company (GVV/SIR) status (Article 1 of the coordinated Articles of Association)
Since 28 June 1999, WDP has been registered with the Belgian Financial Services and Markets Authority, the FSMA), as a fixed-capital Belgian REIT (a Vastgoedbevak/SICAF).
On 16 October 2014 in order to better meet the economic realities, and due to the changes in the legal framework related to our capacity as an operational and commercial real estate company, WDP changed its status to that of a public regulated real estate company under Belgian law (public 'GVV/SIR'). The relevant amendments to the Articles of Association were enacted in a deed executed by the civil-law notary Yves De Ruyver replacing the aforementioned civil-law notary Jean-Jacques Boel, due to his statutory incapacity, as published in the annexes to the Belgian Official Journal on 31 October 2014 under number 14199666. Therefore, WDP is subject to the legal system as determined in the GVV/SIR legislation.
Generally speaking, a public regulated real estate company under Belgian law, and therefore also WDP since 16 October 2014, must satisfy a number of crucial conditions in order to be able to make use of the favourable regime while guaranteeing greater transparency and a limitation of risk for the investor.
A public regulated real estate company under Belgian law:
1 is a real estate company that (i) mainly makes immovable goods available to users, (ii) may possess other types of property within the statutory limits (holding rights in fixed capital Belgian REITs (a ‘Vastgoedbevak/SICAF’), holding rights in certain foreign ICBs, shares issued by other REITs, property certificates and holding rights in a FIIS/GVBF), and (iii) within the framework of making immovable goods available, may perform any and all activities associated with the construction, conversion, renovation, development (for the company’s own portfolio), acquisition, disposal, management and operation of immovable goods and (iv) within the legal limits, may also invest in the infrastructure sector (including through PPPs) and the energy sector (including renewable energy);
1 has a statutory maximum gearing ratio of 65% of its assets;
1 must distribute at least 80% of its profits to its shareholders;
1 has the obligation of periodic and occasional valuation of the fair value of the property by an independent property expert;
1 diversifies its properties in such a way as to spread the risks appropriately, by type of property, geographic area and category of user or tenant, and no single transaction shall result in more than 20% of its consolidated assets constituting a single property;
1 is subject to corporation tax at the standard rate, although only on a limited taxable base (i.e. non-deductible professional expenses, abnormal or gratuitous benefits and special assessment of secret commissions). When a GVV/SIR participates in a merger, a demerger or a similar transaction, this transaction shall not benefit from the tax neutrality regime but will give rise to the application of the exit tax at the rate of 15% as of 1 January 2020. As a rule, the dividends paid by a GVV/SIR to a shareholder give rise to the collection of an immovable property tax at the rate of 30%;
1 follows a strategy intended to retain possession of its properties over the long term;
1 prioritises active management in the performance of its activities, which specifically entails that the company itself is responsible for the development and day-to-day management of the immovable goods, and that all other activities that it performs provide added value for these same immovable goods or their users, such as offering services that supplement provision of the immovable goods;
1 for performance of the aforementioned activities, has its own management structure, administrative, accounting, financial and technical organisation and suitable internal control;
1 is subject to the provisions of the GVV/SIR Act and of the Royal Decree on GVVs/ SIRs;
1 must be incorporated in the form of a public limited company ('NV/SA');
1 is listed, and at least 30% of the shares must be distributed in the market;
1 cannot act (directly or indirectly) as a property developer (other than occasionally);
1 may possess companies in which it owns, directly or indirectly, over 25% of the shares (“perimeter” companies), which may or may not take the status of an institutional GVV/SIR;
1 must adhere to strict rules regarding conflicts of interest and internal auditing structures.
Public or institutional GVV/SIRs fall under the supervision of the FSMA. For more information on the GVV/SIR status, please refer to our website
Aside from Articles 7:96 (conflicts of interest of directors) and 7:97 (conflicts of interest of affiliated companies) of the Belgian Code of companies and associations, which apply to all listed companies, special rules apply to GVVs/SIRs regarding functional conflicts of interest (by virtue of Article 37 of the GVV/SIR Act).
For further information on each of these procedures, please refer to Chapter 8. Corporate Governance Statement pp. 134.
As of 1 November 2010, the FBI (Fiscal Investment Institution) regime applies to WDP Nederland S.A., as a result of which the corporation tax rate of 0% applies. The company must satisfy the following conditions in order to benefit from this regime:
1 WDP Nederland must be a B.V., N.V. or a mutual fund.
1 The statutory objective as per the Articles of Association and the actual activities of WDP Nederland S.A. are limited to the investment of capital.
1 Only 60% of the financing of the funds for investment (fiscal book value) can be loan capital, in the case immovable goods. For other investments (not related to immovable goods), only 20% of the fiscal book value of financing can be loan capital.
1 The operating profits of WDP Nederland S.A. must be provided to the shareholder of WDP Nederland S.A. starting from application of the FBI regime within eight months after the end of the financial year.
1 The profits distribution must be distributed evenly across all shares.
1 75% or more of the shares in WDP Nederland S.A. must be held by a body that is not subject to a tax based on profit.
1 5% or more of the shares cannot be held directly or indirectly by natural persons.
1 25% or more of the shares cannot be held by funds based abroad for persons residing or legal entities domiciled in the Netherlands.
For more information on the evolution of the FBI status, we refer to Chapter 7. Financial results and property report pp. 77 and 227.
Since 2005, WDP has been under the SIIC regime (Société d’Investissement Immobilier Cotée) via its permanent establishment in France and its subsidiary WDP France SARL, which means that a corporation tax rate of 0% applies. The company must satisfy the following conditions in order to benefit from this regime:
1 The parent company must have the structure of an NV/SA or any other form of company limited by shares that can be admitted for listing on the stock market. This parent company must be listed on a stock market under EU law.
1 The main activity of the SIIC must be limited to leasing immovable goods. Property developments are not permitted to exceed the limit of 20% of the gross book value of the portfolio.
1 No more than 60% of the shares in WDP can be held by a single investor or a group of investors acting in mutual consultation.
1 The profit originating from the letting of buildings, the capital gains realised on the sale of buildings, the capital gains realised on the sale of securities in the partnerships or subsidiaries that are liable for corporation tax and that have opted for SIIC status, contributions disbursed through their subsidiaries that have opted for SIIC status and shares in the profit in partnerships are exempt from corporation tax.
1 A distribution obligation applies to the results for 95% of the exempt profit originating from rental income, 60% of exempt profit originating from the sale of buildings and securities of partnerships and subsidiaries that are subject to SIIC status and 100% of the dividends that are paid to them by their subsidiaries that are liable for corporation tax and that have opted for SIIC status.
1 Payment of an exit tax at a rate of 19% on the unrealised gains on buildings that are the property of the SIIC or its subsidiaries that are liable for corporation tax and have opted for SIIC status, and on the securities of partnerships that are not subject to corporation tax.
The website of the Company is www.wdp.eu and the Company can be contacted at the following email address: shareholdersmeetings@wdp.eu
The Company is based in the Flemish Region. The registered offices can be relocated in Belgium by a decision of the Board of Directors, provided the relocation does not require a change in the language of the Articles of Association to comply with applicable language legislation.
Duration (Article 2 of the coordinated Articles of Association)
The duration of the Company is unlimited.
Company objective (Article 5 of the coordinated Articles of Association)
Article 5 of the Articles of Association states that the sole objective of the Company is to:
a) make real estate available to users, directly or through a company in which it holds an interest in accordance with the provisions of the GVV/SIR legislation and its implementing decrees and regulations; and
b) possess real estate as referred to in Article 2(5°)(i to xi) of the GVV/SIR Act, within the limits of the GVV/SIR legislation.
Real estate shall be understood to mean:
i) real estate as defined in articles 517 and thereafter of the Civil Code and rights in rem to the said real estate, excluding the real estate of a forestry, agricultural or mining nature;
ii) shares with voting rights issued by real estate companies, of which the company directly or indirectly retains more than 25% of the capital;
iii) option rights on real estate;
iv) shares in public or institutional GVV/SIRs, provided in the latter case that the company holds over 25% of the share capital, directly or indirectly;
v) rights arising from contracts giving the company leasehold of one or more assets, or other analogous rights of use;
vi) holding rights in public and institutional real estate investment funds;
vii) holding rights in foreign institutions for collective investment in real estate registered in the list referred to in Article 260 of the Act of 19 April 2014
viii) holding rights in institutions for collective investment in real estate based in a different Member State of the European Economic Area and not included in the list referred to in Article 260 of the Act of 19 April 2014, insofar as they are subject to equivalent supervision as public real estate investment trusts;
ix) shares or holding rights issued by companies (i) with a legal personality; (ii) governed by the law of another Member State of the European Economic Area;
(iii) whose shares may or may not be admitted to trading on a regulated market and which may or may not be subject to a regime of prudential supervision;
(iv) the principal activity of which consists of the acquisition or construction of immovable property with a view to placing it at the disposal of users, or the direct or indirect holding of shares in the capital of companies with a similar activity; and (v) which are exempt from tax on income from profits resulting from the activity referred to under (iv) above, subject to compliance with certain legal obligations, and which are obliged to distribute at least part of their income to their shareholders (“Real Estate Investment Trusts” (or “REITs” for short);
x) mortgage debentures as referred to in Article 5(§ 4) of the Act of 16 June 2006;
xi) holding rights in a FIIS/GVBF;
xii) as well as any other goods, shares or rights defined as real estate by the GVV/ SIR legislation.
Real estate as referred to in (vi), (vii), (viii), (ix) and (xi) that constitute holding rights in alternative investment funds within the meaning of Directive 2011/61/EU of the European Parliament and of the Council of 8 June 2011 on managers of alternative investment funds and amending Directives 2003/41/EC and 2009/65/EC and of the Regulations (EC) no. 1060/2009 of the European Parliament and the Council of 16 September 2009 on credit rating agencies and (EU) no. 1095/2010 of the European Parliament and of the Council of 24 November 2010 establishing a European supervisory authority (European Securities and Markets Authority) amending Decision no. 716/2009/EC and repealing Commission Decision 2009/77/EC cannot be qualified as voting shares issued by real estate companies, regardless of the amount of the shareholding held directly or indirectly by the company.
c) the long-term conclusion of or accession to one or more of the following, with a public contractor and either directly or by means of a company in which it holds a stake in accordance with the provisions of the GVV/SIR legislation, where applicable in collaboration with third parties:
i) DBF agreements, so-called “Design, Build, Finance” agreements;
ii) DB(F)M agreements, so-called “Design, Build, (Finance) and Maintain” agreements;
iii) DBF(M)O agreements, known as “Design, Build, Finance, (Maintain) and Operate” agreements; and/or
iv) contracts for public works concessions relating to buildings and/or other real estate infrastructure and associates services, and on the basis of which:
i) the company is responsible for the provision, maintenance and/or operation for a public entity and/or citizens as end users, in order to satisfy a social need and/or to allow the provision of a public service; and
ii) the company, without necessarily having rights in rem, can assume, in whole or in part, the associated financing risks, availability risks, demand risks and/ or operating risks, in addition to any construction risk.
d) the long-term development, incorporation, management and operation, possibly by means of third parties, and provision of the following, either directly or by means of a company in which it holds a stake in accordance with the provisions of the GVV/SIR legislation, where applicable in collaboration with third parties:
i) utilities and storage facilities for the transport, distribution or storage of electricity, gas, fossil or non-fossil fuels and energy in general and associated assets;
ii) utilities for transport, distribution, storage or purification of water and associated assets;
iii) installations for the generation, storage and transport of renewable or nonrenewable energy and associated assets; or
iv) waste and incineration plants and associated assets.
In the context of the provision of real estate, the Company may exercise all activities related to the incorporation, construction (without infringing the prohibition on acting as a property developer, except for occasional transactions), alteration, fitting out, renovation, development, acquisition, sale, letting, subletting, exchange, inclusion, transfer, subdivision, bringing real estate assets into a system of co-ownership or joint ownership, as described above, the granting or receipt of the right of superficies, the right to the usufruct, long-term lease or other real or personal rights, management and running of properties.
In accordance with the GVV/SIR legislation, the Company may also:
1 rent immovable goods with or without a purchase option;
1 let immovable goods, with or without a purchase option, with the understanding that it is only permitted to let immovable goods with a purchase option as a secondary activity;
1 invest in securities other than properties within the meaning of the GVV/SIR legislation, on an occasional or temporary basis. These investments are made in accordance with the risk management policy adopted by the Company and shall be diversified to ensure suitable risk diversification. The Company may also possess unallocated liquid assets. The liquid assets may be held in any currency in the form of demand or term deposits or by any money market instrument susceptible to rapid mobilisation;
1 offer mortgages or any other securities or guarantees for the financing of the real estate activities of the Company or its Group;
1 grant loans;
1 perform transactions on permitted hedging instruments (as defined in the GVV/SIR legislation) to the extent that these transactions are part of a policy defined by the Company to hedge financial risks, with the exception of speculative transactions.
The Company may acquire, lease or rent, transfer or exchange any and all movable or immovable goods, materials and necessities, and in general perform all commercial or financial operations directly or indirectly related to its objective and the exploitation of all intellectual rights and commercial properties pertaining to these.
Taking GVV/SIR legislation into account, the Company may obtain a share by contribution in cash or in kind, merger, demerger or other restructuring under company law, subscription, shareholding, financial intervention or by any other means, in all existing companies and enterprises, or those yet to be formed, in Belgium or abroad, whose company objective is similar to its own or which, by its nature, seeks to accomplish or facilitate the accomplishment of its own objective. Any amendments to the Company’s Articles of Association shall require the prior approval of the FSMA.
The capital of WDP NV/SA amounts to 233,702,382 euros and is represented by 203,980,363 ordinary shares, each of which represents 1/203.980.363 part of the capital. None of these shares provides special voting or other rights.
The Board of Directors is authorised, within the constraints of the mandatory provisions contained in the applicable company law, to increase the capital on the dates and subject to the conditions that it specifies, on one or more occasions, up to a maximum amount of:
i) 116,851,191.00 euros, if the capital increase to be realised is a capital increase by cash with the possibility for the shareholders of the Company to exercise their preferential right or the irreducible allocation right (as referred to in the GVV/SIR legislation); and
ii) 116,851,191.00 euros, if the capital increase to be realised involves a capital increase in the context of paying an optional dividend; and
iii) 23,370,238.20 euros if the capital increase is achieved (a) through a contribution in kind, (b) a contribution in cash without the option for company shareholders to exercise their statutory preferential rights or irreducible allocation rights (as referred to in the GVV/SIR legislation) or (c) any other form of capital increase; with the understanding that the capital will not be allowed to increase within the context of this mandate by an amount that exceeds the amount of the capital on the date of the extraordinary general meeting that approves the mandate, being 2 February 2023.
This authorisation is valid for a period of five years commencing as of 16 February 2023 (being the date of publication in the Annexes to the Belgian Official Journal of the decision on the approval of the authorised capital). This authorisation is renewable.
As of the date of this Annual Report, the Board of Directors not yet made use of the authorisation granted to it to increase the capital, and thus the available balance of the authorised capital as at the date of this Annual Report:
i) 116,851,191.00 euros, if the capital increase to be realised is a capital increase by cash with the possibility for the shareholders of the Company to exercise their preferential right or the irreducible allocation right (as referred to in the GVV/SIR legislation); and
ii) 116,851,191.00 euros, if the capital increase to be realised involves a capital increase in the context of paying an optional dividend; and
iii) 23,370,238.20 euros if the capital increase is achieved (a) through a contribution in kind, (b) a contribution in cash without the option for company shareholders to exercise their statutory preferential rights or irreducible allocation rights (as referred to in the GVV/SIR legislation) or (c) any other form of capital increase;
with the understanding that in the context of the authorised capital, for the fiveyear authorisation period, the capital can never be increased beyond an amount of 233,702,382.00 euros.
Capital increase(s) may be performed by contributions in cash or in kind or the conversion of reserves, including profits carried forward and issue premiums as well as all the equity components in the Company’s individual IFRS annual financial statements (compiled on the basis of the GVV/SIR legislation) which can be converted into capital, with or without issuing or creating shares or other securities (of any existing kind), in accordance with the mandatory provisions set out in the applicable company law and the GVV/SIR legislation.
Eventual issue premiums will be shown in one or more separate accounts under shareholders’ equity in the liabilities on the balance sheet. The Board of Directors shall be free to decide to place any issue premiums – possibly after deduction of an amount not exceeding the cost of the capital increase in the meaning of the applicable IFRS rules – to an unavailable account, which shall constitute the third-party guarantee on the same basis as the capital and cannot under any circumstances be reduced or eliminated except by a resolution of the General Meeting voting as for an amendment to the Articles of Association, except in cases of conversion into capital.
The Company may acquire, accept in pledge and sell its own shares and associated depository receipts in accordance with the applicable company law.
In addition, the Board of Directors is authorised to perform the following actions for five years starting on 16 February 2023:
1 acquire shares in the Company and associated depository receipts and accept these in pledge, at a minimum price or countervalue equal to 0.01 euros and at a maximum price or counter value equal to 125% of the closing price on the trading day before the date of the transaction, without the Company being allowed to own shares of the Company or depositary receipts relating thereto representing more than 10% of the total number of shares;
1 transfer shares in the Company and associated depository receipts, such as to one or more specific persons who are not employees, at a minimum price or countervalue equal to 75% of the closing price of the trading day before the date of the transaction.
Under the conditions and within the limits set out in paragraphs one to five inclusive of this article, the Board of Directors can create or issue not only shares, but also subscription rights (whether or not attached to another security), convertible bonds, bonds repayable in shares, or other securities (of any existing kind), complying at all times with the mandatory provisions set out in the applicable company law and the GVV/SIR legislation.
Without prejudice to application of the mandatory provisions of the applicable company law and the GVV/SIR legislation, the Board of Directors may limit or cancel preferential rights in this case, even if it benefits one or more persons, other than employees of the company.
The Board of Directors has the power to amend the Company’s Articles of Association in accordance with capital increase(s) performed in the context of the authorised capital.
On 31 December 2022 at the date of the annual report, WDP NV/SA did not possess any of its own shares.
Except for the option to use authorised capital by a decision of the Board of Directors, and taking into account the mandatory provisions in the applicable company law and the GVV/SIR legislation, only an Extraordinary General Meeting can decide to increase or decrease the capital, in the presence of a civil-law notary.
Where the capital is increased by a cash contribution and without prejudice to the application of the mandatory provisions of the applicable company law, the preferential right can be restricted or cancelled.
In such cases, if the mandatory provisions of GVV/SIR legislation require the granting of an irreducible allocation right to existing shareholders when new securities are allocated, this irreducible allocation right must at least satisfy the following conditions:
1° it applies to all new securities issued;
2° it is granted to the shareholders in proportion to the share of capital that their shares represent at the time of the transaction;
3° a maximum share price shall be announced by no later than the evening prior to the opening of the public subscription period; and
4° in such cases, the public subscription period must be at least three trading days.
However, a capital increase in cash can also take place with the waiving of the statutory preferential right and without the allocation of an irreducible allocation right, provided that the following conditions are satisfied:
1° the capital increase takes place using the authorised capital;
2° the cumulative amount of capital increases carried out in accordance herewith over a period of twelve months shall not exceed 10% of the amount of the capital at the time of the decision to increase the capital.
This allows a GVV/SIR, among other things, to realise an exempted private offering of new shares by means of an accelerated private placement with an order book (so-called accelerated bookbuilding or ABB).
When issuing securities against contributions in kind, the following conditions must be met without prejudice to the mandatory provisions contained in the applicable company law:
1) the identity of the contributor must be disclosed in the special report of the Board of Directors on the capital increase by contribution in kind, and also, where applicable, in the invitations to the general meeting that will decide on the contribution in kind;
2) the issue prices shall be no less than the lower value of (a) a net value per share dated no more than four months prior to the date of the contribution agreement or, at the discretion of the company, before the date of the capital increase deed, and (b) the average closing price of the thirty calendar days before this date;
3) unless the issue price as well as the method used are determined by the working day after conclusion of the contribution agreement and are announced to the public with indication of the timeframe within which the capital increase will actually be complete, the capital increase deed shall be executed within no more than four months; and
4) the report provided for under point 1 above must also explain the impact of the proposed contribution on the position of the earlier shareholders and more particularly on their share in the profits, in the net value per share and in the capital as well as the impact on voting rights.
For the application of point 2 above, an amount may be deducted from the sum specified in clause 2(b) above, that is equal to the part of the undistributed gross dividend to which the new shares may not grant a right. Where applicable, the Board of Directors shall specifically justify the dividend amount deducted, as described above, in its special report, and explain the financial conditions of the transaction in its annual financial report.
The special rules for capital increases in kind, explained above, do not apply to the contribution of a right to a dividend in the context of payment of an optional dividend, insofar as this is effectively open for payment to all shareholders.
The special rules for capital increases in kind, explained above, apply mutatis mutandis to mergers, demergers and similar operations to which the GVV/SIR legislation refers in this specific context. In this case, the “date of the contribution agreement” refers to the date on which the merger or demerger proposal was deposited.
Special rights of control are not granted to any categories of shareholders. WDP currently has only one reference shareholder, who has one representative on the Board of Directors by virtue of the binding right of appointment as set out in Article 15 of the coordinated Articles of Association, an excerpt of which is provided below:
“Notwithstanding the mandatory provisions in the applicable company law and notwithstanding the GVV/SIR legislation, and subject to the conditions and terms of this article, every natural person, legal entity or company (with or without legal personality) that individually and directly holds at least 10% of the shares in the Company (a “Reference Shareholder”), shall have a binding right to appoint one director at the annual meeting. A Reference Shareholder shall have a binding right, subject to the terms and conditions contained in this article, to appoint one additional director for each block of 10% of the shares that the Reference Shareholder owns individually and directly in the company…”
On 25 April 2007, Deloitte Bedrijfsrevisoren, a member of the Belgian Institute of Registered Auditors with offices at Gateway building Luchthaven Brussel Nationaal 1 J, 1930 Zaventem, was appointed as the statutory auditor for WDP.
On 27 April 2016 the statutory auditor, represented by its permanent representative, Kathleen De Brabander, was reappointed until the annual meeting of 2019.
On 6 December 2016, WDP launched an open call for tenders for this term of appointment as statutory auditor in accordance with the European Audit Directive 537/2014/EU. Due to this legislation, the term of Deloitte Bedrijfsrevisoren already ended at the Annual General Meeting of 26 April 2017. This meeting concerned the reappointment of Deloitte Bedrijfsrevisoren, represented by its permanent representative, Kathleen De Brabander, until the annual meeting of 2020.
The Annual General Meeting of 24 April 2019 conducted an internal rotation of the permanent representatives of the statutory auditor in the context of Article 22(§ 3) of the Act of 7 December 2016 organising the profession and public supervision of statutory auditors. Kathleen De Brabander was succeeded by Rik Neckebroeck for the remainder of the term, i.e. until the annual meeting of 2020.
At the Annual General Meeting of 29 April 2020, it was decided to reappoint Deloitte Bedrijfsrevisoren, with Rik Neckebroeck as permanent representative, for a period of three years, i.e. until the Annual General Meeting of 2023.
At its Annual General Meeting of 26 April 2023 the Board of Directors will propose the reappointment of Deloitte Bedrijfsrevisoren, with permanent representative Mrs Kathleen de Brabander, for a period of two years, namely, until the annual meeting of 2025.
The duties of the statutory auditor consist of the auditing the consolidated and separate financial statements of WDP NV/SA and the other Belgian subsidiaries.
In France, Deloitte & Associés, represented by Pierre-Marie Martin, with offices at 6, Place de la Pyramide, 92908 Paris La Défense Cedex, was appointed as statutory auditor for the subsidiary WDP France SARL.
In the Netherlands, Deloitte Accountants BV, represented by Martijn Heerschop, with offices at Gustav Mahlerplein 2970, 1081 LA Amsterdam, the Netherlands, was appointed as the statutory auditor for the WDP Nederland S.A. and WDP Development NL S.A. subsidiaries.
In Luxembourg, Deloitte Audit SARL, represented by Adil Sebbar, with offices at Boulevard de Kockelscheuer 20, 1821 Luxembourg, was appointed as statutory auditor of the WDP Luxembourg S.A. subsidiary.
In Romania, Deloitte Audit SRL, represented by Claudiu Ghiurluc, with offices at Building
The Mark, Calea Griviței no. 84-98 și 100-102, etajul 8 și etajul 9, Sector 1, Bucharest, was appointed as the statutory auditor of the Warehouses De Pauw Romania SRL subsidiary.
The fees of the statutory auditor are determined on the basis of prices in line with market conditions and independently of WDP as per the code of conduct and the standards of the Belgian Institute of Registered Auditors and in accordance with the applicable provisions with regard to the independence of statutory auditors set out in the Belgian Code of Companies and Associations.
For further information on statutory auditor fees, please see Chapter 11. Annual Accounts pp. 251
Financial service (paying agent)
ING België NV/SA
Marc Sanders
Sint-Michielswarande 60, 1040 Brussels
+ 32 2 547 31 40
marc.sanders@ing.com
The fees for financial services are determined on the basis of market conditions as a percentage of the volume of the transactions concerned (such as dividend payments, optional dividends, etc.) and are independent of the Company.
For further information on financial service fees, please see Chapter 11. Annual Accounts pp. 251.
In accordance with the GVV/SIR legislation, the expert values all buildings of the GVV/ SIR and its subsidiaries at the end of each financial year. The book value of the buildings appearing on the balance sheet is adjusted to these values.
In addition, at the end of each of the first three quarters of the financial year, the independent property expert updates the overall valuation prepared at the end of the previous year based on the development of the market and the individual characteristics of the properties in question. The expert also values the properties of the GVV/SIR and its subsidiaries if the GVV/SIR wishes to perform transactions such as share issues or mergers.
All immovable goods that the GVV/SIR or its subsidiaries want to acquire or transfer are valued by the independent property expert prior to the transaction. The valuation of the expert shall apply as a minimum price (in cases of disposal), or maximum price (in cases of acquisitions) for the GVV/SIR when the counterparty is a person that is closely involved with the GVV/SIR (as determined in the applicable regulations for GVVs/SIRs) or if such persons receive any benefits from the transaction in question.
The GVV/SIR legislation formulates statutory obligations on procedures followed by property experts to ensure the necessary degree of independence of property appraisers in the valuation of the property. It is stipulated that the remuneration cannot be related to the value of the property that forms the subject matter of the expert’s report.
An obligation is also imposed on the GVV/SIR to ensure replacement of the expert(s) that it appoints under a double rotation requirement. Thus, the GVV/SIR may only appoint the expert for a renewable term of three years. Moreover, an expert may only be entrusted with the valuation of a particular property for a maximum period of three years, after which a cooling-off period of three years must be observed. Therefore, an expert who has already served a three-year term may only be appointed for a new three-year term if, for this period, the expert is responsible for valuing a different part of the assets of the public GVV/SIR or its subsidiaries. Special rules apply if the expert is a legal entity.
On 31 December 2022, the property experts appointed by WDP NV/SA are:
1 Stadim BV, Mechelsesteenweg 180, 2018 Antwerp - Belgium, represented (within the meaning of Article 24 of the GVV/SIR Act) by Elke De Wael, Leander Asnong and Nicolas Janssens;
1 Jones Lang LaSalle BV, Marnixlaan 23, 1000 Brussels – Belgium, represented (within the meaning of Article 24 of the GVV/SIR Act) by Greet Hex;
1 Cushman & Wakefield VOF, Gustav Mahlerlaan 362-364, 1082 ME Amsterdam the Netherlands, represented (within the meaning of Article 24 of the GVV/SIR Act) by Kristiaan Engelman;
1 CBRE Valuation & Advisory Services B.V., Anthony Fokkerweg 15, 1059 CM Amsterdam, the Netherlands, represented (within the meaning of Article 24 of the GVV/SIR Act) by W.F.A. Rodermond and J.B.H. Baars;
1 BNP Paribas Real Estate, 50 cours de l’Ile Seguin, te 921009 Boulogne Billancourt, France, represented (within the meaning of Article 24 of the GVV/SIR Act) by Laure Gougeon;
1 CBRE Romania | Valuation Department, One Tower, 165 Calea Floreasca, 14th Floor, Bucharest, Romania, represented (within the meaning of Article 24 of the GVV/SIR Act) by Florin Ianculescu-Popa;
1 Jones Lang laSalle Luxembourg SECS, rue du Puits Romain 37, L-8070 Bertrange, Luxembourg, represented (within the meaning of Article 24 of the GVV/SIR Act) by Roderick Scrivener;
1 CBRE GmbH, Hausvogteiplatz 10, 10117 Berlin – Germany, represented (within the meaning of Article 24 of the GVV/SIR Act) by Kristine Kühn.
Remuneration for property experts is not connected to the value of the property and is based on a fixed fee per property valued and/or a variable fee according to the surface area valued. The agreements with the property experts satisfy the relevant regulations.
For further information on the division of the property portfolio or property expert fees, see Chapter 11. Annual Accounts on pp. 233 and pp. 251.
WDP and its subsidiaries must take out adequate insurance cover for all of their immovable goods. The insurance cover must be in line with customary market conditions. All WDP buildings are insured for their new construction value.
For further information on the insured value and the premiums paid for insurance cover, we refer to Chapter 11. Annual Accounts on pp. 228 and pp. 251.
To ensure optimal management of the property portfolio abroad, WDP NV/SA has subsidiaries and sub-subsidiaries in a number of European countries (these companies do not have the status of an institutional GVV/SIR).
1 The companies in the Group have a number of features in common.
1 The company structure is also the local equivalent of a private company ('BV') or a public limited company ('NV/SA').
1 WDP owns 100% of the shares in all foreign subsidiaries and sub-subsidiaries, except for WDP Romania (85%), and WDP Luxembourg (55%).
1 WDP NV/SA is represented in France by its permanent establishment at rue Cantrelle 28, 36000 Châteauroux, France.
1 WDP Nederland S.A. has another 100% subsidiary, WDP Development NL S.A., Hoge Mosten 2, 4822 NH Breda.
The results of the subsidiaries are subject to local corporation tax, except for WDP Nederland which has FBI status (Fiscale Beleggingsinstelling) and WDP France which has SIIC status (Société d’Investissement Immobilier Cotée), with the corresponding fiscal transparency.
More information on the FBI status and the SIIC status is available under REIT status earlier on in this chapter.
The net profits can be disbursed to WDP, in which case the withholding tax or exemption depends on the EU Parent-Subsidiary Directive, its implementation in the local legislation of the respective countries and the applicable double taxation agreements between Belgium and the various countries in which WDP is active. Results from foreign subsidiaries are included in the consolidation, after elimination of the depreciation of immovable goods and offset of deferred tax receivables.
The choice of financing method (group loans versus bank loans) must always take into account the impact of this financing on the consolidated gearing ratio for WDP (the maximum gearing ratio at the consolidated level must be respected and amounts to 65% as per GVV/SIR legislation. This same maximum gearing ratio also applies to the separate statements of the GVV/SIR). At the consolidated level, subordinate group loans do not affect the Group’s gearing ratio. On the other hand, bank loans do.
For this financing strategy, the main factors to consider (aside from the gearing ratio) are the two key principles of taxation that differ from country to country:
1 the rules on the thin capitalisation obligation for companies;
1 the withholding tax percentage to be deducted on interest payments on outstanding group loans disbursed to the country of origin.
Acquisition price
This refers to the value of the property at the time of purchase. Any transfer costs paid are included in the purchase price. See also Transfer costs.
Accelerated bookbuild (ABB)
An exempt accelerated private placement with international institutional investors with the composition of an order book.
APM (Alternative Performance Measure)
Financial measurement of historic or future financial performance, financial position or cash flow of a company that has not been defined in the customary reporting guidelines. The Alternative Performance Measures (APM) adopted by WDP – including the EPRA key performance indicators – are always accompanied by a symbol () and are provided with their definition and reconciliation in the appendices to this report.
CAGR
Compounded annual growth rate.
Contractual rent
The gross rental prices as contractually stipulated in the lease agreements on the date of conclusion.
Contribution in kind
The assets contributed when a company is incorporated or when its capital is increased, other than by depositing money.
Derivatives
As a borrower, WDP would like to hedge itself against any interest rate increases. The interest rate risk can be hedged in part by using derivatives (such as interest rate swaps).
Discounted cash flow
This is a valuation method based on a detailed projected revenue flow that is discounted to the current net value at a specific discount rate according to the risk of the asset to be valued.
Due diligence
Extensive investigation conducted within the framework of all acquisitions and/or financial transactions in the areas of real estate, economics, taxation, law, bookkeeping and administration, possibly in association with specialist external advisors.
The estimated rental value is the rental value determined by the independent property experts.
Fair value
The fair value is defined in IAS 40 as the amount for which the property could be exchanged between two well-informed, willing parties in an arm’s length transaction. The market value must additionally reflect the current rental incomes, the current gross margin for self-financing (or cash flow), the reasonable assumptions regarding potential rental income and the expected costs.
The IAS (International Accounting Standards) and IFRS (International Financial Reporting Standards) apply to the preparation of financial statements and are drafted by the International Accounting Standards Board (IASB).
IAS 16 Tangible fixed assets
IAS 16 is an IAS/IFRS that applies to the administrative treatment of tangible fixed assets unless a different standard requires or permits different treatment. The main issues arising in the administrative treatment of tangible fixed assets is the recognition of assets, calculation of their book value and depreciation costs and special impairment losses to be recognised in relation to the assets.
IAS 40 Investment properties
IAS 40 is an IAS/IFRS that applies to recognition and measurement of and the provision of information on investment properties. This standard therefore provides the treatment method for investment properties and the corresponding disclosure requirements.
IFRS 9 Financial instruments: recognition and measurement
IFRS 9 is a standard that determines how a company must classify and measure the financial instruments on its balance sheet. Among other things, this standard provides for the obligation that all derivatives must be booked in the balance sheet at their fair value.
Indexation
The rent is contractually adjusted for inflation annually on the anniversary of the contract start date based on the reference index in each specific country.
Income capitalisation
This is a valuation technique used for valuing real estate where the income stream is discounted in a perpetuity at a certain required rate of return. Subsequently, certain corrections are applied to account for deviations in full occupancy under market conditions (subletting, incentives, vacancies, etc.).
Initial yield
The ratio of the (initial) contractual rent of a purchased property to the acquisition cost. See also Acquisition price
Interest hedging
The use of derivative financial instruments to protect existing debt positions against an increase in interest rates.
An IRS where the start date is in the future.
An interest rate swap is an instrument in which parties exchange interest payments with one another for a set term. WDP uses Interest Rate Swaps to convert floating interest payments into fixed interest payments, to hedge against interest rate increases.
An independent body that develops global standards regarding valuations that investors and other third parties or stakeholders should be able to trust.
Optional dividend
The transfer of ownership of a property is, in principle, subject to the collection by the state of transfer rights that constitute the bulk of the transaction costs. The amount of these rights depends on the method of transfer, the capacity of the buyer and the geographical location of the property.
Partial demerger
A partial demerger is a legal transaction in which part of the assets of a company (both rights and obligations) is transferred to an existing or new company without dissolution, in exchange for transfer of shares in the acquiring company to shareholders in the demerging company.
Property portfolio
The portfolio value is composed of investment properties, investment properties under construction for own account with the purpose of being rented out, assets held for sale and the fair value of the solar panels.
Project development team
Management of construction or renovation projects. WDP has an internal team of project managers working exclusively for the company.
Property management team
Day-to-day management of the property portfolio, more specifically formulation of the policy for management of existing buildings (maintenance, modification and improvement works). WDP has an internal team of property managers working exclusively for the company.
Quality distribution of the properties in the property portfolio
The quality distribution of the properties within the property portfolio is based on a classification according to Class A green-certified warehouse, Class A warehouse, Class B warehouse and Class C warehouse. This classification is based on the following parameters: age and location of the property, clear height, prospects for expansion and/or development, equipment and parking.
Dividend yield
Gross dividend divided by the trading price.
Ex-date
Start date of trading the share on the stock market without entitlement to the next dividend distribution, in other words, the cut-off date of the coupon.
Percentage of shares owned by the public. According to the definition of EPRA and Euronext, this means every individual shareholder that possesses 5% of the total number of shares.
The gross dividend per share is the dividend before deduction of the withholding tax. See also Withholding tax
This is the average number of shares traded per trading day measured over a specific period of time.
Closing price on the stock market multiplied by the number of shares in circulation on that date.
This is equal to the gross dividend after deduction of the 30% withholding tax. See also Withholding tax
With an optional dividend, the dividend claim linked to an established number of existing shares provides the right to a new share, at an issue price per share that may include a discount compared to the stock market price (whether or not an average stock market price over a certain period). The issue of shares within the framework of the optional dividend is subject to standard company law on capital increases. If, in addition to a contribution in kind within the framework of the distribution of an optional dividend, a contribution in cash is made, the special provisions of article 26, § 1 of the GVV/SIR Act concerning capital increases in cash cannot be declared applicable in the articles of association, insofar as this optional dividend is effectively made payable to all shareholders. The special rules on contribution in kind to a GVV/SIR, as provided for by Article 26, § 2 of the GVV/SIR Act, do not apply either, provided certain conditions are met.
The date on which the positions are closed for identification of shareholders entitled to dividends, also known as the ex-date for short.
An advance levy deducted by a bank or financial intermediary on the payment of a dividend. The standard rate of the withholding tax on dividends in Belgium is fixed at 30%.
BREEAM (Building Research Establishment Environmental Assessment Method)
BREEAM is a sustainability certificate related to the performance of a building over its complete life cycle. BREEAM is the main and most commonly used sustainability label for buildings in Europe. Unlike other standards, BREEAM applies a multi-criteria approach. The certification process examines not only the energy consumption of a property, but also land use, ecology, the construction process, water use, waste, pollution, transport, materials, health and comfort. As a total score, a building is rated Acceptable (only applicable to BREEAM In-Use), Pass, Good, Very Good, Excellent or Outstanding.
Carbon dioxide (CO2)
A greenhouse gas produced by the decomposition of plant-based or animal matter.
Carbon removal
Carbon removal is a process where residual emissions (CO2) are removed from the atmosphere and stored for long periods of time. The removal of GHGs means the removal of greenhouse gases (GHDs) from the atmosphere by deliberate human activities. In other words, in addition to the removal that would occur via the natural carbon cycle or atmospheric chemical processes. Carbon removal is integrated as a part of the strategy to move – after the maximum reduction of greenhouse gas emissions – towards net-zero emissions.
Cradle-to-Grave
Refers to a full life cycle inventory, including all emissions and disposals of a given product or material starting from its acquisition up to the end of its useful life.
Cradle-to-Gate
Refers to a partial life cycle inventory, including all emissions and disposals starting from the purchase of the material up to the moment the material reaches the WDP worksite (and thus excluding the use of the end product and end of useful life).
Certification programme for green buildings that focuses on the efficient use of resources. EDGE supports developers and builders to quickly and cost-effectively reduce energy and water consumption or energy absorbed by materials. EDGE certificates are issued worldwide and are an initiative of IFC, part of the World Bank Group.
Embodied carbon
Greenhouse gases released during the production, transport and construction of building materials as well as during the demolition of buildings.
These are granted by the Flemish Electricity and Gas Market Regulator (the 'VREG') in Flanders, the Wallonia Energy Commission (the 'CWaPE') in Wallonia and the Romanian Energy Regulatory Authority (the 'ANRE') in Romania for alternative energy projects, including solar power, with a minimum price per certificate.
Greenhouse gases (GHG)
Greenhouse gases are a collection of gases expressed in CO2 equivalents that absorb heat from the sun and trap it in the Earth's atmosphere.
PV installation
Photovoltaic or solar panel system.
Scope 1
Direct greenhouse gas emissions caused by sources owned or under direct control of the Group, such as office and transport-related activities.
Scope 2
Indirect greenhouse gas emissions from the generation of purchased electricity or heat. This energy generation occurs outside the Group's control but results in the emission of greenhouse gases.
Scope 3
Indirect greenhouse gas emissions caused by the operating activities of another organisation in the value chain, both from suppliers and customers of the Group.
TCFD
The Task Force on Climate-related Financial Disclosure is a reporting standard that allows companies to report on the financial impact of climate factors on business operations.
Belgian code drawn up by the Corporate Governance Committee with practices and provisions on good governance that must be met by companies under Belgian law whose shares are traded on a regulated market.
EPRA is a pan-European association of listed real estate companies that aims to promote the sector, introduce best practices for bookkeeping, reporting and corporate governance, provide qualitative information to investors and serve as a think tank for challenges facing the sector.
Special fiscal status in the Netherlands available if specific requirements are met. See also 12. Appendices – Permanent document
Along with the National Bank of Belgium (the NBB), the FSMA supervises the Belgian financial sector. The powers of the FSMA fall into the following six areas: supervision of financial markets and listed companies, conduct supervision, product supervision, supervision of financial service providers and intermediaries, supervision of supplementary pensions and facilitation of better financial education.
A regulated real estate company is a listed operational real estate company that specialises in making real estate available to users and meets the legal requirements as set out in the GVV/SIR legislation. It positions itself in an international context as a REIT, characterised by a regime of fiscal transparency. The GVV/SIR is subject to the prudential supervision of the FSMA. See also GVV/SIR legislation
GVV/SIR
Royal Decree of 13 July 2014 on regulated real estate companies and, together with the GVV/SIR Act, the so-called GVV/SIR legislation. See also GVV/SIR Act, GVV/SIR legislation and REIT.
GVV/SIR Act
Act of 12 May 2014 on regulated real estate companies and, together with the GVV/SIR Act, the so-called GVV/SIR legislation. See also GVV/SIR Royal Decree, GVV/SIR legislation and REIT
GVV/SIR legislation
The Act of 12 May 2014 (GVV/SIR Act) and the Royal Decree of 13 July 2014 (GVV/SIR Royal Decree).
Reference shareholder
Any natural person, legal entity or company (possibly with a legal personality) that holds at least 10% of the shares in the Company individually and directly, in accordance with Article 15 of the Articles of Association of the Company.
International designation for listed real estate investment funds with a special tax status (such as in Belgium (see also GVV/SIR), the Netherlands (see also FBI) and France (see also SIIC)).
Special tax status available in France that listed real estate companies can opt for if the specific requirements are met. See also 12. Appendices – Permanent document
WDP NV/SA
Blakebergen 15, B-1861 Wolvertem
T. +32 (0)52 338 400
info@wdp.eu | www.wdp.eu
www.facebook.com/WDPwarehouses
@WDP_EU
linkedin.com/company/wdp
Company number: BE 0417.199.869 (Register of legal entities of Brussels, Dutch section)
Design and realisation: CF Report I Text and photography: WDP I Translations ElaN Translations This report has been printed on FSC certified paper.