

1 Press release – 30 July 2021 INTERIM REPORT 2023 Regulated Information
28 July 2023
Friday,
www.wdp.eu
1. WDP in the first half of 2023
• Strong earnings growth: EPRA Earnings per share are 0.71 euros over H1 2023, up by 14% year-on-year.
• Profitable investments within the 2022-25 growth plan: in the first half of 2023, an investment volume of approximately 125 million euros was identified with higher returns in light of the increased cost of capital
• Future-proof positioning in a volatile macro environment: robust balance sheet, strong liquidity position and diversified property portfolio crucial to supply chain, with inflation-resistant cash flow profile.
• Guidance 2023: WDP expects EPRA Earnings of 1.40 euros per share, up +12% compared to 1.25 euros per share in 2022.
2 Press release – 28 July 2023
Register
• EPRA Earnings: 144.4 million euros over H1 2023, up by 26% year-on-year (114.6 million euros in 2022). EPRA Earnings per share during H1 2023 amounted to 0.71 euros, up by 14% (0.62 euros in 2022), including a 10% increase in the weighted average number of shares outstanding, due to the strengthening of capital in 2022. This was mainly driven by the combined effect of pre-let new construction projects/acquisitions and organic growth (+6.1%) via the indexation of leases. The oneoff positive impact on EPRA Earnings of 9 million euros (0.04 euros per share) in H1 2023 and 2 million euros (0.01 euros per share) in H2 2023, related to the FBI status1 should be taken into account
• Occupancy rate and direct property market: the portfolio’s occupancy rate of 98.6% as of 30 June 2023 remains very high (99.1% per 31 December 2022), helped by continued healthy market dynamics and within a context of upward pressure on market rents. Moreover, in the first half of 2023, approximately 310,000 m² of pre-let new construction projects were completed.
• Portfolio: revaluation of -141.7 million euros (Q2 2023: -54.7 million euros) or -2.2% during H1 2023, primarily due to an upward yield shift in the existing portfolio by +27 bps and partly offset by the 3.5% increase in estimated market rent values. The portfolio is valued at 5.2% EPRA Net Initial Yield.
• Balance sheet: a loan-to-value as of 30 June 2023 of 38.3% compared to 35.4% as of 31 December 2022 driven by the payment of the dividend as well as the portfolio revaluation. The net debt / EBITDA (adj.) remains strong at 7.3x. WDP can continue to rely on a robust and liquid balance sheet (approximately 1.5 billion euros in unused credit lines). Thus, it has sufficient capacity to respond to investment opportunities. Moreover, WDP is well protected against further interest rate fluctuations with fully hedged debt.
• Growth plan 2022-25: in the first half of 2023, an investment volume of approximately 125 million euros was identified (Q2 2023: 70 million euros), consisting of both new projects and an acquisition (95 million euros at a yield of 7.2%) as well as energy investments (30 million euros at an IRR of 8%). Taking into account for the sharply increased cost of capital, WDP takes a more selective approach to new opportunities combined with higher return hurdles since 2023. WDP expects a yield of 6.4% for the total of the projects currently under development (425 million euros).
WDP remains focused on its objective of achieving EPRA Earnings per share of 1.50 euros by 2025 through increased focus on profitability of new projects, organic growth (mainly through rent indexation) and energy projects, while maintaining a solid financial balance sheet.
• Outlook 2023: expected EPRA Earnings per share for 2023 of 1.40 euros, up +12% year-on-year. Based on this outlook, a dividend per share of 1.12 euros (previously 1.08 euros) gross is forecast for 2023 (payable in 2024), based on a comparable increase and a low pay-out rate of 80%. Note that guidance was recently increased due to FBI status changes1
This outlook is based on the current knowledge and situation and excludes unforeseen circumstances within the context of the evolution of external factors such as a weakening macroeconomic outlook, high market volatility and a sharply increased cost of capital
3 Press release – 28 July 2023
1 Driven by the reversal of provisions. See the press release dated 3 July 2023 and 1.5 Taxes in Chapter 4. Financial results
2. Performance


1. Operating activities

98.6%
LEASE AGREEMENTS

12% MATURING IN 2023
✓ 80% renewed
SUSTAINABLE

4 Press release – 28 July 2023
COMPLETED PROJECTS ONGOING POTENTIAL SURFACE AREA 309,000 m² 573,000 m² ~1,500,000 m² INVESTMENTS 219 425 million euros million euros INITIAL GROSS RENTAL YIELD 6.3% 6.4% 5.8% in Western Europe 8.0% in Romania 6.0% in Western Europe 7.5% in Romania AVERAGE LEASE TERM 14.5 years 11.2 years ACQUISITIONS
million euros
10
OCCUPANCY RATE
✓ Confirmation of trust GROWTH
1.1. Acquisitions and disinvestments
1.1.1. Acquisitions
Via a sale-and-lease-back for a site in Mioveni in Romania – a 10 million euros investment – WDP became the owner of a warehouse with a lettable area of over 20,000 m² leased for fifteen years to SFC Solutions Automotive Romania, a producer of rubber profiles for the automotive sector. The site is located in the immediate vicinity of the Renault Dacia factory, one of SFC Solutions Automotive’s main customers. SFC Solutions Automotive is convinced of the strategic value of this site, which also offers expansion opportunities according to the customer’s growth. This transaction was made at a price in line with fair value as determined in the valuation report of the independent property experts. It generates a yield for WDP that is in line with the market.
1.1.2. Disposals
Disinvestment of a non-strategic site in Belgium for approximately 8 million euros.
1.2. Projects completed in the course of the first half of 2023 were completed
In the first half of 2023, WDP successfully completed the following pre-let projects with a total surface area of approximately 309,000 m². The initial gross rental yield for the total of these completed projects amounts to 6.3%2, with an investment amount of approximately 219 million euros. The average lease term is 14.5 years.
5
Press release – 28 July 2023
Location Tenant Delivery date Lettable area (in m²) Investment budget (in million euros) 2019-23 BE Courcelles DHL 2Q23 2,885 8 BE Gent Sligro 2Q23 21,109 15 BE 23,994 22 2019-23 LU Bettembourg Multi-tenant 1Q23 25,000 13 LU 25,000 13 2019-23 NL Barendrecht Ahold 2Q23 26,700 24 NL Breda Lidl 1Q23 31,000 22 NL Zwolle wehkamp 2Q23 33,000 26 NL De Lier De Jong Verpakking 1Q23 83,000 54 NL Amsterdam Dynalogic 1Q23 13,700 11 NL 187,400 136 2019-23 RO Slatina Pirelli 2Q23 25,000 15 2022-25 RO Bucharest - Stefanestii de Jos E-Pantofi 1Q23 34,402 21 RO Bucharest - Stefanestii de Jos Kitchen&Shop / Lecom 1Q23 12,864 11 RO 72,266 47 Total 308,660 219
2 This represents an initial gross rental yield of approximately 5.8% in West Europe and 8% in Romania.
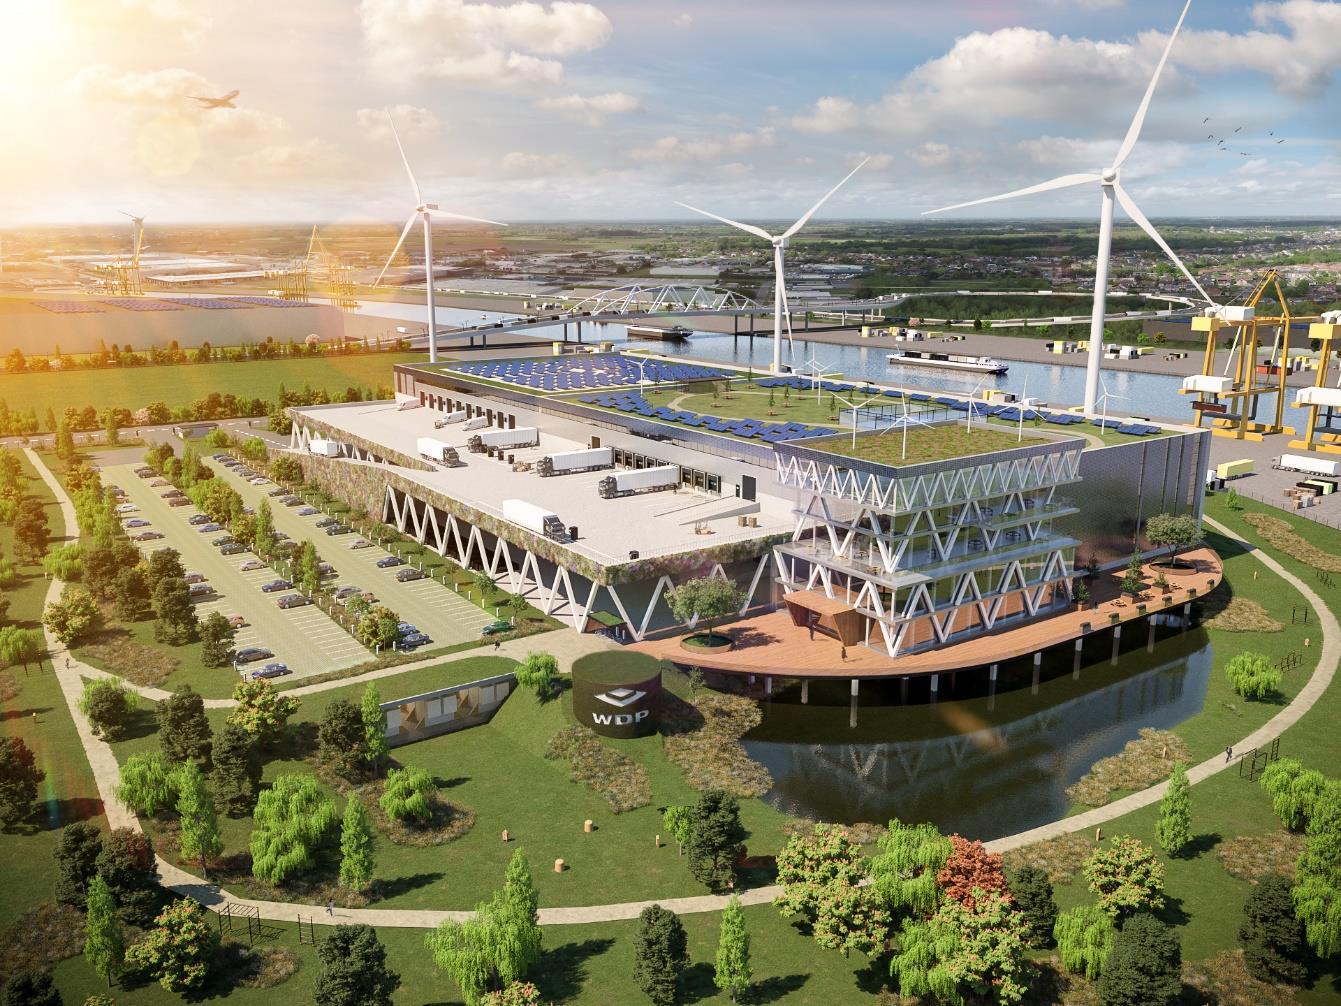
Netherlands - De Lier De Jong Verpakking
Using limited space inventively

Stacking is smarter. Multi-layer warehouses respond to scarce land availability.
83,000 m² GLA on a 56,000 m² parcel (saving over 100,000 m² of surface area)
The direct connection to the existing De Jong Packaging site optimises the customer’s supply chain. Brownfield development
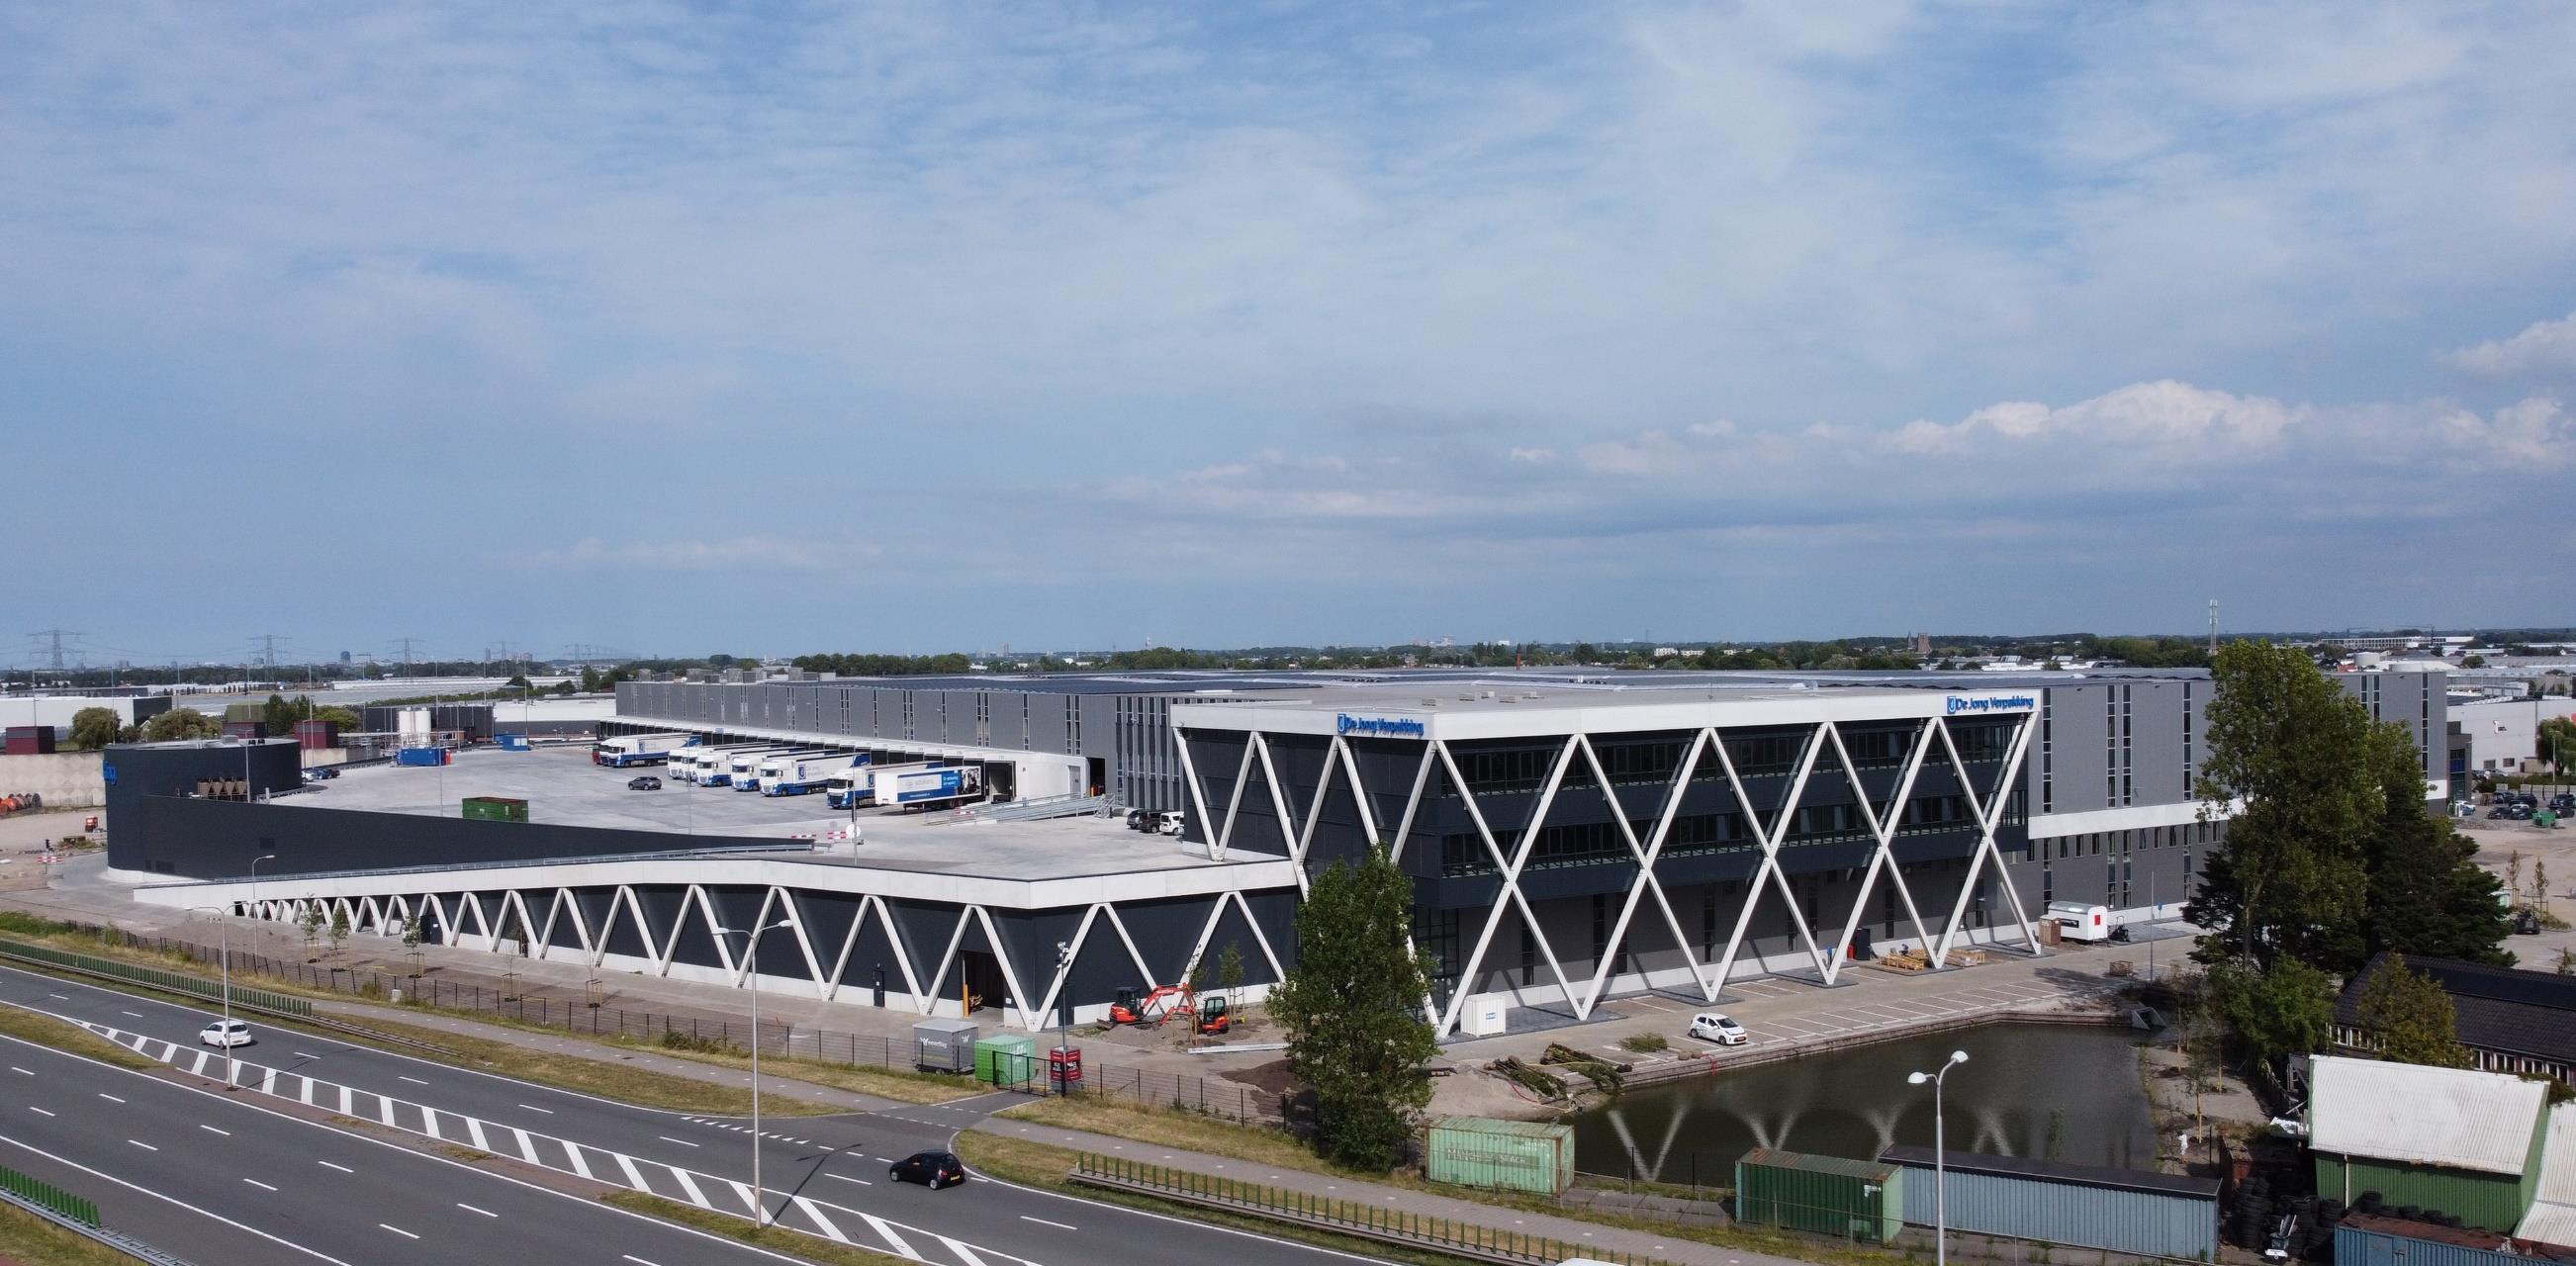
Formerly The Greenery site owned since 2016.
Fully automatic roller storage and conveyor
Solar panels


Gasless warehouse and offices

1.3. Ongoing projects
WDP expects the total of approximately 425 million euros3 of ongoing projects – with a total surface area of approximately 573.000 m² – to generate an initial gross rental yield of approximately 6.4%4 This pipeline is 90% pre-let and the average duration of the leases is 11.2 years.
For the projects identified and added to the development pipeline during the first half of 2023 (85 million euros), WDP expects to generate an initial gross return of 7.0%, in line with the targeted profitability requirements based on the sharply increased cost of capital.
1.3.1. Projects identified in the course of the second quarter of 2023 were identified5 Belgium
Investments within the scope of the Gosselin-WDP partnership
Gosselin, a specialist provider of international moving and logistics services, and WDP are collaborating to develop modern logistics sites that will support Gosselin’s future growth. Within the scope of the recently established Gosselin-WDP joint venture, four new construction projects are planned for a total investment value of over 25 million euros (WDP-share), including a redevelopment in Schoten (ex-Milcobel) and a project in Genk. The location of the new sites always align with Gosselin’s strategic growth story. For example, the Schoten site is located along the Albert Canal and has a direct connection to Gosselin’s existing container terminal. After completion, Gosselin will lease the sites for a 15-year period.
The Netherlands Schiphol, Folkstoneweg
At this location – in the second line to Schiphol Airport – the existing warehouse was demolished in the meantime to develop a modern distribution centre that can be used for air cargo operations. The new premises will have a surface area of over 10,000 m² and should be operational during the first quarter of 2025. WDP projects an investment of 14 million euros for this redevelopment. Commercialisation is ongoing.
Upgrade of existing locations
Some smaller projects to expand existing sites in Belgium and the Netherlands, together accounting for an investment of approximately 20 million euros.
3 Of these, 313 million euros must still be invested.
4 This represents an initial gross rental yield of approximately 6.0% in West Europe and 7.5% in Romania.
5 Based on 100% of the investment for the fully consolidated entities (including WDP Romania) and WDP’s proportional share in the joint ventures (notably 55% for Luxembourg and 29% for Gosselin-WDP).
7 Press release – 28 July 2023
1.3.2. Overview of all ongoing projects6,7
Of the total investment volume of 425 million euros, 313 million euros still had to be invested per 30 June 2023.
6 Based on 100% of the investment for the fully consolidated entities (including WDP Romania) and WDP’s proportional share in the joint ventures (notably 55% for Luxembourg and 29% for GosselinWDP). The lettable area for joint ventures is always shown on a 100% basis.
7 Concerning the redevelopment projects, this does not factor in the value of the redevelopment projects before the start of the renovation.
8 Press release – 28 July 2023
Location Type Tenant Planned delivery date Lettable area (in m²) Investment budget in million euros) Pre-leased Projected yield 2019-23 BE Antwerp New development Fully let 3Q24 14,893 18 100% BE Bornem New development Fully let 4Q24 20,215 27 100% 2022-25 BE Asse Redevelopment Fully let 1Q24 6,913 5 100% BE Genk New development Fully let 2Q25 30,000 29 100% BE Gent New development Uselect 3Q23 11,590 9 100% BE Liège New development Logistics service provider 3Q23 34,457 21 100% BE Lokeren New development Fully let 3Q24 9,204 13 100% BE Lokeren Redevelopment stow Robotics 3Q23 23,839 2 100% BE Various* New development/Redevelopment WWRS 1Q25 123,500 25 100% BE 274,611 150 100% 2022-25 FR Vendin-le-Vieil New development In commercialisation 4Q24 14,779 10 0% FR 14,779 10 0% 2019-23 LU Contern* New development Fully let 1Q24 15,000 10 100% LU 15,000 10 100% 2019-23 NL Heerlen New development CEVA Logistics 3Q23 31,000 24 100% NL Kerkrade New development In commercialisation 3Q24 29,500 29 68% NL Zwolle New development Ahold 4Q23 21,000 31 100% 2022-25 NL Breda New development In commercialisation 2Q24 25,768 20 50% NL Veghel New development Alliance Health Care 4Q23 16,000 19 100% NL Zwolle New development Abbott 2Q24 18,000 25 100% NL Schiphol Redevelopment In commercialisation 1Q25 10,400 14 0% NL 151,668 162 79% 2022-25 RO Almaj New development Erkut 3Q23 6,242 5 100% RO Buzau New development Ursus Breweries 4Q23 5,216 6 100% RO Sibiu New development Siemens 1Q24 8,761 6 100% RO Slatina New development Pirelli 3Q24 48,335 36 100% RO Târgu New development Taparo 4Q23 14,656 8 100% RO Timisoara New development Ericsson 2Q24 33,455 32 100% RO 116,665 92 100% Total 572,723 425 90% 6.4% *Joint venture
1.4. Further potential


WDP currently has a land reserve for future development of approximately 1.5 million m² of leasable area, spread over the regions in which the company is active.

9 Press release – 28 July 2023
±1,500,000 M²(1) BE-LUFR NL RO LAND RESERVE
(1) Potential buildable surface area.LU-FR
2. Investments in energy


The installation of energy projects with a capacity of 90 MWp is on schedule (with an investment budget of approximately 70 million euros8). These investments fall within the total ambitioned investment of 150 million euros in energy projects during 2023-24. The expected Internal Rate of Return (IRR) is approximately 8%.9 In the first half of 2023, of these projects, the implementation of the solar panel system at WDPort of Ghent and the first Green Mobility Hub was completed.
2.1. The largest single rooftop solar park in Europe is in WDPort of Ghent

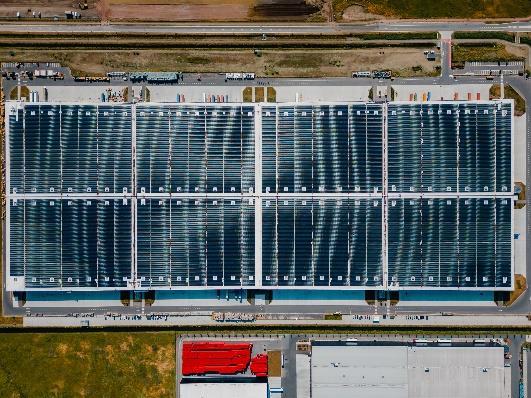
At the end of the first half of 2023, some 37,000 solar panels had been installed and commissioned on the roof of the logistics warehouse for X2O Bathrooms and Exterioo. This site with a total surface area of over 150,000 m², has a capacity of 25 MWp, which is enough capacity to provide power for 8,000 to 9,000 families. Part of the power generated is used on-site by the customer with the balance being supplied to the grid and large consumers in the area. The investment for this completed project is 16 million euros.
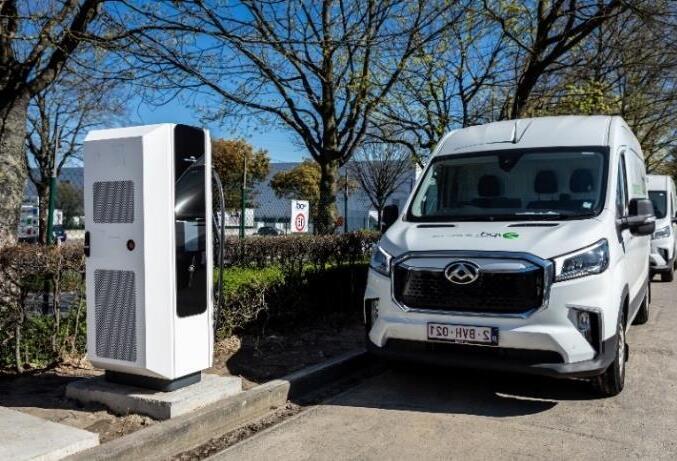
2.2. Green Mobility Hub for VPD in Zellik
In the meantime, this pilot project was successfully completed: the WPD site in Zellik now operates as a Green Mobility Hub. Specifically, the site was equipped with a 1.5 MWp solar energy installation connected to a battery for energy consumption efficiency, 10 fast chargers for vans and lorries and 17 charge points for cars. Logistics provider VPD – the tenant of this site – handles last-mile operations from this site in a CO2-neutral way. So, the Green Mobility Hub developed by WDP on an existing site provides the energy production and infrastructure needed by the customer to decarbonise transport and operations on-site and also supports the wider community. The investment for this completed project is 4 million euros.
8 Of which 38 million euros is still to be invested.
9 See the press release dated 27 January 2023.
10 Press release – 28 July 2023
FUTURE LOGISTICS 2025 2021 95 MWp 2022 113 MWp Pipeline TARGETED CAPACITY 2008
3. #TeamWDP
3.1. Digital HR: Employee engagement survey
#TeamWDP is the driving force behind our organisation. The well-being, safety and development of our staff is paramount. This is why we want to achieve an average satisfaction score of 8/10 on the annual survey of the entire team. As part of the ‘Digital HR’ track, the employee engagement survey was organised by an external partner for the first time. The team was surveyed about their perceptions of WDP, the team and the underlying collaboration, job content and mental wellness. The overall satisfaction KPI of 8/10 for 2023 was met in this survey.
3.2. International #TeamWDP Day
This time, the annual corporate team day focused on Ownership as the key to great collaboration as a single team so we can achieve the goals within the 2022-25 growth plan. This topic was explored in inspiring workshops led by the Vlerick Business School.

11 Press release – 28 July 2023
VITALLY ENGAGED
3. The share
1. The share
The Alternative Performance Measures (APM), used by WDP, are accompanied by a symbol (♦). The definition and reconciliation can be consulted in the Annexes of this document.

1 The number of shares traded per half-year divided by the total number of free float shares at the end of term and then extrapolated to a term of twelve months.
2 IFRS NAV: the IFRS NAV is calculated as shareholder equity as per IFRS divided by the number of dividend-entitled shares on the balance sheet date. It pertains to the net value per share of the public GVV/SIR according to GVV/SIR legislation.
3 On the basis of the pro-rata-temporis basis for the weighted average number of shares over the period.
4 On the basis of the number of shares entitled to dividend at the end of each period.
EURONEXT Brussels and Amsterdam


IPO: 28/06/1999
Listing: continuous
ISIN code: BE0003763779
Liquidity provider: Kempen & Co and KBC Securities
12 Press release – 28 July 2023
Figures per share 30.06.2023 31.12.2022 31.12.2021 Number of shares in circulation on closing date 207,118,066 203,980,363 184,772,193 Free float 78% 78% 76% Market capitalisation (in euros) 5,202,805,818 5,446,275,704 7,793,691,101 Traded volume in shares 24,828,644 88,782,514 55,353,642 Average daily volume (in euros) 5,409,999 10,834,034 7,132,819 Free float velocity¹ 30.8% 55.8% 39.3% Stock exchange price highest 30.5 41.7 42.3 lowest 24.8 23.1 26.7 closing 25.1 26.7 42.2 IFRS NAV² (in euros) 20.1 20.9 19.0 EPRA NTA (in euros)♦ 19.6 20.7 20.1 Dividend payout ratio n.r. 86% 81% EPRA Earnings/share³ (in euros) 0.71 1.25 1.10 EPRA Earnings/share⁴ (in euros) 0.70 1.16 1.08 Gross dividend/share (in euros) n.r. 1.00 0.88 Net dividend/share (in euros) n.r. 0.70 0.62
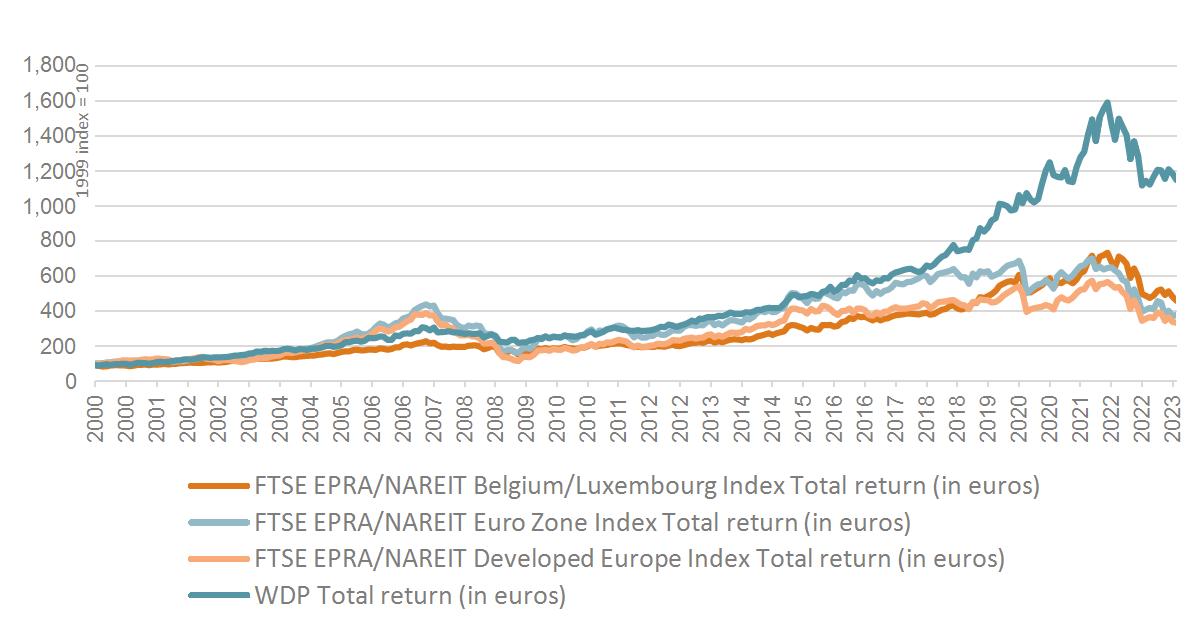
WDP share return versus EPRA indices
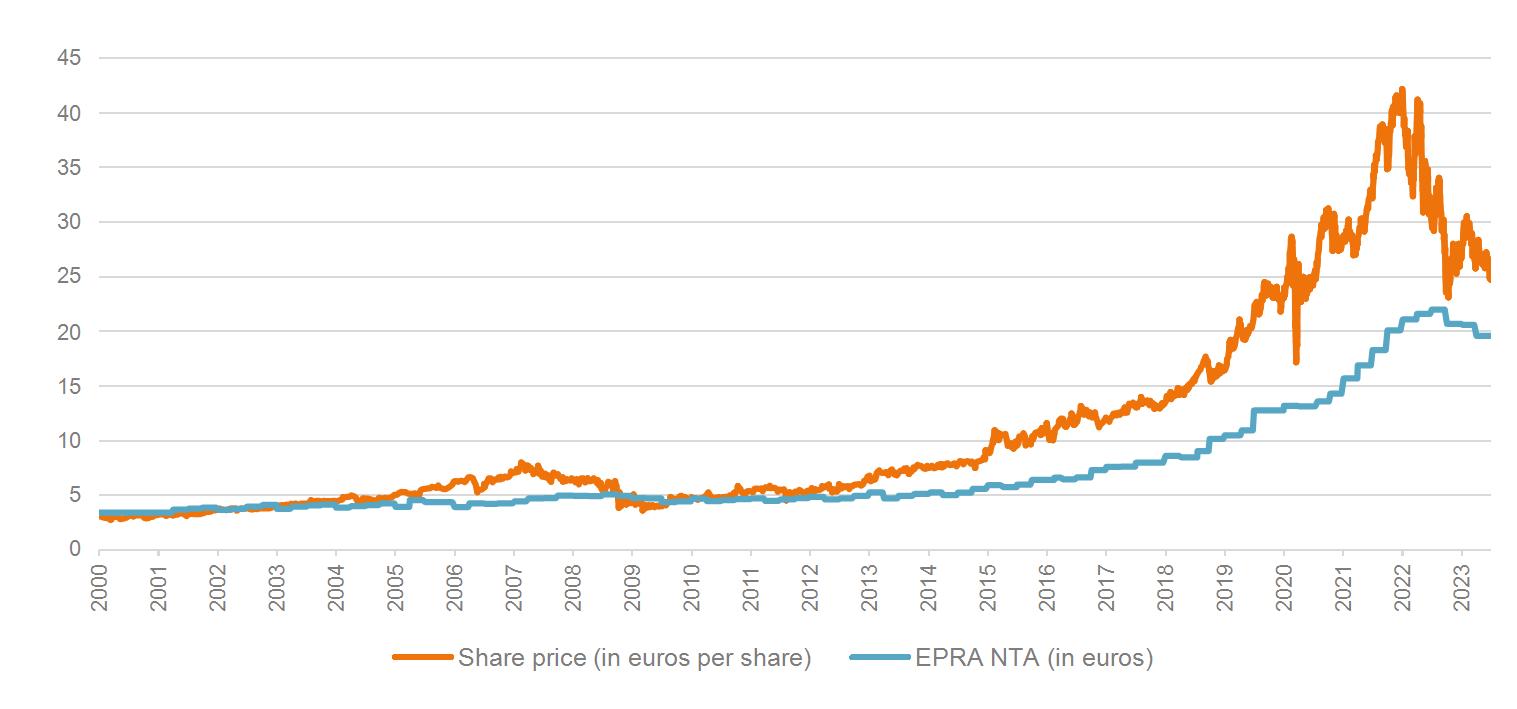
Share price versus EPRA NTA
2023
13 Press release – 28 July
2. Share ownership
1 The percentage is determined under the assumption that the number of shares has not changed since the most recent declaration of transparency, and taking into account the total number of outstanding shares in WDP.
2 The number of publicly held shares was determined under the assumption that since the declarations of transparency, nothing has changed with regard to the composition of the share portfolio of the shareholders obligated to report major holdings by virtue of the Belgian Law of 2 May 2007 on disclosure of major holdings in issuers whose shares are admitted for trading on a regulated market and with various provisions.
3 On 26 October 2012, the Reference Shareholder, the Jos De Pauw family, assigned all of its shares, held in mutual concert, in joint ownership under the family company structure RTKA, which institutionalised the existing mutual concert. The holders of voting rights are the members of the management body RTKA, to the exclusion of all other right holders in respect to the participation.
3. Financial calendar
14 Press release – 28 July 2023
Number of shares (declared) Date of the statement (in %) Free float 161,095,619 77.8% BlackRock-related companies¹ 9,448,417 12.02.2021 4.6% AXA Investment Managers S.A.¹ 4,738,986 02.11.2018 2.3% Norges Bank¹ 6,165,853 19.05.2023 3.0% Other shareholders under the statutory treshold² 140,742,363 17.05.2023 68.0% Family Jos De Pauw (reference shareholder)³ 46,022,447 17.05.2023 22.2% Total 207,118,066 100%
13-14 September 2023 WDP Capital Markets Day 18 October 2023 Announcement of Q3 2023 results 26 January 2024 Announcement of 2023 annual results 25 March 2024 Publication of annual report for financial year 2023 24 April 2024 Annual General Meeting on the 2023 financial year 25 April 2024 Ex-date dividend 2023 26 April 2024 Record date dividend 2023
reference
to the financial agenda
WDP
For any changes,
is made
on the
website
The definition and reconciliation of the Alternative Performance Measures (APM), for example the EPRA key performance measures, used by WDP, are to be consulted in the Annexes of this document.


15 Press release – 28 July 2023 +26%
144.4 million euros 6.7 billion euros 91.0% EPRA Earnings Fair value of the property portfolio Operating margin 0.71 euros 98.6% 6.1% EPRA Earnings per share Occupancy rate Like-for-like rental growth 5.4 year(s) 19.6 euros Average term of the leases EPRA NTA per share EPRA key performance indicators 30.06.2023 31.12.2022 EPRA NTA (in euros per share) 19.6 20.7 EPRA NRV (in euros per share) 21.5 22.6 EPRA NDV (in euros per share) 20.9 21.8 EPRA LTV (in %) 38.9 36.7 EPRA Net Initial Yield (in %) 5.2 5.0 EPRA Topped-up Net Initial Yield (in %) 5.2 5.0 EPRA vacancy rate (in %) 1.4 0.9 EPRA Cost Ratio (incl. direct vacancy costs) (in %) 10.2 10.0 EPRA Cost Ratio (excl. direct vacancy costs) (in %) 10.0 9.7
4. Financial results
+14%
Consolidated key figures
The Alternative Performance Measures (APM), for example the EPRA key performance measures, used by WDP, are accompanied by a symbol (♦). Their definition and reconciliation can be consulted in the Annexes of this document.
1 Calculated by dividing annualised contractual gross (cash) rents by fair value. The fair value is the value of the property investments after deduction of transaction costs (mainly transfer tax).
2 Calculated based on the rental values for the leased properties and the non-leased surfaces. Ongoing projects and/or renovations are not considered.
3 Based on the comparison between H1 2023 and H1 2022.
4 Defined as operating result (before the result on the portfolio) divided by interest charges less interest and dividends collected less the fee for financial leasing and other.
5 The remaining duration of debt at fixed rate and interest rate hedges entered into to hedge the debt against interest rate fluctuations.
6 IFRS NAV: Net asset value before profit distribution of the current year in accordance with the IFRS balance sheet. The IFRS NAV is calculated as the shareholders’ equity as per IFRS divided by the number of shares entitled to dividend on the balance sheet date
16 Press release – 28 July 2023
Operational 30.06.2023 31.12.2022 Fair value of property portfolio (including solar panels) (in million euros) 6,657.8 6,656.0 Gross initial yield (including vacancies)¹ (in %) 5.9 5.7 Net initial yield (EPRA) (in %) 5.2 5.0 Average lease term (until first break) (in years) 5.4 5.5 Occupancy rate² (in %) 98.6 99.1 Like-for-like rental growth (in %)♦ 6.1 4.0 Operating margin³ (in %)♦ 91.0 91.5 Financial 30.06.2023 31.12.2022 Loan-to-value (in %)♦ 38.3 35.4 Gearing ratio (proportionate) (in line with the GVV/SIR Royal Decree) (in %) 40.1 37.6 Net debt / EBITDA (adjusted) (in x)♦ 7.3 7.1 Interest Coverage Ratio⁴ (in x) 6.4 5.9 Average cost of debt (in %)♦ 1.9 1.9 Average remaining duration of outstanding debt (in years) 5.5 5.6 Weighted average maturity of all drawn and undrawn credit lines 5.1 5.6 Hedge ratio (in %)♦ 107 97 Average remaining term of hedges⁵ (in years) 6.1 6.6 Result (in million euros) 30.06.2023 30.06.2022 Property result 173.3 153.8 Operating result (before the result on the portfolio) 157.7 140.8 Financial result (excluding change in the fair value of financial instruments)♦ -20.5 -20.8 EPRA Earnings♦ 144.4 114.6 Result on the portfolio (including share joint ventures) - Group share♦ -89.6 210.9 Change in the fair value of financial instruments - Group share -20.8 133.5 Depreciation and write-down on solar panels (including share joint ventures) - Group share -4.5 -3.2 Net result (IFRS) - Groupe share 29.5 455.7 Details per share (in euros) 30.06.2023 30.06.2022 EPRA Earnings♦ 0.71 0.62 Result on the portfolio (including share joint ventures) - Group share♦ -0.44 1.14 Change in fair value of the financial instruments - Group share -0.10 0.72 Depreciation and write-down on solar panels - Group share -0.02 -0.02 Net result (IFRS) - Group share 0.14 2.46 IFRS NAV⁶ 20.1 21.3 EPRA NTA♦ 19.6 21.6 EPRA NRV♦ 21.5 23.4 EPRA NDV♦ 20.9 21.8
1. Notes to the profit and loss account
Consolidated results (analytical scheme)
Key ratios
17 Press release – 28 July 2023
(in euros x 1,000) H1 2023 H1 2022 ∆ y/y (abs.) ∆ y/y (%) Rental income, net of rental-related expenses 163,237 141,584 21,653 15.3% Indemnification related to early lease terminations 103 0 103 n.r. Income from solar energy 12,347 11,685 661 5.7% Other operating income/costs -2,352 524 -2,876 n.r. Property result 173,335 153,793 19,542 12.7% Property charges -7,281 -6,005 -1,276 21.3% General Company expenses -8,330 -7,014 -1,316 18.8% Operating result (before the result on the portfolio) 157,723 140,773 16,950 12.0% Financial result (excluding change in the fair value of the financial instruments) -20,489 -20,771 282 -1.4% Taxes on EPRA Earnings 6,537 -5,315 11,852 n.r. Deferred taxes on EPRA Earnings -1,890 0 -1,890 n.r. Share in the result of associated companies and joint ventures 6,491 3,377 3,114 n.r. Minority interests -3,973 -3,462 -511 14.7% EPRA Earnings 144,399 114,602 29,798 26.0% Variations in the fair value of investment properties (+/-) -137,174 247,398 -384,571 n.r. Result on disposal of investment property (+/-) -1,504 -55 -1,450 n.r. Deferred taxes on the result on the portfolio (+/-) 58,551 -51,261 109,811 n.r. Share in the result of associated companies and joint ventures -12,347 19,364 -31,712 n.r. Result on the portfolio -92,474 215,447 -307,921 n.r. Minority interests 2,873 -4,574 7,447 n.r. Result on the portfolio - Group share -89,601 210,873 -300,474 n.r. Change in the fair value of financial instruments -20,355 130,047 -150,402 n.r. Share in the result of associated companies and joint ventures -442 3,426 -3,867 n.r. Change in the fair value of financial instruments -20,796 133,473 -150,402 n.r. Minority interests 0 0 0 n.r. Change in the fair value of financial instruments - Group share -20,796 133,473 -154,269 n.r. Depreciation and write-down on solar panels -4,533 -3,250 -1,283 n.r. Share in the result of associated companies and joint ventures -61 1 -62 n.r. Depreciation and write-down on solar panels -4,594 -3,249 -1,345 n.r. Minority interests 142 39 104 n.r. Depreciation and write-down on solar panels - Group share -4,452 -3,211 -1,241 n.r. Net result (IFRS) 30,508 463,735 -433,227 n.r. Minority interests -958 -7,998 7,040 n.r. Net result (IFRS) - Group share 29,550 455,737 -426,187 n.r.
(in euros per share) H1 2023 H1 2022 ∆ y/y (abs.) ∆ y/y (%) EPRA Earnings¹ 0.71 0.62 0.09 14.2% Result on the portfolio - Group share¹ -0.44 1.14 -1.57 n.r. Change in the fair value of financial instruments - Group share¹ -0.10 0.72 -0.82 n.r. Depreciation and write-down on solar panels - Group share¹ -0.02 -0.02 0.00 n.r. Net result (IFRS) - Group share¹ 0.14 2.46 -2.31 n.r. EPRA Earnings² 0.70 0.61 0.08 13.5% Weighted average number of shares 204,743,120 185,517,102 19,226,017 10.4% Number of shares entitled to dividend 207,118,066 186,557,793 20,560,273 11.0% 1 Calculation based on the weighted average number of shares. 2 Calculation based on the number of shares entitled to dividend.
Key ratios
results
1 Calculation based on the weighted average number of shares.
2 Calculation based on the number of shares entitled to dividend.
18 Press release – 28 July
Consolidated
(in euros x 1,000) Q2 2023 Q2 2022 ∆ y/y (abs.) ∆ y/y (%) Rental income, net of rental-related expenses 82,343 71,345 10,998 15.4% Indemnification related to early lease terminations 103 0 103 n.r. Income from solar energy 8,670 8,061 608 7.5% Other operating income/costs 592 2,561 -1,969 n.r. Property result 91,708 81,967 9,741 11.9% Property charges -3,627 -2,728 -899 33.0% General Company expenses -5,069 -4,804 -265 5.5% Operating result (before the result on the portfolio) 83,012 74,435 8,577 11.5% Financial result (excluding change in the fair value of the financial instruments) -10,475 -10,700 225 -2.1% Taxes on EPRA Earnings 9,473 -3,263 12,736 n.r. Deferred taxes on EPRA Earnings -1,890 0 -1,890 n.r. Share in the result of associated companies and joint ventures 3,557 2,915 642 n.r. Minority interests -1,957 -1,783 -174 n.r. EPRA Earnings 81,721 61,604 20,117 32.7% Variations in the fair value of investment properties (+/-) -55,717 120,978 -176,696 n.r. Result on disposal of investment property (+/-) -1,702 0 -1,702 n.r. Deferred taxes on the result on the portfolio (+/-) 49,583 -22,079 71,662 n.r. Share in the result of associated companies and joint ventures -4,714 17,576 -22,290 n.r. Result on the portfolio -12,550 116,475 -129,025 n.r. Minority interests -204 -4,465 4,261 n.r. Result on the portfolio - Group share -12,754 112,011 -124,764 n.r. Change in the fair value of financial instruments 9,030 55,779 -46,749 n.r. Share in the result of associated companies and joint ventures -282 3,426 -3,708 n.r. Change in the fair value of financial instruments 8,748 59,205 -50,457 n.r. Minority interests 0 0 0 n.r. Change in the fair value of financial instrumentsGroup share 8,748 59,205 -50,457 n.r. Depreciation and write-down on solar panels -2,219 -1,548 -671 n.r. Share in the result of associated companies and joint ventures -25 1 -26 n.r. Depreciation and write-down on solar panels -2,244 -1,547 -697 n.r. Minority interests 30 19 10 n.r. Depreciation and write-down on solar panels - Group share -2,214 -1,528 -687 n.r. Net result (IFRS) 77,632 237,520 -159,889 n.r. Minority interests -2,131 -6,229 4,098 n.r. Net result (IFRS) - Group share 75,501 231,292 -155,791 n.r.
2023
(in euros per share) Q2 2023 Q2 2022 ∆ y/y (abs.) ∆ y/y (%) EPRA Earnings¹ 0.40 0.33 0.07 20.1% Result on the portfolio - Group share¹ -0.06 0.60 -0.66 n.r. Change in the fair value of financial instruments - Group share¹ 0.04 0.32 -0.28 n.r. Depreciation and write-down on solar panels - Group share¹ -0.01 -0.01 0.00 n.r. Net result (IFRS) - Group share¹ 0.37 1.24 -0.88 n.r. EPRA Earnings² 0.39 0.33 0.06 19.5% Weighted average number of shares 205,497,494 185,986,347 19,511,147 10.5% Number of shares entitled to dividend 207,118,066 186,557,793 20,560,273 11.0%
1.1. Property result
The property result amounts to 173.3 million euros over the first half of 2023, up by 12.7% versus last year (153.8 million euros). The increase stems from the strong organic growth in rents combined with growth achieved through new pre-let development projects and acquisitions. Without changes to the portfolio, rental income levels increased by 6.1 driven by the indexation of leases. WDP sees this like-for-like rental growth (broken down as 6.6% in Q1 and 5.6% in Q2) falling further throughout the year given the peak in inflation end 2022. For 2023, we expect a like-for-like of +5.0%.
The property result also includes 12.3 million euros in solar panel income compared to 11.7 million euros last year. This is a limited increase because of higher capacity, which was partly offset by lower electricity prices. A continued increase is expected in the coming quarters based on the further roll-out of the PV programme.
Gross rental income by country
1.2. Operating result (before the result on the portfolio)
The operating result (before the result on the portfolio) amounts to 157.7 million euros for first half of 2023, an increase of 12.0% compared to the same period last year (140.8 million euros). The property and other general expenses together amounted to 15.6 million euros over H1 2023, up +20% year-on-year, in line with portfolio growth plus indexation of wages. The operating margin remains high at 91.0%.
1.3. Financial result (excluding changes in the fair value of the financial instruments)
Despite the significantly strengthened liquidity position (notably through additional credit lines), and sharply increased Euribor interest rates (from -0.2% as of 30 June 2022 to 3.6% as of 30 June 2023 for 3-month Euribor), the financial result (excluding variations in the fair value of the financial instruments) remained quasi-stable at -20.5 million euros compared to last year (-20.8 million euros). This is due to debt being completely hedged against rising interest rates. Moreover, the average outstanding financial debt remained unchanged due to equity financing of investments over the past 12 months. This financial result includes the recurring interest rate of -1.7 million euros for land under concession, which in accordance with IFRS 16 will be accounted for through the Financial result.
Total financial debts (in accordance with IFRS) are 2,601.5 million euros as of 30 June 2023, compared to 2,608.4 million euros in the same period last year. The average interest rate is 1.9% during the first half of 2023, unchanged from the same period in 2022 (1.9%) thanks to the strong hedge ratio.
19 Press release – 28 July 2023
(in euros x 1,000) Belgium The Netherlands France Germany Romania Total IFRS Luxembourg¹ Other joint ventures¹ I. Rental income 50,251 72,740 3,856 1,767 35,069 163,683 2,075 221 III. Costs related to leases² -276 323 -185 -15 -191 -343 0 -4 Rental income, net of rentalrelated expenses 49,975 73,063 3,671 1,753 34,878 163,340 2,075 217
1 Taking into account the proportional share in WDP's rental income for Luxemburg (55%) and the other joint ventures.
2 The heading Costs related to leases consists of Provisions for trade receivables and Rent to be paid for leased premises.
1.4. Share in the result of associated companies and joint ventures
The result of 6.5 million euros over the first half of 2023 mainly concerns the contribution following the participation in Catena of 5.2 million euros since Q2 2022, which is recognised in the IFRS accounts via the equity accounting method.
1.5. Taxes
When preparing the profit and loss account, a situation was taken into account as of 1 January 2021 in which WDP could not continue to qualify as an FBI in the Netherlands, due to the former significant uncertainty given the tax ruling that was revoked as of 1 January 2021, as explained earlier.
Given that a tax ruling is not an absolute requirement to be able to apply the FBI regime, and that WDP believes that it meets all the conditions, and the circumstances and facts are unchanged, the company continues to file its tax returns as an FBI. In early July 202310, WDP Nederland received its corporation tax assessment for the financial year 2021 as FBI. This confirms that the company has met all the requirements set for FBIs for the 2021 accounting year. On that basis, and with the facts and circumstances remaining unchanged for the time being, WDP concludes that the company continues to meet all conditions under the current legislative framework. As such, WDP expects that the Dutch FBI regime will remain applicable during the 2022, 2023 and 2024 accounting years before lapsing, given the Dutch government’s plans to use a legislative amendment to exclude real estate investments from the Dutch FBI regime as of 1 January 2025.
As a result, WDP reversed the provision booked in 2021 and 2022 and forecast for 2023. This has a one-off positive impact on EPRA Earnings of approximately 11 million euros (0.05 euros per share) for 2023, of which 9 million euros is for the first half of the year and 2 million euros is for the second half of 2023. This also resulted in a portfolio result in the order of 50 million euros (0.24 euros per share) due to the reversal of a deferred tax on investment properties.
1.6. EPRA Earnings
WDP EPRA Earnings for first half of 2023 amounts to 144.4 million euros. This result marks an increase of 26.0% compared to the result of 114.6 million euros in 2022. The EPRA Earnings per share are up 14.2% year-on-year to 0.71 euros, including an increase of 10.4% in the weighted average number of shares outstanding due to the strengthening of capital in 2022
Firstly, this increase in EPRA Earnings is related to the strong growth of the WDP portfolio in 2022-23 via pre-let projects in the Netherlands and Romania as well as the strong organic growth of rents via rent indexation. Secondly, the one-off positive impact on EPRA Earnings of approximately 9 million euros (0.04 euros per share) related to the reversal of the provision regarding the FBI status must be taken into account11. This strong profit growth is furthermore supported by debt being completely hedged, despite the sharp increase in Euribor interest rates
20 Press release – 28 July 2023
10 See the press release
3 July 2023. 11 See 1.5 Taxes
dated
1.7. Result on the portfolio (including the share of joint ventures) – Group share
The result on the portfolio (including the share of joint ventures and after tax) – Group share over first half of 2023 amounts to -89.6 million euros or -0.44 euros per share. For the same period last year, this result amounted to 210.9 million euros or 1.14 euro per share. This breaks down by country as follows: Belgium (-40.0 million euros), the Netherlands (-15.3 million euros), France (-9.6 million euros), Romania (-16.3 million euros), Germany (-0.1 million euros), and Sweden (-8.4 million euros).
The revaluation of the portfolio (excluding deferred taxes on the portfolio result and the result on sales of investment property) amounts to -141.7 million euros, down by -2.2% year-to-date (-54.7 million euros in Q2 2023). This is due to an upward yield shift of +27 bps (+12 bps in Q2 2023) in the existing portfolio in the discount rates applied by property experts, partly offset by the +3.5% increase in estimated market rent values in the first half of 2023 (+1.9% in Q2 2023). Currently, the portfolio is valued at an EPRA net initial yield of 5.2%.
1.8. Change in the fair value of financial instruments – Group share
Changes in the fair value of financial assets and liabilities – Group share 12amount to -20.8 million euros or -0.10 euros per share during first half of 2023 (compared to 133.5 million euros or 0.72 euros per share in 2022). This negative impact is due to the variation of the fair value of the concluded interest rate hedges (Interest Rate Swaps) due to the decline in long-term interest rates in the course of 2023.
This fair value variation has no impact on cash and is an unrealised item, so it is excluded from the financial result in the analytical presentation of results and presented separately in the profit and loss account.
1.9. Depreciation and write-down on solar panels (including share joint ventures) – Group share
The solar panels are valued on the balance sheet at fair value based on the revaluation model in accordance with IAS 16 Tangible fixed assets. In compliance with IAS 16, WDP must include a depreciation component in its IFRS accounts according to the residual service life of the solar panel parks. The depreciation is calculated based on the fair value from the previous balance sheet date. This newly calculated net book value is subsequently revalued at the fair value. This revaluation is booked directly in the equity capital insofar that it still exceeds the historical cost price, plus accumulated depreciations. If it does not, then it is accounted for in the profit and loss account. The depreciation component and write-down amounts to -4.5 million euros. Since this impact of the depreciation and amortisation of solar panels involves a non-cash and unrealised item, it is excluded from the operating result in the analytical presentation of the results and is shown separately in the profit and loss account.
1.10. Net result (IFRS) – Group share
The EPRA Earnings along with the result on the portfolio, changes in the fair value of financial instruments and the depreciation and write-down on solar panels produce a net result (IFRS) –
12 Changes in the fair value of financial assets and liabilities – Group share (a non-cash item) is calculated based on the mark-to-market (M-t-M) value of interest rate hedges concluded.
21 Press release – 28 July 2023
Group share of 29.5 million euros in the first half of 2023 (compared to the same period last year, when this figure was 455.7 million euros).
The difference between the net result (IFRS) – Group share of 29.5 million euros and the EPRA Earnings of 144.4 million euros can mainly be attributed to the negative revaluation of the portfolio and the negative fair value variations in the interest rate hedging instruments.
22 Press release – 28 July 2023
2. Notes to the balance sheet
Key ratios
The Alternative Performance Measures (APM), for example the EPRA key performance measures, used by WDP, are accompanied by a symbol (♦). Their definition and reconciliation can be consulted in the Annexes of this document.
1 Based on 100% of the fair value for the fully consolidated entities (including WDP Romania) and the proportionate share for the joint ventures (i.e. 55% for Luxembourg and 29% for WDPort of Ghent Big Box).
2 For the method used to calculate the gearing ratio, please refer to the Belgian Royal Decree on GVVs/SIRs.
23 Press release – 28 July 2023
Consolidated
(in euros x 1,000) 30.06.2023 31.12.2022 ∆ (abs.) ∆ (%) Intangible fixed assets 1,064 860 203 n.r. Investment property 6,367,248 6,351,916 15,332 0.2% Other tangible fixed assets (including solar panels) 162,482 166,351 -3,870 -2.3% Financial fixed assets 157,421 169,308 -11,887 -7.0% Trade receivables and other fixed assets 3,815 5,098 -1,282 -25.2% Participations in associated companies and joint ventures 281,523 296,973 -15,450 -5.2% Fixed assets 6,973,553 6,990,506 -16,953 -0.2% Assets held for sale 0 8,624 -8,624 n.r. Trade receivables 24,935 14,814 10,121 n.r. Tax receivables and other current assets 33,977 22,657 11,320 n.r. Cash and cash equivalents 14,016 8,040 5,976 n.r. Accruals and deferrals 13,026 9,206 3,820 n.r. Current assets 85,955 63,342 22,613 n.r. Total assets 7,059,508 7,053,848 5,660 0.1% (in euros x 1,000) 30.06.2023 31.12.2022 ∆ (abs.) ∆ (%) Capital 218,355 215,006 3,349 1.6% Issue premiums 1,733,411 1,660,132 73,279 4.4% Reserves 2,176,861 2,046,525 130,336 6.4% Net result for the financial year 29,550 351,711 -322,162 -91.6% Shareholders' equity attributable to Group shareholders 4,158,177 4,273,375 -115,198 -2.7% Minority interests 75,076 74,576 500 0.7% Shareholders' equity 4,233,254 4,347,951 -114,698 -2.6% Non-current financial debt 2,303,341 2,221,997 81,344 3.7% Other non-current liabilities 104,445 165,205 -60,761 -36.8% Non-current liabilities 2,407,785 2,387,202 20,583 0.9% Current financial debt 298,157 179,904 118,253 65.7% Other current liabilities 120,312 138,790 -18,478 -13.3% Current liabilities 418,469 318,694 99,774 31.3% Liabilities 2,826,254 2,705,896 120,358 4.4% Total liabilities 7,059,508 7,053,848 5,660 0.1%
balance sheet
(in euros per share) 30.06.2023 31.12.2022 ∆ (abs.) ∆ (%) IFRS NAV 20.1 20.9 -0.9 -4.2% EPRA NTA♦ 19.6 20.7 -1.1 -5.4% Share price 25.1 26.7 -1.6 -5.9% Premium/Discount with respect to EPRA NTA 28.2% 28.9% n.r. n.r. (in euros x million) Fair value of the portfolio (including solar panels)¹ 6,657.8 6,656.0 1.8 0.0% Loan-to-value♦ 38.3% 35.4% 2.9% n.r. Gearing ratio (proportional)²♦ 40.1% 37.6% 2.4% n.r. Net debt / EBITDA (adjusted)♦ 7.3x 7.1x 0.2x n.r.
2.1. Property portfolio
According to independent property experts Stadim, JLL, Cushman & Wakefield, CBRE and BNP Paribas Real Estate, the fair value13 of the WDP property portfolio as of 30 June 2023 according to IAS 40 amounted to 6,499.0 million euros, compared to 6,492.1 million euros at the start of the financial year (including Assets held for sale). Together with the valuation at fair value of the investments in solar panels 14 , the total portfolio value amounts to 6,657.8 million euros, compared to 6,656.0 million euros at the end of 2022
This value of 6,657.8 million euros includes 6,150.9 million euros in completed properties (standing portfolio).15 Ongoing projects represent a value of 154.5 million euros. In addition, there are the land reserves at Genk, Breda and Schiphol, and land potential in Romania, representing a fair value of 193.5 million euros.
The investments made in solar panels are valued at a fair value of 158.9 million euros per 30 June 2023
Overall, the portfolio is valued at a gross rental yield of 5.9%16. Currently, the portfolio is valued at an EPRA NIY of 5.2%. The reversion potential between the current contractual rent and market rental value is currently 9%
To date, there is sufficient interest and capital available for investment in logistics property given its solid long-term fundamentals. However, since the second half of 2022, the market is recalibrating to find an equilibrium on returns in the investment market based on the increased cost of capital. This process goes hand in hand with the evolution and expectations regarding the interest rate cycle. WDP currently expects the market to find a new equilibrium by the end of the year.
2.2. NAV per share
The EPRA NTA per share amounted to 19.6 euros as of 30 June 2023. This represents a decrease of -1.1 euros (-5.4%) against an EPRA NTA per share of 20.7 euro on 31 December 2022 due to EPRA Earnings generation (+0.70 euros), the distribution of the dividend (-1.00 euros) and the portfolio revaluation (including solar panels) (-0.80 euros) and other (-0.02 euros). IFRS NAV per share17 amounts to 20.1 euros as of 30 June 2023 compared to 20.9 euros as of 31 December 2022
13 For the exact valuation method, we refer to the BE-REIT press release of 10 November 2016.
14 Investments in solar panels are valued in accordance with IAS 16 by applying the revaluation model.
15 Including a right of use of 71 million euros, related to the land held through a concession in accordance with IFRS 16.
16 Calculated by dividing the annualised contractual gross (cash) rents and the rental value of the unlet parts by the fair value. The fair value is the value of the investment properties after deduction of transaction costs (mainly transfer tax).
17 The IFRS NAV is calculated as the equity capital as per IFRS divided by the total number of shares entitled to dividend on the balance sheet date. This is the net value according to Belgian GVV/SIR legislation.
24 Press release – 28 July 2023
5. Management of financial resources
38.3%
100% FINANCING NEEDS COVERED
✓ 100% refinancing covered for the next 24 months
✓ 100% committed
covered
✓ 100% commercial paper covered
Financial key figures

The Alternative Performance Measures (APM) used by WDP, are accompanied by a symbol (♦). Their definition and reconciliation can be consulted in the Annexes of this document.


1 Defined as operating result (before the result on the portfolio) divided by interest charges less interest and dividends collected less the fee for financial leasing and other.
2 Remaining term of debt at fixed rate and interest rate hedges entered into to hedge the debt against interest rate fluctuations.
25 Press release – 28 July 2023
30.06.2023 31.12.2022 Loan-to-value♦ 38.3 35.4 Gearing ratio (proportional) (in line with the GVV/SIR Royal Decree) (in %) 40.1 37.6 Net debt / EBITDA (adjusted) (in x)♦ 7.3 7.1 Interest Coverage Ratio (in x)¹ 6.4 5.9 Average cost of debt (in %)♦ 1.9 1.9 Average remaining term of outstanding debts (in years) 5.5 5.6 Hedge ratio (in %)♦ 106.9 97.4 Average remaining term of interest rate hedges (in years)² 6.1 6.6
capex
GEARING RATIO 7.3x Net debt / EBITDA (adjusted) 6.4x Interest Coverage Ratio LIQUIDITY ~ 1.5 Undrawn credit facilities billion euros MATURITY OF OUTSTANDING DEBTS 5.5 years 107% Debt maturity Hedge ratio GREEN FINANCING 1.9 billion euros LOAN-TO-VALUE
6.1 years Maturity of hedges 1.9% Cost of debt outstanding funding 71%
1. Debt structure
1.1. Financial position
Total financial debt (in accordance with IFRS) amounts to 2,601.5 million euros as of 30 June 2023, compared to 2,608.4 million euros in the same period last year. The loan-to-value as of 30 June 2023 is 38.3% versus 35.4% as of 31 December 2022, following the dividend payout in May 2023 and the portfolio revaluation.
As of 30 June 2023, the total undrawn and confirmed long-term credit lines are approximately 1.5 billion euros18. This provides WDP with ample funds to finance ongoing projects (313 million euros), planned energy projects (120 million euros), and financing maturing in the next 24 months (570 million euros), including a buffer to respond to market opportunities. This excludes expected cash flow through reserved profits and optional dividends (combined expected to amount to 161 million euros in 2023) and the refinancing of credit facilities.
Consolidated financial debt outstanding as of 30 June 2023
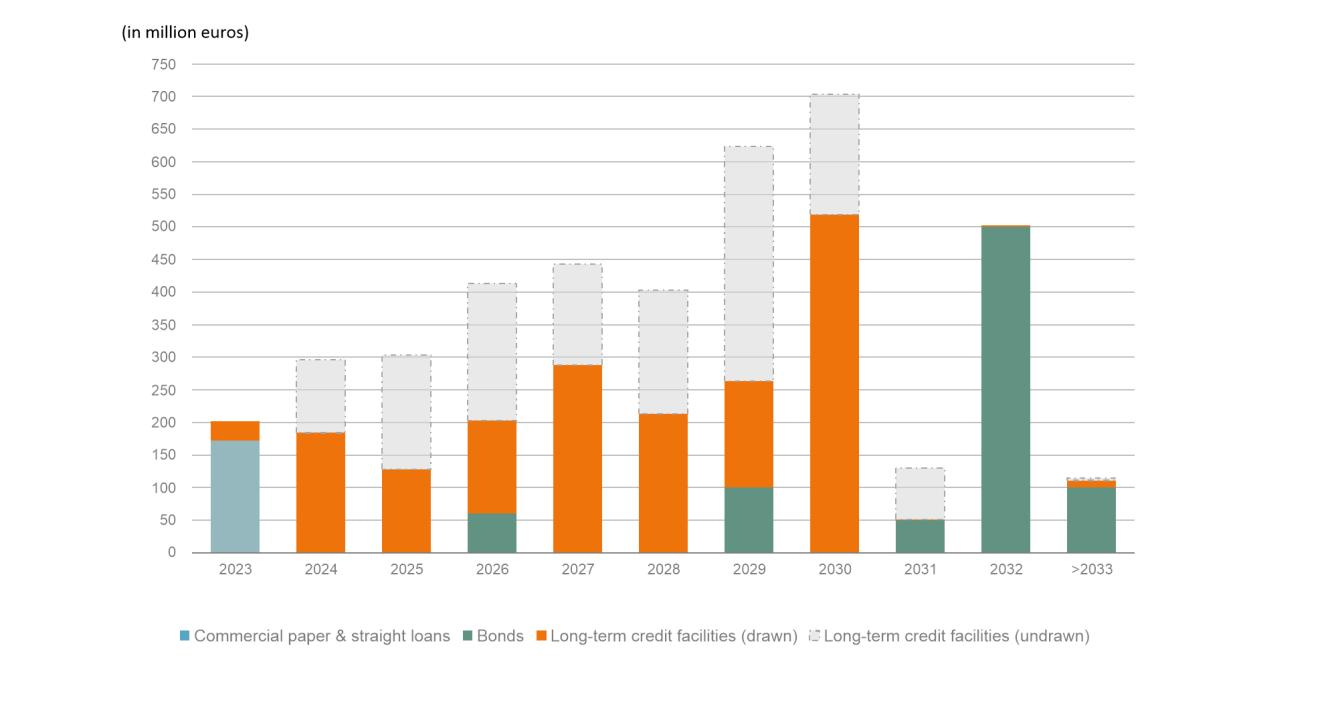
1.2. Maturity dates
The majority of the debt instruments used are bullet type instruments, which implies that over the term, interest are due on the principal sum and that full repayment of the capital is due on the final maturity date.
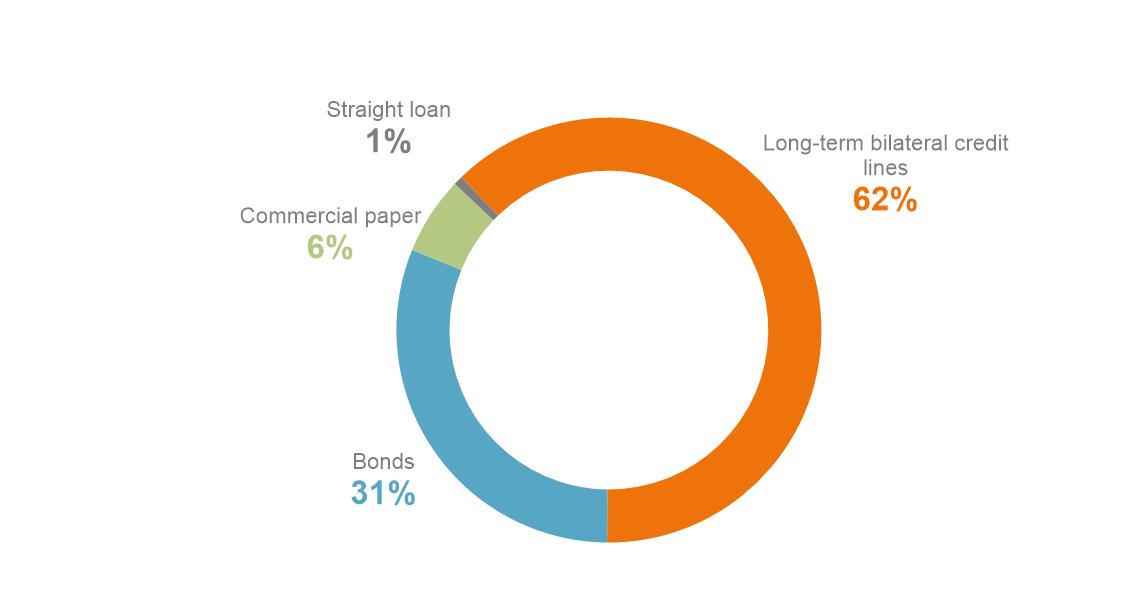
The maturity dates are evenly distributed over time. The current financial liabilities of 298.2 million euros include the commercial paper programme (154.4 million euros), short-term straight loans (17.9 million euros) and long-term financing maturing within the year (125.9 million euros).
The weighted average term of WDP’s outstanding financial debt as of 30 June 2023 was 5.5 years19 compared to years 5.6 at the end of 2022
18
19 Including short-term debts.
26 Press release – 28 July 2023
Excluding the credit facilities to hedge the commercial paper programme.
Credit maturity dates
1.3. Cost of debt and hedges
The average cost of debt was 1.9% in the first half of 2023 and is expected to remain below 2% during 2023. The Interest Coverage Ratio20 is equal to 6.4x for the same period, compared with 5.9x for the full financial year 2022
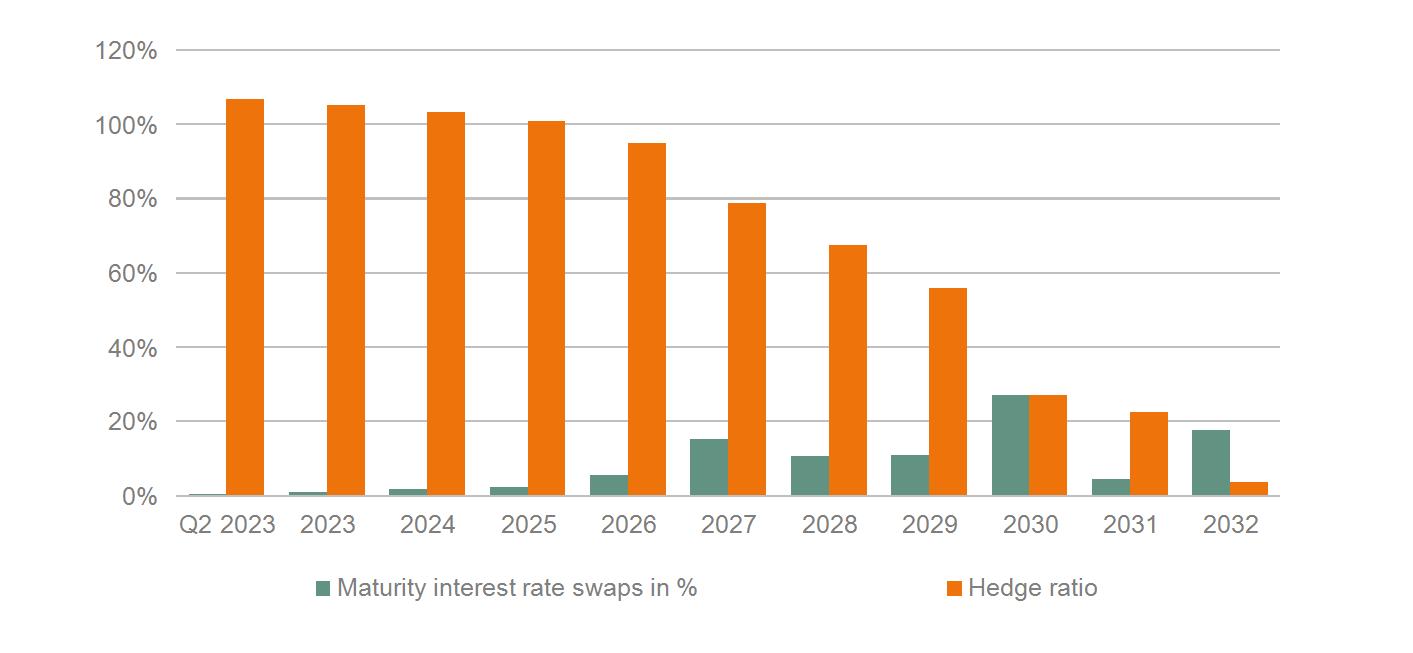
The hedge ratio, which measures the percentage of financial debt at a fixed rate or a floating interest rate and then hedged via Interest Rate Swaps (IRS’) is 107% with a weighted average hedge maturity of 6.1 years. This ratio temporarily exceeds 100% because of the drawdown of a fixed-rate loan early 2023 (as foreseen) that temporarily repaid (more expensive) floating-rate loans. During 2023, these will be drawn again to finance the ongoing projects and this ratio is expected to move back towards 100%.
27 Press release – 28 July 2023
20 Defined as the operating result (before the result on the portfolio), divided by interest rates, minus interest and dividend collection, minus compensation for financial leasing and others.
Hedge ratio evolution (at constant level of financial debt)
1.4. Financing strategy during 2023
1.4.1. New financial resources in 2023
• Optional dividend of approximately 77 million euros
WDP’s shareholders opted to contribute their dividend rights for approximately 54% of their shares in exchange for new shares instead of cash dividend payments. This result led to a capital increase for WDP of approximately 77 million euros through the creation of 3,137,703 new shares, taking into account an issue price of 24.50 euros per share.
1.5. Financial risks
In 2023, WDP has again continuously monitored the potential impact of financial risks and has taken the necessary measures to manage these risks. For a detailed overview of the financial and other risks, see 8. Risk factors
28 Press release – 28 July 2023
6. Property report
1. Review of the consolidated property portfolio
1.1. Condition of the portfolio as of 30 June 2023
The independent property experts Stadim, JLL, Cushman & Wakefield, CBRE, and BNP Paribas Real Estate value WDP’s property portfolio (including Assets held for sale and excluding solar panels) as of 30 June 2023 at a fair value21 of 6,499.0 million euros in accordance with IAS 40. The fair value at the end of 2022 amounted to 6,492.1 million euros.
The portfolio breaks down as follows:
Fair value
Geographical breakdown of the fair value of the portfolio
21 The fair value at which the investment properties are measured consists of the investment value less transaction costs. The average theoretical local transaction costs deducted from the investment value are as follows, by country: Belgium: 2.5%, The Netherlands: 10.4%, France: 6.9%, Luxembourg: 7.0%, Germany: 7.8% and Romania: 1.5%.
29 Press release – 28 July 2023
(in million euros) Belgium The Netherlands France Germany Luxembourg Romania Total Existing buildings 2,106.4 2,726.7 166.2 78.5 93.4 979.1 6,150.3 Projects under development 47.6 68.3 3.1 0.0 1.5 34.0 154.5 Land reserves 27.4 54.1 0.3 0.0 0.0 111.8 193.5 Assets held for sale 0.6 0.0 0.0 0.0 0.0 0.0 0.6 Total 2,181.9 2,849.0 169.6 78.5 94.9 1,124.9 6,499.0
Portfolio statistics by country
1 Financial performance indicator calculated according to EPRA's (European Public Real Estate Association) Best Practices Recommendations. Please see www.epra.com.
2 Excluding solar panels.
3 Calculated by dividing the annualised contractual gross (cash) rents and the rental value of the unlet properties by fair value. The fair value is the value of the property investments after deduction of transaction costs (mainly transfer tax).
Breakdown of the fair value of the portfolio per property expert
1 Including the proportionate share of the portfolio in I Love Hungaria NV and WDPort of Ghent Big Box NV.
1.2. Changes in fair value during the first half of 2023
In the first half of 2023, WDP invested a total of 10 million euros in new acquisitions. In addition, 115.7 million euros was spent on the completion of pre-let projects for own account and investments in the existing portfolio.
The variation in the valuation of the investment properties amounted to -141.7 million euros (+-2.2%) during the first half of 2023. This is mainly due to an upward yield shift of +27 bps in the existing portfolio
30 Press release – 28 July 2023
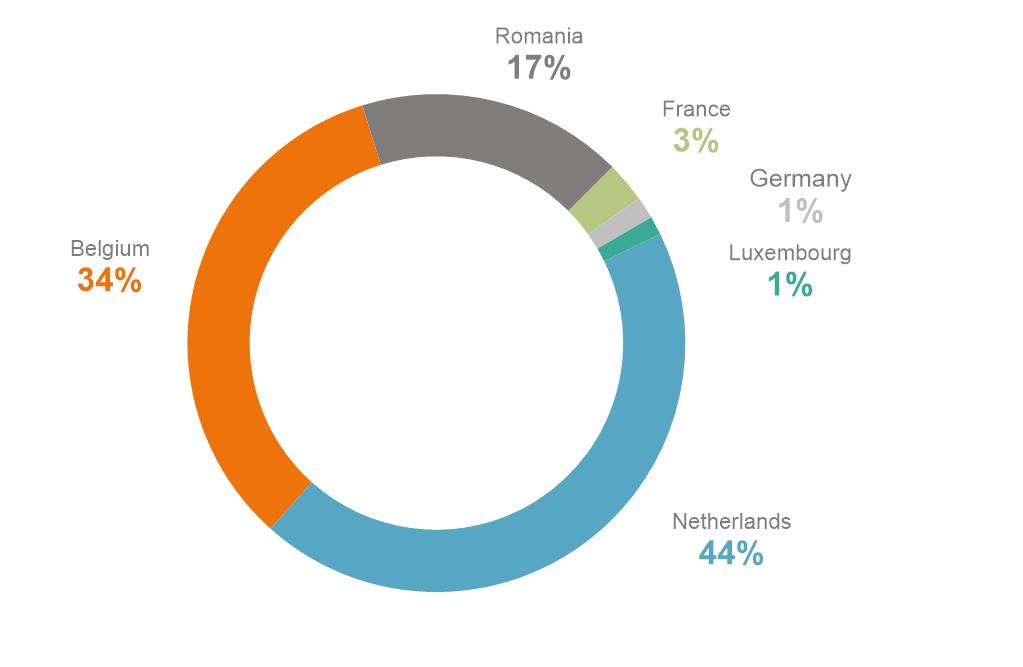
Belgium The Netherlands France Germany Luxembourg Romania Total Number of lettable sites 95 111 7 2 5 69 289 Gross lettable area (in m²) 2,303,065 2,859,869 192,500 60,590 70,270 1,559,579 7,045,873 Land (in m²) 4,463,273 4,989,525 467,237 112,796 116,797 6,877,132 17,026,759 Fair value (in million euros) 2,182 2,849 170 78 95 1,125 6,499 % of total fair value 34% 44% 3% 1% 1% 17% 100% % change in fair value (YTD) -1.8% -2.6% -5.6% -0.1% 0.6% -1.8% -2.2% Vacancy rate (EPRA)¹′² 1.6% 1.2% 0.9% 0.0% 1.2% 1.4% 1.4% Average lease length till break (in y)² 4.8 5.4 2.6 5.8 7.0 6.1 5.3 WDP gross initial yield³ 5.3% 5.9% 4.7% 4.6% 5.3% 7.6% 5.9% Effect of vacancies -0.1% -0.1% 0.0% 0.0% -0.1% -0.1% -0.1% Adjustment gross to net rental income (EPRA) -0.3% -0.4% -0.1% -0.1% -0.3% -0.1% -0.3% Adjustments for transfer taxes -0.1% -0.5% -0.3% -0.3% -0.3% -0.1% -0.3% EPRA net initial yield¹ 4.8% 4.9% 4.3% 4.1% 4.6% 7.2% 5.2%
Property expert Country Fair value in euros (x 1,000) Share of the portfolio Stadim Belgium¹ 1,193,387 18% Jones Lang LaSalle Belgium Belgium¹ 988,528 15% Cushman & Wakefield The Netherlands 1,727,391 27% CBRE Netherlands The Netherlands 1,121,652 17% BNP Paribas Real Estate France 169,636 3% CBRE Romania Romania 1,124,917 17% CBRE Germany Germany 78,494 1% Jones Lang LaSalle Luxembourg Luxembourg 94,948 1% Total 6,498,954 100%
in the discount rates applied by the property estimators, which is partly compensated by the +3.5% increase in estimated market rent value in the first half of 2023. The gross rental yield based on the contractual rent, after the addition of the estimated market rent value for the unlet parts, amounts to 5.9%% as of 30 June 2023, compared to 5.7% at the end of 2022.
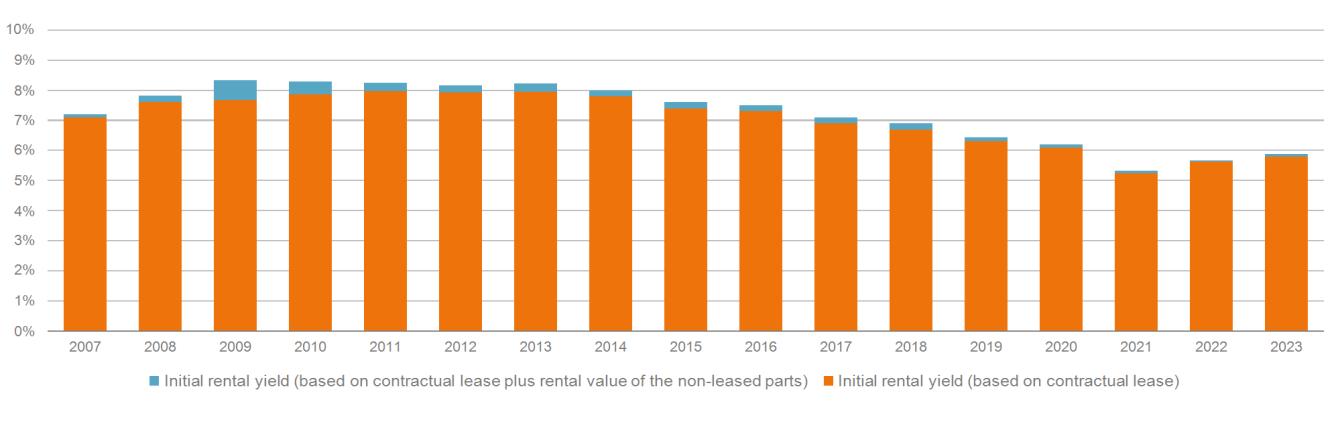
Historic gross rental yield of the WDP portfolio
1.3. Value and composition of the rental portfolio
The total surface area comprises 1,702.7 hectares, including 116.8 hectares granted in concession. The average land value is 116 euros per m², excluding transaction costs. This area also includes land reserves, particularly in Belgium, the Netherlands and Romania.
Designated use as of 30 June 2023
31 Press release – 28 July 2023
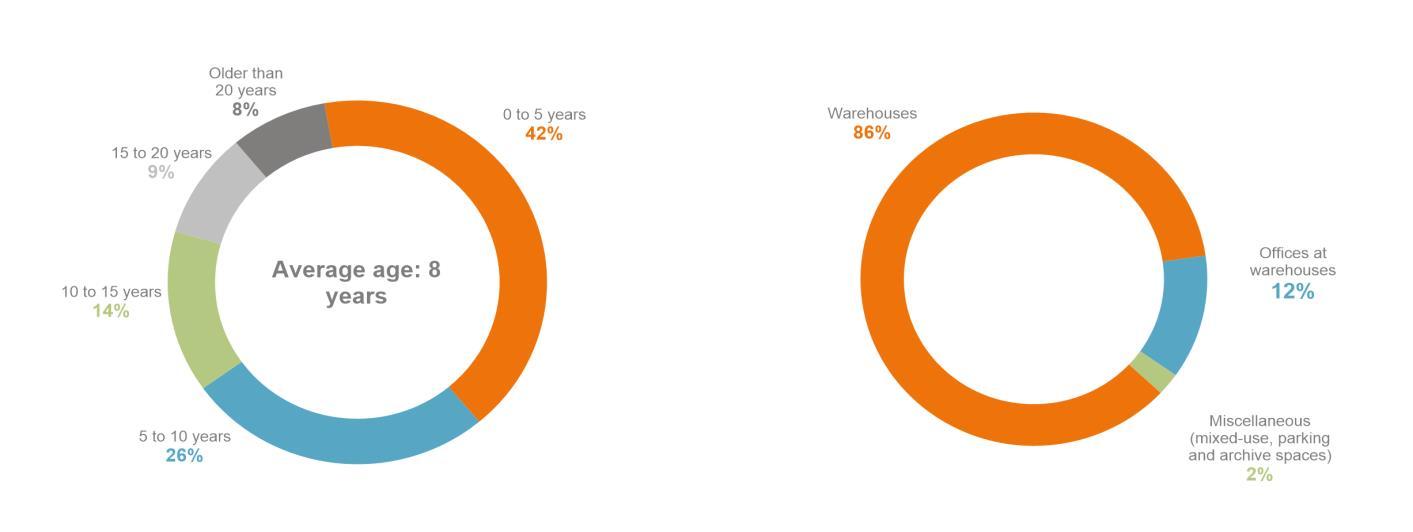
Built surface (in m²) Estimated rental value (in million euros) Estimated average rental value per m² (in euros) % of total rental value Warehouses 6,213,185 329.7 53.1 86% Offices at warehouses 460,153 46.3 100.5 12% Miscellaneous 372,535 8.4 22.5 2% Total 7,045,873 384.4 54.6 100%
Breakdown of fair value by age22
Breakdown of total rental value by intended use
Breakdown of property portfolio (based on fair value) by property quality categorisation23
Breakdown of property portfolio (based on fair value) by property type
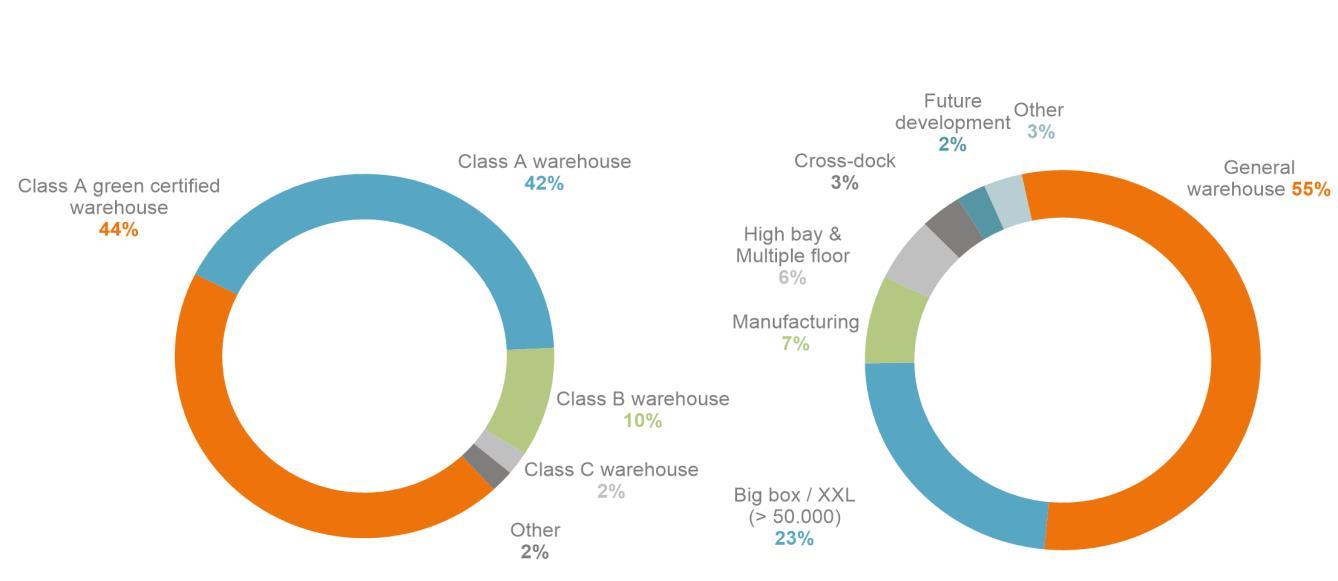
51% Urban logistics properties are General warehouse or Cross-dock buildings that are close to large, densely populated consumer areas and can offer quick delivery times.

22Buildings that have undergone significant renovations are considered new once their renovations are complete.
23Class A green-certified warehouse refers to the Class A BREEAM and Class A EDGE certified buildings within the WDP property portfolio.
Press release – 28 July 2023
32
1.4. Rental situation of the available buildings
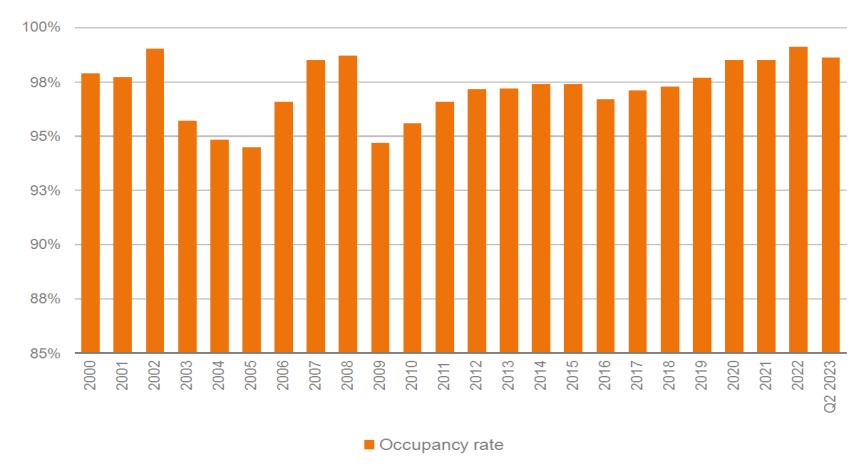
The occupancy rate of the WDP portfolio is at 98.6% as of 30 June 2023. This represents the outcome of WDP’s commercial strategy, which is aimed at developing long-term relationships with customers and supports the company’s performance with a high operating margin.
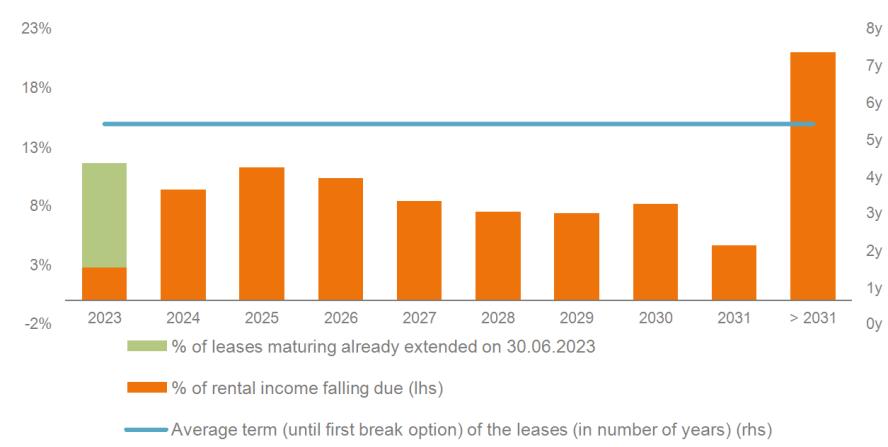
The development of long-term partnerships with customers is further reflected in the fact that the average remaining maturity date of the leases is 6.7 years. Assuming the first option of termination, the average remaining duration is 5.4 years.
Rental income expiry dates (until the first option of termination)
33 Press release – 28 July 2023
Historical occupancy rate of the WDP portfolio
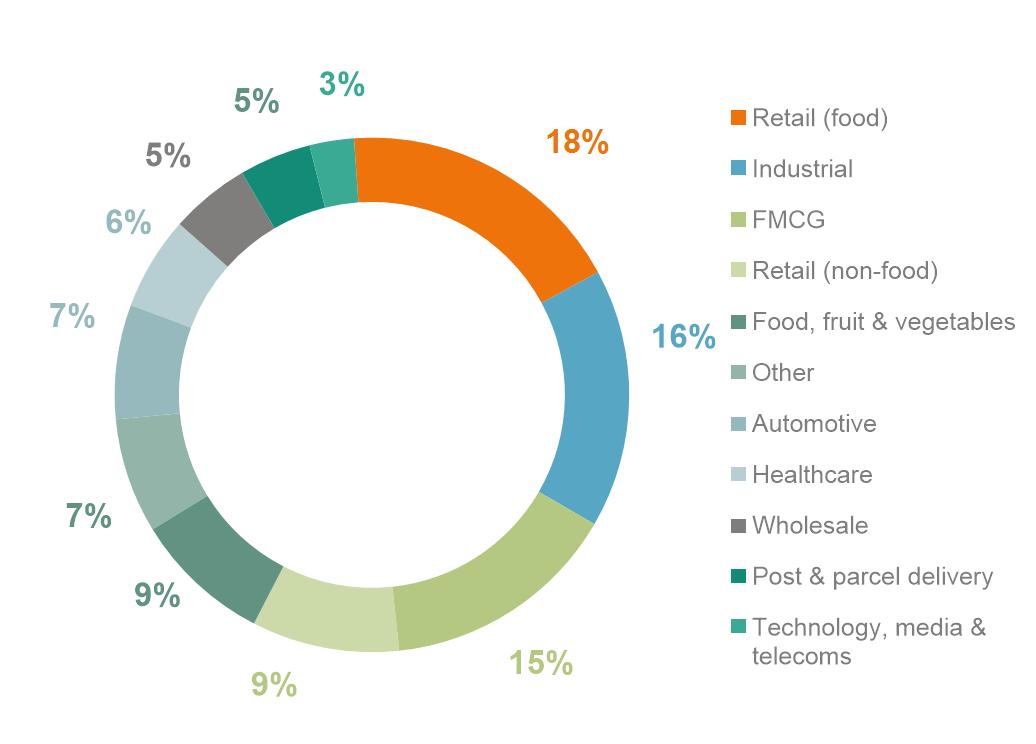
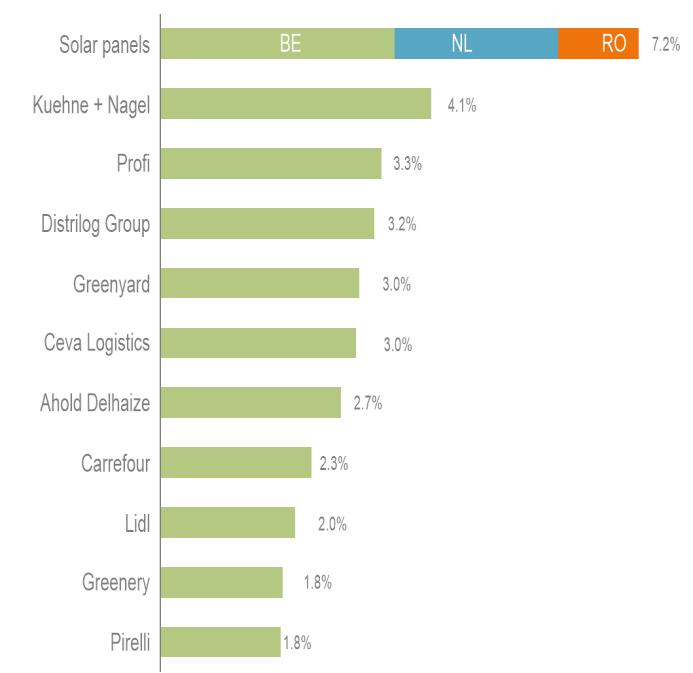
Top-10 tenants (excluding solar panels ~27%)

-commerce 15%

60%
1.5. Overview of ongoing projects
For a complete overview of ongoing projects as of 30 June 2023, refer to 2.3 Ongoing projects in Chapter 2. Performance.
1.6. Review of the logistics property market
1.6.1. Belgium and Luxembourg
After the limited 12% decline in demand for logistics and industrial real estate in Belgium and Luxembourg through 2022, the first quarter of 2023 also started quietly with approximately 330,000 m²
34 Press release – 28 July 2023
2023 rental income by tenant category Dedicated
3PL 40%
End user
being put into use. This is in line with the changed market conditions due to high market volatility and inflation, a weakening macroeconomic outlook, the sharply increased cost of capital, and persistent scarcity. The demand for real estate for omnichannel operations normalised after the above-average growth during the pandemic. The share of directly available space remains extremely low (only 1.2%), especially in the Antwerp-Brussels region. During 2023-24, approximately 950,000 m² of new construction projects are under development of which 85% are pre-let – this percentage will perpetuate the low level of availability. Rent levels are under continued pressure due to historically low availability rates and limited available land holdings impeding the development of new logistics property, combined with persistent but normalised demand. Top rental prices are rising to 70 euros per m² per year in Brussels and to 58 euros per m² per year on the Antwerp-Brussels axis – and are expected to increase by 8% in 2023. Compared to the start of this year, we see an increase in prime yields by 30 basis points to approximately 4.7%. This increase is mainly due to the sharply increased cost of capital and sharply reduced liquidity in the property market. The changed price expectation that has led to a significantly lower number of transactions in the investment market is gradually resulting in a new equilibrium between return and risk where a balancing act is underway between buyer and seller. Awareness of climate issues - with increasing importance for ESG - and increased interest rates as well as high building costs and inflation are some of the factors that will continue to influence the demand for logistics property in 2023.
Demand for logistics and industrial property is experiencing a significant decline – take-up fell by approximately 50% year-on-year. This decline is due to a persistent lack of immediately available quality real estate, the scarcity of new land combined with restrictive government policy, limited capacity on the electricity grid and increased macroeconomic uncertainty. The logistics sector remains fundamentally sound despite the temporary cyclical impact due to the uncertain macroeconomic environment. Thus the prospect of a significant short-term increase is extremely limited: 70% of the current development pipeline of 2.7 million m² is pre-let against an average annual take-up of over 2.6 million m². This is reflected in a historically low vacancy rate of approximately 1.5%. Due to the low supply, rents are expected to increase 5% to 10% by 2023. Prime yields are around 4.6%. Sustainability and efficient land use will only gain importance, which will only further increase interest in brownfields.
The logistics property market can expect the take-up of logistics property in the first quarter of 2023 to be approximately 930,000 m2 – a 24% decrease compared to the same period the previous year. Although momentum here seems to be weakening – partly due to increased macroeconomic uncertainty but also due to the scarcity of land – demand remains in line with the 10-year average takeup level. Combined with a limited increase in speculative developments, the average vacancy rate continued to decline further throughout the first quarter to 3.2% for the entire country with a total available space of 1.7 million m2 – a decrease of over 21% compared to the same period a year earlier. The prime yield is around 4.3%. At a national level, rent levels per m2 are increasing by approximately 8% and this trend is expected to continue in locations subject to scarcity.
35 Press release – 28 July 2023
1.6.2. The Netherlands
1.6.3. France
1.6.4. Romania
The Romanian logistics and industrial property market recorded a strong take-up of 310,000 m2 through the first quarter of 2023, i.e. a 20% increase compared to the same period last year. This demand is primarily located in western and north-western Romania as well as in the capital Bucharest (35%). Over 50% of the buildings were occupied by logistics service providers. About 170,000 m2 of logistics property was completed through the first quarter of 2023. This brings the total surface area of logistics and industrial real estate in Romania to 6.9 million m². With a development pipeline of more than 400,000 m², the total surface area is projected to reach 7.3 million m2 by 2023. The continued demand for modern logistics space, combined with above-average demand and limited delivery of new developments, keeps the average vacancy rate historically low at 4.7% for the entire country. In Bucharest, the vacancy rate is 5.7%. On average, rent levels rose to 4.25 euros per m2
1.6.5. Germany
The German logistics and industrial property market was unable to continue its 2022 momentum at the start of 2023 – take-up fell year-on-year by 65% to 0.9 million m2. Besides the current slowdown and increased macroeconomic uncertainty, the persistent scarcity and normalised demand due to omnichannel activities are inhibiting total demand. Compared to the same period last year, take-up by omnichannelactivities fell by 80%, which in turn was offset by an increase in take-up by logistics service providers (+15%). The persistent scarcity caused the top rents in the top five German regions (notably Berlin, Düsseldorf, Rhine-Maine, Hamburg and Munich) to increase by 13% to 6.9 euros per m² per month. Regions with more available plots are expected to gain market share. The assumption is that further inflation of rent levels will continue due to limited availability, increasing building costs, inflation, and the manufacturing industry recovery. The focus on sustainability is also becoming more prominent. Due to a lack of available building plots, brownfield (re)developments are increasingly being used.
Sources: WDP Research and estate agent reports
36 Press release – 28 July 2023
7. Outlook
1. Outlook 2023
WDP recently announced24 an increase in projected EPRA Earnings per share for 2023 from 1.35 to 1.40 euros, up +12% year-on-year (previously +8%). This 0.05 euros per share increase is due to a reversal of a provision booked in 2021 and 2022, which had been forecast for 2023 based on the uncertainty with respect to the FBI status and for which there is now greater clarity. Based on this outlook, a dividend per share of 1.12 euros gross is forecast for 2023 (payable in 2024), allowing for a comparable increase and a low pay-out rate of 80%.
Underlying assumptions
• Portfolio growth in 2022-23 primarily through new pre-let development projects.
• Organic growth of 5% based on the indexation clauses in the leases.
• A minimal average occupancy rate of 98% and stable client payment behaviour.
• As a result of the corporate tax assessment received as an FBI for 2021, WDP currently expects that the FBI regime will also apply for the financial years 2022 to 2024 and will lapse thereafter. The provision that was booked in 2021 and 2022 and that was forecast for 2023 will be reversed. This has a one-off positive impact on EPRA Earnings of approximately 11 million euros (0.05 euros per share) for 2023. For 2025, the ambitions of the 2022-25 growth plan take into account the plans of the Dutch government to exclude real estate investments from the Dutch FBI regime from 1 January 2025 via a legislative amendment.
• A loan-to-value that – based on the current valuation of the portfolio – is below 40% and has an average cost of debt around 2%.
37 Press release – 28 July 2023
24 See the press release dated 3 July 2023 and 1.4 Taxes in Chapter 4 Financial results.
2. Growth plan 2022-25
This four-year plan aspires to achieve an annual increase in EPRA Earnings per share of +8% to 1.50 euros in 2025.25 The dividend per share is expected to evolve synchronously towards 1.20 euros in 2025. In 2022, a strong progression of 13% in EPRA Earnings per share to 1.25 euros was already observed. For 2023, WDP expects EPRA Earnings per share to rise 12% to 1.40 euros, which includes the one-off positive effect due to the FBI changes (0.05 euros per share).
GROWTH
FOR FUTURE
WDP remains focused on the long-term profit target in its growth plan and remains alert and vigilant to achieve that goal. WDP remains focused on its objective of achieving EPRA Earnings per share of 1.50 euros by 2025 through increased focus on profitability of new projects, organic growth (mainly through rent indexation) and the accelerated rollout of WDP ENERGY, while maintaining a solid financial balance sheet. This is expected to lead to an increasing contribution of organic growth and energy projects versus external growth.
To this end, WDP relies on an inflation-resistant cash flow profile thanks to indexation clauses in the leases combined with rising market rents. For example, in 2023, WDP expects a positive impact on rents of +5% driven by the indexation of contracts. Moreover, the cost of debt is fully hedged for an average term of 6.1 years.


The logistics property sector remains fundamentally sound given the crucial role of logistics within the economy for various industries (both on the inbound and outbound sides of the supply chain), despite a cyclical decline in demand and a cautious customer decision strategy due to the weak macroeconomic outlook. Nevertheless, the upward pressure on market rents is further supported by limited availability (vacancy in the market <5% in all regions where WDP operates) and scarcity of land.
Since Q4 2022, WDP has seen a high level of stabilisation for both construction prices and longer delivery times for new projects and, currently, the first signs of downward price pressure. For the new projects, WDP is charging higher rents. However, achieving the targeted returns remains a challenge for each individual project. For the projects identified during the first half of 2023 (85 million euros), WDP was able to align the investments with the profitability requirements based on the changed economic parameters, such as the increased cost of capital. In doing so, WDP expects to generate an initial gross return of approximately 7%.
This 2023 outlook and the 2022-25 growth plan targets are based on current knowledge and situation and notwithstanding unforeseen circumstances due to the evolution of external factors, such as the macroeconomic outlook, high market volatility and a sharply increased cost of capital
38 Press release – 28 July 2023
25 For 2025, the ambitions of the 2022-25 growth plan take into account the plans of the Dutch government to exclude real estate investments from the Dutch FBI regime from 1 January 2025 via a legislative amendment.
8. Risk factors
WDP’s management and Board of Directors confirm the validity of the risks the Company may face and their potential impact, as described in the WDP Annual Report 2022
Concerning the REIT status risk, more specifically the Regulatory risks related to non-compliance and loss of REIT status, reference is made to the Update on policy regarding FBI status in the Netherlands in which the company reports that it has received the corporation tax assessment for financial year 2021 as an FBI (and has therefore met the conditions as an FBI for 2021). And that it expects that the FBI regime will also apply to financial years 2022, 2023 and 2024 and will lapse thereafter. Namely, due to the Dutch government’s plans to exclude real estate investments from the Dutch FBI regime from 1 January 2025 via a legislative amendment. For more information on the impact, see 1.10 Net result (IFRS) - Group share in Chapter 4. Financial results.
39 Press release – 28 July 2023
9. Interim financial statements
1. Condensed consolidated financial statements for the first half of 2023
Condensed consolidated profit and loss account
40 Press release – 28 July 2023
in euros (x 1,000) Notes H1 2023 FY 2022 H1 2022 Rental income VII 163,683 293,250 141,860 Costs related to leases -343 -310 -276 Net rental result IV 163,340 292,940 141,584 Recovery of property costs 0 0 0 Recovery of rental charges and taxes normally paid by the tenant on let properties 27,388 37,403 25,039 Costs payable by tenants and paid out by the owner for rental damage and refurbishment at end of lease 0 0 0 Rental charges and taxes normally paid by the tenant on let properties -31,984 -41,575 -29,324 Other income and charges related to leases 14,590 30,856 16,494 Property result IV 173,335 319,624 153,793 Technical costs -4,230 -6,600 -3,054 Commercial costs -935 -1,567 -719 Property management costs -2,116 -3,480 -2,232 Property charges IV -7,281 -11,647 -6,005 Property operating results IV 166,053 307,977 147,787 General Company expenses -8,330 -16,136 -7,014 Other operating income and expenses (depreciation and write-down on solar panels) -4,533 -7,255 -3,250 Operating result (before the result on the portfolio) 153,190 284,586 137,523 Result on disposals of investment properties -1,504 519 -55 Variations in the fair value of investment properties VIII -137,174 -157,754 247,398 Operating result IV 14,512 127,351 384,866 Financial income 433 437 204 Net interest charges -19,380 -42,042 -20,088 Other financial charges -1,542 -1,844 -887 Change in the fair value of financial instruments -20,355 220,091 130,047 Financial result -40,844 176,642 109,276 Share in the result of associated companies and joint ventures -6,358 38,645 26,169 Result before taxes -32,690 342,638 520,311 Taxes XI 63,198 20,815 -56,576 Net result 30,508 363,453 463,735 Attributable to: Minority interests 958 11,742 7,998 Shareholders of the Group 29,550 351,711 455,737 Weighted average number of shares 204,743,120 189,421,171 185,517,102 Net result per share (in euros) 0.14 1.86 2.46 Diluted net result per share (in euros) 0.14 1.86 2.46
Condensed consolidated statement of the overall result in euros (x 1,000)
balance of changes in fair value of authorised hedging
subject to hedge accounting as defined by IFRS
41 Press release – 28 July 2023
H1 2023 H1 2022 I. Net result 30,508 463,735 II. Other elements of the overall result (recoverable through profit and loss) -17,819 119,077 G. Other elements of the comprehensive result, after tax -17,819 119,077 Revaluation on solar panels -8,434 16,851 Currency translation differences linked to conversion of foreign activities -13,388 -9,023 Reserve
instruments
4,002 111,249 Comprehensive result 12,688 582,811 Attributable to: - Minority interests 500 7,992 - Shareholders of the Group 12,188 574,819
for the
(+/-)
Components of the net result
1 Including deferred taxes on portfolio result.
2 Calculated on the weighted average number of shares.
1 Including deferred taxes on portfolio result.
2 Calculated on the weighted average number of shares.
42 Press release – 28 July 2023
in euros (x 1,000) H1 2023 H1 2022 EPRA Earnings 144,399 114,602 Result on the portfolio (including share joint ventures) - Group share¹ -89,601 210,873 Change in the fair value of financial instruments – Group share -20,796 133,473 Depreciation and write-down on solar panels (including share joint ventures) - Group share -4,452 -3,211 Net result (IFRS) - Group share 29,550 455,737 in euros (per share)² H1 2023 H1 2022 EPRA Earnings 0.71 0.62 Result on the portfolio (including share joint ventures) - Group share¹ -0.44 1.14 Change in the fair value of financial instruments – Group share -0.10 0.72 Depreciation and write-down on solar panels (including share joint ventures) - Group share -0.02 -0.02 Net result (IFRS) - Group share 0.14 2.46
in euros (per share) (diluted)² H1 2023 H1 2022 EPRA Earnings 0.71 0.62 Result on the portfolio (including share joint ventures) - Group share¹ -0.44 1.14 Change in the fair value of financial instruments – Group share -0.10 0.72 Depreciation and write-down on solar panels (including share joint ventures) - Group share -0.02 -0.02 Net result (IFRS) - Group share 0.14 2.46
43 Press release – 28 July 2023 Balance sheet (in euros x 1,000) Notes 30.06.2023 31.12.2022 30.06.2022 Fixed assets 6,973,553 6,990,506 6,860,806 Intangible fixed assets 1,064 860 862 Investment property VIII 6,367,248 6,351,916 6,284,846 Other tangible fixed assets (including solar panels) 162,482 166,351 185,145 Financial fixed assets X 157,421 169,308 83,843 Trade receivables and other fixed assets X 3,815 5,098 5,411 Participations in associated companies and joint ventures 281,523 296,973 300,697 Current assets 85,955 63,342 148,029 Assets held for sale 0 8,624 10 Trade receivables X 24,935 14,814 19,891 Tax receivables and other current assets X 33,977 22,657 105,111 Cash and cash equivalents X 14,016 8,040 11,119 Accruals and deferrals X 13,026 9,206 11,898 Total assets 7,059,508 7,053,848 7,008,834 (in euros x 1,000) Notes 30.06.2023 31.12.2022 30.06.2022 Shareholders' equity 4,233,254 4,347,951 4,048,614 I. Shareholders' equity attributable to the parent company shareholders 4,158,177 4,273,375 3,976,977 Capital 218,355 215,006 198,406 Issue premiums 1,733,411 1,660,132 1,259,818 Reserves 2,176,861 2,046,525 2,063,016 Net result for the financial year 29,550 351,711 455,737 II. Minority interests 75,076 74,576 71,637 Liabilities 2,826,254 2,705,896 2,960,221 I. Non-current liabilities 2,407,785 2,387,202 2,461,669 Provisions 160 160 160 Non-current financial debt X, IX 2,303,341 2,221,997 2,215,798 Other non-current financial liabilities X 52,235 52,359 52,648 Trade payables and other non-current liabilities 5,501 5,143 4,645 Deferred taxes - liabilities XI 46,549 107,544 188,417 II. Current liabilities 418,469 318,694 498,552 Current financial debt IX 298,157 179,904 392,563 Other current financial liabilities X 183 183 183 Trade payables and other current debts X 68,030 88,572 71,387 Other current liabilities 7,833 9,158 7,556 Accrued charges and deferred income X 44,265 40,877 26,862 Total liabilities 7,059,508 7,053,848 7,008,834
with 54% of the shareholders opting for payout of the dividend
44 Press release – 28 July 2023 Cash flow statement in euros (x 1,000) H1 2023 H1 2022 Cash and cash equivalents, opening balance 8,040 9,230 Net cash flows concerning operating activities 110,335 217,917 Net result 30,508 463,735 Taxes¹ -63,198 56,576 Net interest charges 19,380 20,088 Financial income -433 -204 Gain(-)/loss (+) on disposals 1,504 55 Cash flows from operating activities before adjustment of non-monetary items, working capital and interest paid -12,239 540,249 Variations in the fair value of financial derivatives 20,355 -130,047 Variations in the fair value of investment properties 137,174 -247,398 Depreciations and write-downs (addition/reversal) on fixed assets 5,417 905 Share in the result of associated companies and joint ventures 6,358 -26,169 Other adjustments for non-monetary items -8,340 4,085 Adjustments for non-monetary items 160,964 -398,623 Increase (-)/decrease (+) in working capital -38,390 76,290 Net cash flows concerning investment activities -162,360 -420,156 Investments -163,444 -186,221 Payments regarding acquisitions of real estate investments -151,066 -184,788 Payments for acquisitions of shares in real estate companies 0 0 Purchase of other tangible and intangible fixed assets -12,379 -1,433 Disposals 8,097 466 Receipts from the disposal of investment properties 8,097 466 Investments in and financing provided to companies not fully controlled -7,013 -234,401 Investments in and financing provided to entities not fully controlled -12,413 -235,367 Repayment of financing provided to entities not fully controlled 5,400 966 Net cash flows concerning financing activities 58,001 204,128 Loan acquisition 730,507 1,061,309 Loan repayment -528,149 -659,398 Dividends paid² -127,346 -163,620 Capital increase 0 0 Interest paid -18,570 -35,610 Dividends received 1,558 1,447 Net increase (+)/decrease (-) in cash and cash equivalents 5,976 1,889 Cash and cash equivalents, closing balance 14,016 11,119
1 Including the deferred taxes on the investment portfolio as well as the deferred income tax.
2 This is only the cash-out: after all, in 2023 an optional dividend was offered,
in shares instead of cash.
Condensed consolidated statement of changes in the equity capital
Changes in the fair value of solar panels Capital as a result of optional dividend Dividends distributed
increase
Impact of (pre-) heding instruments Other 30.06.2023 Total equity capital 4,347,951 0 30,508 -8,434 0 76,635 -203,980 4,002 -13,428 4,233,254 Minority interests 74,576 958 -458 75,076 Total equity capital attributable to shareholders of the Group 4,273,375 0 29,550 -7,976 0 76,635 -203,980 4,002 -13,428 4,158,177 Subscribed capital 215,006 3,356 -7 218,355 Issue premiums 1,660,132 73,279 1,733,411 Reserves 2,046,525 351,711 -7,976 -203,980 4,002 -13,421 2,176,861 Net result for the period 351,711 -351,711 29,550 29,550 in euros (x 1.000) 01.01.2022
Allocation of result from the 2021 financial year Capital
Net result for the first half year optional dividend Dividends distributed
45 Press release – 28
July 2023
in euros (x 1.000) 01.01.2023
Allocation of result from the 2022 financial year increases
Net result for the first half year Capital
Changes in the fair value of solar panels Capital increases Impact of (pre-) heding instruments Other 30.06.2022 Total shareholders' equity 3,573,992 0 463,735 16,851 0 0 -163,620 111,249 -9,174 4,058,614 Minority interests 63,662 7,998 -6 -17 71,637 Total shareholders' equity attributable to shareholders of the Group 3,510,330 0 455,737 16,857 65,580 0 -163,620 111,249 -9,157 3,986,977 Subscribed capital 196,378 2,028 198,406 Issue premiums 1,206,266 63,552 1,269,818 Reserves 1,125,420 982,266 16,857 -163,620 111,249 -9,157 2,063,016 Net result for the period 982,266 -982,266 455,737 455,737
increase as a result of
2. Explanatory notes
I. General information on the Company
WDP is a publicly regulated real estate company and has the form of an NV/SA under Belgian law. Its registered office is at Blakebergen 15, 1861 Wolvertem (Belgium). The phone number is +32 (0)52 338 400.
The interim condensed financial statements of the Company as of 30 June 2023 include the Company and its subsidiaries.
WDP is listed on Euronext Brussels and Amsterdam.
II. Basis of presentation
The condensed interim financial statements are drawn up in accordance with the International Financial Reporting Standards (IFRS) as adopted by the European Union and with the legal and regulatory requirements applicable in Belgium. These standards include all new and revised standards and interpretations issued by the International Accounting Standards Board (IASB) and the International Financial Reporting Interpretations Committee (IFRIC) that apply to the Group’s activities and are effective for financial years beginning on or after 1 January 2023.
The condensed interim financial statements are presented in thousands of euros, rounded to the nearest thousand. The 2022 and 2023 financial years are shown in this document. For historical financial information for the 2021 financial year, please refer to the annual reports for 2022 and 2021.
Accounting methods were consistently applied to the financial years shown.
Standards and interpretations applicable for the annual period beginning on or after 1 January 2023
Insofar as these new standard, amendments to standards and interpretations are relevant to WDP, it is indicated below whether they affect the consolidated financial statements.
• IFRS 17 Insurance Contracts
• Amendments to IFRS 17 Insurance contracts: Initial Application of IFRS 17 and IFRS 9 – Comparative Information
• Amendments to IAS 1 Presentation of Financial Statements and IFRS Practice Statement 2: Disclosure of Accounting Policies
• Amendments to IAS 8 Accounting policies, Changes in Accounting Estimates and Errors: Definition of Accounting Estimates
• Amendments to IAS 12 Income Taxes: Deferred Tax related to Assets and Liabilities arising from a Single Transaction
• Amendments to IAS 12 Income taxes: International Tax Reform – Pillar Two Model Rules (effective immediately but not yet endorsed in the EU – disclosures are required for annual periods beginning on or after 1 January 2023)
Standards and interpretations published, but not yet applicable for the annual period beginning on 1 January 2023
46 Press release – 28 July 2023
A number of new standards, amendments to standards and interpretations were not yet in force in 2023, but could have been applied earlier. Unless stated otherwise, WDP has not yet adopted these.
• Amendments to IAS 1 Presentation of Financial Statements: Classification of Liabilities as Current or Non-current and Non-current Liabilities with Covenants (applicable for annual periods beginning on or after 1 January 2024, but not yet endorsed in the EU)
• Amendments to IFRS 16 Leases: Lease Liability in a Sale and Leaseback (applicable for annual periods beginning on or after 1 January 2024, but not yet endorsed in the EU)
• Amendments to IAS 7 Statement of Cash Flows and IFRS 7 Financial Instruments: Disclosures: Supplier Finance Arrangements (applicable for annual periods beginning on or after 1 January 2024, but not yet endorsed in the EU)
III. Significant accounting estimates and key uncertainties affecting estimates
WDP’s management and Board of Directors confirm that the significant accounting estimates and key uncertainties, as described in the WDP Annual Report 2022 are still up-to-date.
47 Press release – 28 July 2023
IV. Segmented information – Operating result
48 Press release – 28 July 2023
in euros (x 1,000) H1 2023 Belgium The Netherlands France Germany Romania Unallocated amounts Total IFRS Luxembourg² Other joint ventures² I. Rental income 50,251 72,740 3,856 1,767 35,069 0 163,683 2,075 221 III. Costs related to leases -276 323 -185 -15 -191 0 -343 0 -4 Net rental result 49,975 73,063 3,671 1,753 34,878 0 163,340 2,075 217 IV. Recovery of property costs 0 0 0 0 0 0 0 0 0 V. Recovery of rental charges normally paid by the tenant on let properties 10,245 1,832 1,831 65 13,415 0 27,388 252 60 VI. Costs payable by tenants and paid out by the owner for rental damage and refurbishment at end of lease 0 0 0 0 0 0 0 0 0 VII. Rental charges and taxes normally paid by the tenant on let properties -10,470 -6,056 -1,852 -58 -13,547 0 -31,984 -252 -60 VIII. Other income and charges related to leases¹ 8,511 4,725 69 39 1,246 0 14,590 222 3 Property result 58,261 73,564 3,719 1,799 35,992 0 173,335 2,297 220 IX. Technical costs -1,363 -2,093 -35 -55 -685 0 -4,230 -15 82 X. Commercial costs -943 148 -8 -80 -52 0 -935 -1 -1 XII. Property management costs -1,543 -345 -13 -2 -213 0 -2,116 -9 0 Property charges -3,849 -2,290 -56 -137 -950 0 -7,281 -25 80 Property operating results 54,413 71,274 3,663 1,661 35,042 0 166,053 2,272 300 XIV. General company expenses 0 0 0 0 0 -8,330 -8,330 -191 -88 XV. Other operating income and expenses (depreciation and write-down on solar panels) -2,101 -1,482 0 0 -950 0 -4,533 -61 0 Operating result (before result on the portfolio) 52,311 69,792 3,663 1,661 34,092 -8,330 153,190 2,020 212 XVI. Result on disposals of investment properties -1,507 0 3 0 0 0 -1,504 0 0 XVIII. Variations in the fair value of investment properties -34,513 -72,744 -9,565 -85 -20,267 0 -137,174 590 -5,120 Operating result 16,291 -2,952 -5,899 1,577 13,825 -8,330 14,512 2,610 -4,908
1 In the first year half 2023, income from solar energy totalled 12.347 million euros against 11.685 million euros in the first half year 2022. This income was generated in Belgium (5.910 million euros), the Netherlands (4.542 million euros) and Romania (1.894 million euros). The joint ventures WDPort of Ghent Big Box and WDP Luxembourg generated 0.041 million euros and 0.179 million euros in the first half of the year 203. In addition to the income from solar energy, the property management fees and other operating income/costs are part of the Other income and charges related to leases.
2 The joint ventures are incorporated using the equity accounting method, as per IFRS 11 Joint arrangements. The table shows the operating result (before overhead expenses and based on the proportionate share of WDP) and then gives the reconciliation with the proportionate share in the results of these entities, as reported under the equity accounting method as per IFRS. WDP Deutschland GmbH was until 30th of June 2022 a joint venture.
The basis for reporting per segment is the geographical region. This segmentation basis reflects the geographical markets in Europe in which WDP is active. WDP’s activity is divided into six regions. More information about which subsidiaries are located within the geographical regions can be found in the group structure, see explanatory note VI. Information on subsidiaries
This segmentation is important for WDP given that the nature of its business, its customers, etc. represent similar economic characteristics within these segments. Business decisions are taken at this level and different key performance indicators (such as rental income, occupancy rates, etc.) are monitored in this manner.
A second segmenting basis is not considered relevant by WDP as the business mainly focuses on the leasing of logistics sites.
49 Press release – 28 July 2023
in euros (x 1,000) H1 2022 Belgium The Netherlands France Romania Unallocated amounts Total IFRS Luxembourg² Germany² Other joint ventures² I. Rental income 43,944 64,718 3,636 29,563 0 141,860 1,586 462 0 III. Costs related to leases 60 166 -208 -295 0 -276 -5 0 0 Net rental result 44,005 64,883 3,428 29,268 0 141,584 1,581 462 0 IV. Recovery of property costs 0 0 0 0 0 0 0 0 0 V. Recovery of rental charges normally paid by the tenant on let properties 8,930 1,960 1,293 12,856 0 25,039 125 0 0 VI. Costs payable by tenants and paid out by the owner for rental damage and refurbishment at end of lease 0 0 0 0 0 0 0 0 0 VII. Rental charges and taxes normally paid by the tenant on let properties -9,361 -5,595 -1,354 -13,014 0 -29,324 -93 0 0 VIII. Other income and charges related to leases¹ 12,431 1,925 68 2,070 0 16,494 2 0 0 Property result 56,004 63,173 3,435 31,180 0 153,793 1,615 462 0 IX. Technical costs -1,394 -1,394 -36 -230 0 -3,054 -28 -23 4 X. Commercial costs -597 92 -32 -182 0 -719 -1 -107 0 XII. Property management costs -1,612 -266 -4 -348 0 -2,232 -3 0 0 Property charges -3,603 -1,568 -71 -760 0 -6,005 -31 -130 4 Property operating results 52,401 61,605 3,364 30,420 0 147,787 1,584 332 4 XIV. General company expenses 0 0 0 0 -7,014 -7,014 -231 -18 -33 XV. Other operating income and expenses (depreciation and write-down on solar panels) -1,779 -1,214 0 -257 0 -3,250 1 0 0 Operating result (before result on the portfolio) 50,622 60,391 3,364 30,163 -7,014 137,523 1,354 315 -29 XVI. Result on disposals of investment properties -23 -31 0 0 0 -55 0 0 0 XVIII. Variations in the fair value of investment properties 61,616 142,559 5,469 37,754 0 247,398 1,759 14,560 3,409 Operating result 112,214 202,919 8,833 67,917 -7,014 384,866 3,113 14,875 3,379
V. Segmented information – Assets
50 Press release – 28 July 2023
31.12.2022 in euros (x 1,000) Belgium The Netherlands France Germany Romania Total IFRS Luxembourg Other joint ventures Investment properties 2,138,317 2,847,453 178,736 78,579 1,108,831 6,351,916 89,462 41,831 Existing buildings 2,076,518 2,606,047 175,352 78,579 934,838 5,871,334 73,520 40,195 Projects under development for own account 30,332 187,327 0 0 62,336 279,994 15,942 1,637 Land reserves 31,468 54,079 3,385 0 111,657 200,588 0 0 Assets held for sale 8,624 0 0 0 0 8,624 0 314 Other tangible fixed assets 68,185 72,246 0 2 25,918 166,351 3,269 478 Tangible fixed assets for own use 2,742 55 0 2 2,916 5,715 0 478 Other: solar panels 65,443 72,191 0 0 23,002 160,636 3,269 0 30.06.2023 in euros (x 1,000) Belgium The Netherlands France Germany Romania Total IFRS Luxembourg Other joint ventures Investment properties 2,145,156 2,849,044 169,636 78,499 1,124,913 6,367,248 94,948 36,187 Existing buildings 2,071,361 2,726,651 166,240 78,499 979,098 6,021,848 93,408 35,075 Projects under development for own account 46,438 68,314 3,103 0 34,026 151,881 1,540 1,112 Land reserves 27,357 54,079 293 0 111,789 193,519 0 0 Assets held for sale 0 0 0 0 0 0 0 572 Other tangible fixed assets 68,337 70,147 0 2 23,996 162,482 3,252 543 Tangible fixed assets for own use 4,459 53 0 2 2,350 6,864 0 543 Other: solar panels 63,878 70,094 0 0 21,646 155,618 3,252 0
VI. Information on subsidiaries
1 WDP Development NL N.V. was founded in August 2011 as a permanent development company for own account of WDP Nederland N.V.
2 WDP Services NL B.V. was created in June 2023 and is a 100% subsidiary of WDP Nederland NV.
3 On 7 June 2013 WDP acquired 100% of the shares in Eurologistik 1 Freehold BVBA, holding the rights to an existing logistic site in Vilvoorde.
4 As part of the streamlining of the Group and its foreign non-REIT participations, the shares of WDP Romania SRL and WDP Luxembourg SA held by WDP NV/SA were contributed to WDP Invest NV/SA on 22 December 2020 by way of capital increase by contribution in kind. WDP Invest acts as an autonomous investment and financing vehicle for the international activities of the Group as from the aforementioned date.
5 At the beginning of March 2022, WDP acquired through a contribution in kind 100% of the shares of Sigmo NV, which ownes three sites in Dendermonde. This transaction is not considerated as a business combination. On 28 April 2023, WDP merged with its full subsidiary Sigmo SA.
6 This is a joint venture founded in May of 2015 between WDP NV/SA and project developer L.I.F.E. NV/SA with a view to redevelopment of the Hungaria building in Leuven.
7 The joint venture was set up in December 2020 between WDP NV/SA and the co-shareholders Sakolaki and Vendis Capital (shareholders of Exterioo, Juntoo and X²O Badkamers), in view of the expansion of the WDPort of Ghent that will be leased by these retailers.
8 The joint venture was set up in June 2023 between WDP NV/SA and the co-shareholder Warehousing & Warehouse Related Services Belgium NV/SA in the context of real estate transactions.
9 WDP and energy proptech company nanoGrid (founded by Joost Desmedt) cemented their partnership with a 25%+1 stake int the last quarter of 2021. The consolidated result before tax of nanoGrid BV amounts to 0,15% of the consolidated result before tax of WDP NV. The consolidated assets of nanoGrid
BV amounts to 0,03% of the consolidated assets of WDP NV.
10 This is a joint venture, of which the Luxembourg government owns 45% and of which WDP acquired 55% of the shares on 13 October 2017.
11 On the 18th of December 2019 WDP NV/SA bought, through its fully subsidiary WDP Invest NV/SA, a participation in of 50% in WVI Gmbh, a joint venture with VIB Vermögen. From July 2022, WVI GmbH is a 100% subsidiary of WDP Invest NV, forming WDP Deutschland GmbH. This transaction is not deemed to be a business combination.
12 At the beginning of April 2022, WDP and Catena AB realized a stategic partnership. Joost Uwents was appointed as a director on Catena's Board of Directors at Catena's annual General Meeting.
51 Press release – 28 July 2023
30.06.2023 31.12.2022 Name % Ownership % Voting rights Method of consolidation % Ownership WDP NV Parent company Parent company WDP France SARL 100% 100% Full Consolidation 100% WDP Nederland N.V. 100% 100% Full Consolidation 100% WDP Development NL N.V.¹ 100% 100% Full Consolidation 100% WDP Services NL B.V.² 100% 100% Full Consolidation Eurologistik 1 Freehold BVBA³ 100% 100% Full Consolidation 100% WDP Invest NV/SA⁴ 100% 100% Full Consolidation 100% Sigmo NV/SA⁵ 100% WDP Romania SRL⁴ 85% 85% Full Consolidation 85% I Love Hungaria NV/SA⁶ 50% 50% Equity method 50% WDPort of Ghent Big Box NV/SA⁷ 29% 29% Equity method 29% Gosselin-WDP NV/SA⁸ 29% 29% Equity method nanoGrid BV⁹ 25%+1 25%+1 Equity method 25%+1 WDP Luxembourg SA¹⁰ 55% 55% Equity method 55% WDP Deutschland GmbH¹¹ 100% 100% Full Consolidation 100% Catena AB¹² 10% 10% Equity method 10%
The
full address of the registered office of the subsidiaries is available at https://www.wdp.eu/groupstructure
VII. Overview of future income
Future rental income (including income from solar energy)
This table contains an overview of the rental yield (including the income from solar energy) under the current agreements. It is based on the indexed rents received up to and including the maturity date, as set out in the leases.
52 Press release – 28 July 2023
in euros (x 1,000) 30.06.2023 31.12.2022
less than one year 356,632 331,469 one to five years 1,019,584 961,384 more than five years 853,878 814,790 Total 2,230,094 2,107,643
VIII. Investment properties26
53 Press release – 28 July 2023
30.06.2023 in euros (x 1,000) Belgium Netherlands France Germany Romania Total IFRS Luxembourg Other joint ventures Level according to IFRS 3 3 3 3 3 3 3 Fair value as at previous financial year-end 2,138,317 2,847,453 178,736 78,579 1,108,831 6,351,916 89,455 41,831 Investments 41,352 74,335 465 5 29,722 145,880 4,904 0 New acquisitions 0 0 0 0 6,626 6,626 0 0 Acquisition of investment properties by means of sharebased payment transactions 0 0 0 0 0 0 0 0 Investment properties from associated companies and jont ventures that became a wholly owned subsidiary during the financial year 0 0 0 0 0 0 0 0 Transfers to fixed assets held for sale 0 0 0 0 0 0 0 -251 Disposals 0 0 0 0 0 0 0 -273 Changes in the fair value -34,513 -72,744 -9,565 -85 -20,267 -137,174 590 -5,120 Fair value as at 30.06.2023 2,145,156 2,849,044 169,636 78,499 1,124,913 6,367,248 94,948 36,187 31.12.2022 in euros (x 1,000) Belgium Netherlands France Germany Romania Total IFRS Luxembourg Germany Other joint ventures Level according to IFRS 3 3 3 3 3 3 3 3 Fair value as at previous financial year-end 1,887,799 2,817,726 175,208 0 914,509 5,795,243 67,680 23,947 6,896 Investments 35,792 236,645 713 5,106 115,758 394,014 12,637 6,658 20,394 New acquisitions 7,226 13,984 0 0 45,865 67,075 0 0 8,633 Acquisition of investment properties by means of sharebased payment transactions 179,226 0 0 0 0 179,226 0 0 0 Investment properties from associated companies and joint ventures that became a wholly owned subsidiary during the financial year 0 0 0 90,330 90,330 0 -45,165 0 Transfers to fixed assets held for sale -8,624 0 0 0 0 -8,624 0 0 0 Disposals 0 -1,193 0 0 -6,401 -7,594 0 0 -858 Changes in the fair value 36,898 -219,709 2,815 -16,857 39,100 -157,754 9,138 14,560 6,766 Fair value as at 31.12.2022 2,138,317 2,847,453 178,736 78,579 1,108,831 6,351,916 89,455 0 41,831 26 Including project developments in accordance with IAS 40.
IX. Statement of financial debt
54 Press release – 28 July 2023
Included as of < 1 year 1-5 years > 5 years in euros (x 1,000) 30.06.2023 31.12.2022 30.06.2023 31.12.2022 30.06.2023 31.12.2022 30.06.2023 31.12.2022 Commercial paper 154,350 168,850 154,350 168,850 Straight loans 17,944 10,204 17,944 10,204 Roll over loans 125,730 719 125,730 719 Bond loan 0 0 0 0 Other 132 132 132 132 Current financial liabilities 298,157 179,904 298,157 179,904 Roll over loans 1,496,024 1,414,793 868,498 937,130 627,526 477,663 Bond loan 807,034 806,855 59,913 59,897 747,121 746,958 Other 283 349 283 349 0 0 Non-current financial liabilities 2,303,341 2,221,997 928,694 997,376 1,374,647 1,224,621 Total 2,601,498 2,401,901 298,157 179,904 928,694 997,376 1,374,647 1,224,621
X. Financial instruments
55 Press release – 28 July 2023
30.06.2023 in euros (x 1,000) IFRS balance sheet section Level (IFRS) Financial assets/ liabilities valuated at fair value Financial assets/ liabilities at amortised cost Book value Fair value Financial assets Assets at fair value through result – Permitted hedging instruments Interest Rate Swap I. E. 2 150,104 150,104 150,104 Financial assets at amortised costs I. E. 2 7,317 7,317 7,317 Long-term receivables Trade receivables and other noncurrent assets I. G. 2 3,815 3,815 3,815 Short-term receivables Trade receivables II. D. 2 24,935 24,935 24,935 Pre-hedge Interest Rate Swap II. E. 2 422 422 422 Cash and cash equivalents II. F. 2 14,016 14,016 14,016 Accruals and deferrals on the assets: interest charges on loans and permitted hedging instruments Interest on loans 2 907 907 907 Interest on permitted hedging instruments 2 1,147 1,147 1,147 Total 151,673 50,992 202,664 202,664 Financial liabilities Non-current financial debt Bond loan: private placement I. B. 2 807,034 807,034 704,932 Bank debt I. B. 2 1,496,024 1,496,024 1,434,505 Other non-current financial debt I. B. 2 283 283 283 Other non-current financial liabilities Permitted hedging instruments: Interest Rate Swaps I. C. 2 0 0 0 Other non-current financial liabilities I. C. 3 52,235 52,235 52,235 Current financial debt Bond loan: private placement II. B. 0 0 0 Commercial paper II. B. 2 154,350 154,350 154,350 Bank debt II. B. 2 143,675 143,675 143,675 Other current financial debt II. B. 2 132 132 132 Other current financial liabilities Permitted hedging instruments: Interest Rate Swaps II. C. 2 0 0 0 Other current financial liabilities II. C. 3 183 183 183 Trade payables and other current debts II. D. 2 68,030 68,030 68,030 Accruals and deferrals on the liabilities: interest charges on loans and permitted hedging instruments Interest on loans 2 14,833 14,833 14,833 Interest on permitted hedging instruments 2 0 0 0 Total 0 2,736,779 2,736,779 2,573,157
31.12.2022
56 Press release – 28 July 2023
in euros (x 1,000) IFRS balance sheet section Level (IFRS) Financial assets/ liabilities valuated at fair value Financial assets/ liabilities at amortised cost Book value Fair value Financial assets Assets at fair value through result – Permitted hedging instruments Interest Rate Swap I. E. 2 162,196 162,196 162,196 Financial assets at amortised costs I. E. 2 7,112 7,112 7,112 Long-term receivables Trade receivables and other noncurrent assets I. G. 2 5,098 5,098 5,098 Short-term receivables Trade receivables II. D. 2 14,814 14,814 14,814 Cash and cash equivalents II. F. 2 8,040 8,040 8,040 Accruals and deferrals on the assets: interest charges on loans and permitted hedging instruments Interest on loans 2 402 402 402 Interest on permitted hedging instruments 2 0 0 0 Total 162,196 35,465 197,662 197,662 Financial liabilities Non-current financial debt Bond loan: private placement I. B. 2 806,855 806,855 694,539 Bank debt I. B. 2 1,414,793 1,414,793 1,346,126 Other non-current financial liabilities Permitted hedging instruments: Interest Rate Swaps I.C. 2 0 0 0 Other non-current financial liabilities I.C. 3 52,333 52,333 52,333 Current financial debt Bond loan: private placement I. B. 2 0 0 0 Commercial paper II. B. 2 168,850 168,850 168,850 Bank debt II. B. 2 10,922 10,922 10,922 Other current financial debt II. B. 2 132 132 132 Other current financial liabilities Other current financial liabilities II.C. 3 183 183 183 Trade payables and other current debts II.D. 2 88,572 88,572 88,572 Accruals and deferrals on the liabilities: interest charges on loans and permitted hedging instruments Interest on loans 2 8,633 8,633 8,633 Interest on permitted hedging instruments 2 0 0 0 Total 0 2,551,621 2,551,621 2,370,638
Valuation of financial instruments
The entirety of the financial instruments of the Group corresponds to levels 1, 2 and 3 in the hierarchy of the fair values. Valuation against fair value occurs regularly.
In the event of bankruptcy of one of both contracting parties, the net position of the derivatives will be considered for the counterparty.
Level 1 in the hierarchy of fair values excludes money investments, funds, and cash equivalents regarding which the fair value is based on the share price.
Level 2 in the hierarchy of fair values concerns the other financial assets and liabilities of which the fair value is based on observable inputs and other data that can be determined, directly or indirectly, for the assets or liabilities concerned. The valuation techniques concerning the fair value of the financial instruments at level 2 are as follows: the fair value of the above financial assets and liabilities are valued at the book value, except for bond loans, where fair value is determined under a discounted cash flow model based on market interest rates since they are not traded frequently (level 2). Because the other financial liabilities are incurred at a floating interest rate, the fair value is very close to the book value.
Level 3 in the fair value hierarchy retains the property portfolio and financial liabilities recognised in accordance with IFRS 16 whose fair value is determined using non-observable inputs.
Financial instruments at fair value (as per IFRS 9)
The Group uses derivative financial instruments to hedge the interest rate risk on its financial debts to reduce the volatility of EPRA Earnings (which forms the basis for the dividend) while minimising the cost of debt. These hedges are managed centrally through a macro-hedging policy. The Group does not use derivative financial instruments for speculative purposes and does not hold derivatives for trading purposes.
Changes in the fair value of derivatives that do not qualify as hedges are recognised immediately in profit or loss. Changes in the fair value of derivatives allocated specifically to hedge the variability of cash flows of a recognised asset or liability or a forecast transaction are recognised in the section Other components in the overall result.
In January 2022, the Group entered into two pre-hedges (interest rate swaps) for a total nominal amount of 500 million euros each, which enable the Group to convert the variable interest rate for its expected future debt issues into a fixed interest rate. When the debt was issued (the placement of 500 million euros of green bonds through US private placement27 and the syndicated loan of 440 million euros28, the pre-hedges were settled, and their fair value was settled in cash at that time.
The group has determined that these financial instruments meet the conditions for hedge accounting. These instruments are initially recognised at fair value on the date the derivatives hedging interest rate risk are entered into and then measured at their fair value on subsequent closing dates. The pre-hedges were viewed as hedging instruments in a cash flow hedge relationship of a highly probable expected future transaction (issuance of debt), changes in the fair value of the pre-hedges are recognised under Other Components of the overall result for the
57 Press release – 28 July 2023
27 See the press release dated 14 April 2022. 28 See the press release dated 28 November 2022.
period until settlement of the pre-hedges. This positive value will be distributed over the profit and loss over the life of the loans issued. Since the terms of these pre-hedges are consistent with the characteristics of the debt issued and the pre-hedges were settled on or around the date of issuance of the debt, these hedges are considered efficient.
The contracts are valued at fair value as per IFRS 9 on the balance sheet date. This information is received from the various financial institutions and verified by WDP by discounting the future contractual cash flows based on the corresponding interest rate curves.
Fair value is based on observable inputs, and as such, the IRS contracts fall under level 2 in the fair value hierarchy as defined in IFRS. The fair value is calculated based on a discounted cash flow model using the relevant market interest rates indicated in the forward interest curve on the balance sheet date.
No changes in the fair value hierarchy level took place in first half of 2023. During this period, no hedging instruments were arranged before the maturity date.
XI. Taxes
When preparing the income statement as of 1 January 2021 and also within the outlook of the growth plan 2022-25, a situation where WDP could not continue to qualify as FBI in the Netherlands was taken into account, due to the significant uncertainty with respect to the tax ruling that was withdrawn as of 1 January 2021, as explained earlier.
As a result of the recently received corporation tax assessment for the 2021 accounting year of WDP Nederland (see XIII. Significant events after the balance sheet date), WDP concludes that the company continues to meet all conditions under the current legislative framework.
For further explanation on the impact on the result and guidance for 2023 we refer to chapter 4. Financial results and chapter 7. Outlook
XII. Rights and obligations not recognised in the balance sheet
58 Press release – 28 July 2023
30.06.2023 Classification according to IFRS Level (IFRS) Notional amount in euros (x 1,000) Interest rate (in %) Duration (in year) Interest Rate Swap 2 1,757,425 0.62 5.3 Total 1,757,425 0.62 5.3 31.12.2022 Classification according to IFRS Level (IFRS) Notional amount in euros (x 1,000) Interest rate (in %) Duration (in year) Interest Rate Swap 2 1,317,425 0.77 5.4 Interest Rate Swap (forward start) 2 440,000 0.18 7.0 Total 1,757,425 0.62 5.8
WDP NV/SA and its subsidiaries had bank guarantees in place for a total of 4,535,009 euros as of 30 June 2023, the beneficiaries of which fall under the following categories for the following amounts:
WDP has entered into various commitments as a part of its ongoing investment programme related to projects and acquisitions, as indicated in 1. Operating activities in Chapter 2. Performance.
Parent company WDP NV/SA has extended the following sureties for its various subsidiaries:
• A surety agreement for WDP Luxembourg SA’s commitments of 29 million euros in favour of Banque et Caisse d’Epargne de l’Etat.
• A guarantee as security for the commitments of Gosselin-WDP NV/SA for 10 million euros in favour of KBC Bank NV.
The WDP financing agreements include the following covenants:
• An Interest Coverage of at least 1.5x. For the first half of 2023, this is 6.4x.
• A statutory and consolidated gearing ratio below 65% is in line with the GVV/SIR Law. As of 30 June 2023, these are 39.8% and 40.1% respectively.
• Limitation on projects that have still not been pre-let (speculative developments) to 15% of the book value of the portfolio (excluding land reserves). As of 30 June 2023, this ratio is 0.01%.
• A maximum of 30% of the financial debts with the subsidiaries compared to the financial debts of the group. As of 30 June 2023, this ratio is 2.1%.
WDP has entered into the following commitments with financiers29:
• Commitment not to burden the assets with collateral, such as mortgages (negative pledge). WDP confirms that as of 30 June 2023, no mortgages or other collateral securities are outstanding in the property portfolio or other assets.
• A commitment that it will continue to qualify as a GVV/SIR. For the conditions on this, please see the Belgian Act of 12 May 2014 and the Royal Decree of 13 July 2014. For more information, see the WDP Annual Report 2022
• For some financiers, WDP has agreed to repay the credit if a change of control occurs and the financier consequently asks for repayment.
59 Press release – 28 July 2023
in euros 30.06.2023 Environmental 1,355,831 Rent and concession 3,171,199 Services 7,979
29 The term ‘financiers’ means the credit institutions as well as financiers through debt capital markets, such as bondholders or investors in the commercial paper programme.
As of 30 June 2023, all covenants with financiers and commitments entered into by WDP have been complied with.
XIII. Significant events after the balance sheet date
On 3 July 2023, WDP Nederland received its corporation tax assessment for the 2021 accounting year, following the previous submission of its tax return under the Dutch FBI regime. This confirms that the company has met all the requirements set for FBIs for the 2021 accounting year.
On that basis, and with the facts and circumstances remaining unchanged for the time being, WDP concludes that the company continues to meet all conditions under the current legislative framework. At present, WDP expects that the Dutch FBI regime will remain applicable for the 2022, 2023 and 2024 accounting years before lapsing, given the Dutch government’s intention to exclude real estate from the Dutch FBI regime as of 1 January 2025 through a legislative amendment.
For further explanation on the impact on the result and guidance for 2023 we refer to chapter 4. Financial results and chapter 7. Outlook.
60 Press release – 28 July 2023
10. Appendices
1. External assurance
1.1. Conclusions of the property experts
Dear,
We are pleased to present you with our estimate of the value of the property portfolio of WDP NV as of 30 June 2023.
WDP appointed us as independent property experts to determine the fair value of its property portfolio. Estimates were made taking into account both the observations and definitions mentioned in the reports, and the guidelines of the International Valuation Standards issued by the IVSC.
The fair value is defined in standard IAS 40 as the amount for which the property could be exchanged between knowledgeable, willing parties in an arm's length transaction. IVSC deems these conditions to be met if the above-mentioned definition of fair value is respected. The fair value must reflect the current lease contracts, the reasonable assumptions relating to potential rental income and the expected costs.
As property experts, we possess relevant and recognized credentials as well as up-to-date experience with properties of a type and location similar to those of the properties in WDP's property portfolio. In giving an estimate of the properties, we took into account both the current rental agreements and all rights and obligations arising from these agreements. Each property was valuated separately. The estimates do not account for any potential capital gain that might be realized by offering the portfolio on the market in its entirety. Our estimates also do not account for marketing costs specific to a transaction, such as estate agents' fees or publicity costs. In addition to an annual inspection of these properties, our estimates are also based on the information provided by WDP regarding the rental situation, surface areas, sketches or plans, rental charges and taxes associated with each property concerned, compliance and environmental pollution. The information provided was deemed accurate and complete. Our estimates assume that undisclosed items are not such that they would affect the value of the property.
Each independent property expert is responsible for valuing the part of the portfolio that was contractually assigned to him or her.
Based on the above statements, we can confirm that the fair value of the property portfolio of WDP (excluding solar panels but including assets held for sale) on 30th of June 2023 amounted to 6,498,954,261 euros (six billion four hundred ninety-eight million nine hundred fifty-four thousand two hundred sixty-one euros)30
Yours faithfully,
Nicolas Janssens
30 This value equals the sum of the fair value that is confirmed by the individual property experts, as detailed in chapter 6 Property report
61 Press release – 28 July 2023
Partner | Stadim
Greet Hex
Head of Valuations Belux, Value & Risk Advisory | Jones Lang LaSalle Belgium
Willem Rodermond
Executive Director | CBRE Netherlands
Kristiaan Engelman
Partner Valuations & Advisory – The Netherlands | Cushman & Wakefield
Jean-Claude Dubois
President | BNP Paribas Real Estate Valuation France
Roderick Scrivener
Senior Director Value & Risk Advisory | Jones Lang LaSalle Luxembourg
Florin Ianculescu-Popa
Director | CBRE Romania
62 Press release – 28 July 2023
1.2. Report of the statutory auditor
Report on the review of the consolidated interim financial information of Warehouses De Pauw NV for the six-month period ended 30 June 2023
In the context of our appointment as the company’s statutory auditor, we report to you on the consolidated interim financial information. This consolidated interim financial information comprises the consolidated condensed statement of financial position as at 30 June 2023, the consolidated condensed income statement, the consolidated condensed statement of comprehensive income, the consolidated condensed statement of changes in equity and the consolidated condensed statement of cash flows for the period of six months then ended, as well as selective notes I to XIII.
Report on the consolidated interim financial information
We have reviewed the consolidated interim financial information of Warehouses De Pauw NV (“the company”) and its subsidiaries (jointly “the group”), prepared in accordance with International Accounting Standard (IAS) 34, “Interim Financial Reporting” as adopted by the European Union.
The consolidated condensed statement of financial position shows total assets of 7 059 508 (000) EUR and the consolidated condensed income statement shows a net result (group share) for the period then ended of 75 501 (000) EUR.
The board of directors of the company is responsible for the preparation and fair presentation of the consolidated interim financial information in accordance with IAS 34, “Interim Financial Reporting” as adopted by the European Union. Our responsibility is to express a conclusion on this consolidated interim financial information based on our review.
Scope of review
We conducted our review of the consolidated interim financial information in accordance with International Standard on Review Engagements (ISRE) 2410, “Review of interim financial information performed by the independent auditor of the entity”. A review of interim financial information consists of making inquiries, primarily of persons responsible for financial and accounting matters, and applying analytical and other review procedures. A review is substantially less in scope than an audit performed in accordance with the International Standards on Auditing (ISA) and consequently does not enable us to obtain assurance that we would become aware of all significant matters that might be identified in an audit. Accordingly, we do not express an audit opinion on the consolidated interim financial information.
Conclusion
Based on our review, nothing has come to our attention that causes us to believe that the consolidated interim financial information of Warehouses De Pauw NV has not been prepared, in all material respects, in accordance with IAS 34, “Interim Financial Reporting” as adopted by the European Union.
Signed at Zaventem.
The
statutory auditor
Deloitte Bedrijfsrevisoren / Réviseurs d’Entreprises BV/SRL
Represented by Kathleen
De Brabander
63 Press release – 28 July 2023
2. EPRA Performance measures
EPRA
Recurring earnings from the core operational activities. This figure is to be considered a key measure of a company’s underlying operating results from its property rental business and an indicator of the extent to which current dividend payments are supported by earnings.
64 Press release – 28 July 2023
Earnings
in euros (x 1,000) H1 2023 H1 2022 Earnings per IFRS income statement 29,550 455,737 Adjustments to calculate the EPRA Earnings, exclude: I. Changes in value of investment properties, development properties held for investment and other interests 141,707 -244,147 - Changes in the value of the real estate portfolio 137,174 -247,398 - Depreciation and write-down on solar panels 4,533 3,250 II. Profit or losses on disposal of investment properties, development properties held for investment and other interests 1,504 55 VI. Changes in fair value of financial instruments and associated close-out costs 20,796 -133,473 VIII. Deferred tax in respect of EPRA adjustments -58,551 51,261 IX. Adjustments (I.) to (VIII.) to the above in respect of joint ventures 12,408 -19,366 X. Minority interests in respect of the above -3,015 4,535 EPRA Earnings 144,399 114,602 Weighted average number of shares 204,743,120 185,517,102 EPRA Earnings per share (EPS) (in euros) 0.71 0.62
EPRA NAV indicators
The EPRA NAV metrics make adjustments to the IFRS NAV in order to provide stakeholders with the most relevant information on the fair value of the assets and liabilities. The three different EPRA NAV metrics are calculated based on the following rationales:
- EPRA NRV: the aim of the metric is to also reflect what would be needed to recreate the company through the investment markets based on its current capital and financing structure, including real estate transfer taxes.
- EPRA NTA: this is the NAV adjusted to include properties and other investments at their fair value and exclude certain line items that are not expected to take shape in a business model with investment properties over the long term.
- EPRA NDV: the EPRA Net Disposal Value provides the reader with a scenario of the disposal of the company's assets resulting in the settlement of deferred taxes and the liquidition of debt and financial instruments.
65 Press release – 28 July 2023
in euros (x 1,000) 30.06.2023 31.12.2022 EPRA NRV EPRA NTA EPRA NDV EPRA NRV EPRA NTA EPRA NDV IFRS NAV 4,158,177 4,158,177 4,158,177 4,273,375 4,273,375 4,273,375 IFRS NAV/share (in euros) 20.1 20.1 20.1 20.9 20.9 20.9 Diluted NAV at fair value (after the exercise of options, convertibles and other equity interests) 4,158,177 4,158,177 4,158,177 4,273,375 4,273,375 4,273,375 Exclude: (V) Deferred tax in relation to fair value gains of investments properties 52,710 52,710 114,066 114,066 (VI) Fair value of financial instruments -150,526 -150,526 -162,196 -162,196 (VIII.b) Intangibles as per the IFRS balance sheet -1,064 -860 Subtotal 4,060,361 4,059,297 4,158,177 4,225,245 4,224,384 4,273,375 Include: (IX) Fair value of fixed interest rate debt 162,855 180,983 (XI) Real estate transfer tax 392,273 389,740 NAV 4,452,634 4,059,297 4,321,032 4,614,985 4,224,384 4,454,358 Number of shares 207,118,066 207,118,066 207,118,066 203,980,363 203,980,363 203,980,363 NAV/share (in euros) 21.5 19.6 20.9 22.6 20.7 21.8
EPRA cost ratio
Administrative/operating costs including or minus the direct vacancy costs, divided by gross rental income. This figure is to be considered a key indicator to enable meaningful measurement of the changes in operating costs of a real estate company.
66 Press release – 28 July 2023
in euros (x 1,000) H1 2023 FY 2022 Include: I. Administrative/operating expenses (IFRS) -18,611 -32,837 I-1. Impairments of trade receivables -674 -882 I-2. Recovery of property charges 0 0 I-3. Recovery of rental charges and taxes normally paid
the tenant on let properties -2,325 -4,172 I-4. Costs payable by tenants and paid out by the owner for rental damage and refurbishment at end of lease 0 0 I-5. Property charges -7,281 -11,705 I-6. General company expenses -8,330 -16,078 III. Management fees less actual/estimated profit element 675 1,227 V. Administrative/operating expenses of joint ventures expense -199 -499 Exclude (if part of the above): VI. Investment property depreciation 151 283 Administrative/operating expenses related to solar panels 1,171 2,231 EPRA costs (including direct vacancy costs) A -16,814 -29,595 IX. Direct vacancy costs 280 1,055 EPRA costs (excluding direct vacancy costs) B -16,533 -28,540 X. Gross rental income (IFRS) 163,580 293,250 Less net ground rent costs -1,094 -1,952 XII. Gross rental income of joint ventures 2,296 3,857 Less net ground rent costs -127 -200 Gross rental income C 164,655 294,955 EPRA Cost Ratio (including direct vacancy costs) A/C 10.2% 10.0% EPRA Cost Ratio (excluding direct vacancy costs) B/C 10.0% 9.7%
by
EPRA NIY and EPRA Topped-up NIY
The EPRA NIY relates to an annualised rental income based on the cash rents passing at the balance sheet date, less nonrecoverable property operating expenses, divided by the market value of the property, increased with (estimated) purchasers’ costs. It is a comparable measure around Europe for portfolio valuations. In the past, there has been debate about portfolio valuations across Europe. This measure should make it easier for investors to judge themselves, how the valuation of portfolio X compares with portfolio Y.
The EPRA TOPPED-UP NIY is a measure that incorporates an adjustment to the EPRA NIY in respect of the expiration of rentfree periods (or other unexpired lease incentives such as discounted rent periods and step rents) and provides detail on the calculation of the measure and reconciliation between the EPRA NIY and EPRA TOPPED-UP NIY.
67 Press release – 28 July 2023
in euros (x 1,000) 30.06.2023 31.12.2022 Investment property - wholly owned 6,367,248 6,351,916 Investment property - share of joint ventures 131,135 131,286 Less developments, land reserves and the right of use of consessions -471,695 -624,019 Completed property portfolio 6,026,688 5,859,182 Allowance for estimated purchasers' costs 371,285 357,455 Gross up completed property portfolio valuations A 6,397,973 6,216,637 Annualised cash passing rental income 348,857 329,045 Property outgoings -17,796 -15,246 Annualised net rent B 331,061 313,799 Notional rent expiration of rent free period or other lease incentives 0 0 Topped-up net annualised rent C 331,061 313,799 EPRA NIY B/A 5.2% 5.0% EPRA TOPPED-UP NIY C/A 5.2% 5.0%
EPRA LTV
A key (shareholder-gearing) metric to determine the percentage of debt comparing to the appraised value of the properties. The EPRA LTV is obtained by dividing debt by the sum of the fair value of the property portfolio and the fair value of the solar panels.
68
release – 28
Press
July 2023
30.06.2023 31.12.2022 Proportionate consolidation Proportionate consolidation in euros (x 1,000) Group As reported Share of Joint Ventures Share of Material Associates Non controlling interests (NCI) Combined Group As reported Share of Joint Ventures Share of Material Associates Non controlling interests (NCI) Combined Include: Borrowings from Financial Institutions 1,640,113 45,327 -92,245 1,593,195 1,426,195 50,435 -88,068 1,388,562 Commercial paper 154,350 154,350 168,850 168,850 Hybrids (including convertibles, preference shares, debt, options, perpetuals) 0 0 0 0 Bond loans 807,034 807,034 806,855 806,855 Foreign currency derivatives 176 176 -2,585 -2,585 Net (trade) payables 50,298 6,009 -134 56,173 91,975 2,850 -2,120 92,705 Owner-occupied property (debt) 0 0 0 0 Current accounts (equity characteristics) 0 0 0 0 Exclude: Cash and cash equivalents -14,016 -3,497 1,028 -16,485 -8,040 -384 516 -7,908 Investments in non-material associates x Loan-tovalue -95,138 -95,138 -87,847 -87,847 Net Debt A 2,542,818 47,839 0 -91,351 2,499,306 2,395,403 52,901 0 -89,672 2,358,633 Include: Owner-occupied property 0 0 0 0 Investment properties at fair value 6,154,620 118,054 -163,521 6,109,153 6,010,767 102,799 -156,855 5,956,711 Properties held for sale 0 572 572 8,624 314 8,938 Properties under development 151,881 2,652 -5,104 149,429 279,994 17,579 -9,350 288,222 Intangibles 1,064 3,128 -1 4,190 860 3,082 -2 3,940 Net (trade) receivables 0 0 0 0 Financial assets 4,302 4,302 4,199 4,199 Solar panels 155,618 3,252 -3,247 155,622 160,636 3,269 -3,450 160,455 Total Property Value B 6,467,484 127,657 0 -171,873 6,423,268 6,465,081 127,042 0 -169,658 6,422,465 Loan-to-value A/B 39.3% 38.9% 37.1% 36.7%
3. Alternative Performance Measures31
Result on the portfolio (including the share of joint ventures) – Group share
This relates to the realised and unrealised capital gains/losses with respect to the latest valuation by the property expert, taking into account the effective or deferred capital gains tax due, including WDP’s proportionate share in the portfolio of associated companies and joint ventures and excluding the minority interests.
Changes in gross rental income with an unchanged portfolio
This is the organic growth of the gross rental income year-on-year on the basis of an unchanged portfolio, excluding development projects, acquisitions and disposals during both periods of this comparison.
31 Excluding EPRA metrics, some of which are considered APM and are reconciled under the 2. EPRA Performance measures.
69 Press release – 28 July 2023
in euros (x 1,000) H1 2023 H1 2022 Movement in the fair value of investment property -137,174 247,398 Result on disposal of investment property -1,504 -55 Deferred taxation on result on the portfolio 58,551 -51,261 Participation in the result of associated companies and joint ventures -12,347 19,364 Result on the portfolio -92,474 215,447 Minority interests 2,873 -4,574 Result on the portfolio - Group share -89,601 210,873
in euros (x 1,000) H1 2023 H1 2022 ∆ y/y (%) Properties owned throughout the two years 143,041 134,839 6.1% Development projects 16,307 7,210 n.r. Acquisitions 6,423 1,364 n.r. Disposals 208 495 n.r. Total 165,979 143,908 n.r. To be excluded: Rental income of joint ventures -2,296 -2,047 n.r. Indemnification related to early lease terminations 0 0 n.r. Rental income (IFRS) 163,683 141,860 n.r.
Average cost of debt
This refers to the weighted average yearly interest rate for the reporting period, taking into account the average outstanding debt and the hedging instruments during that same period.
Financial result (excluding changes in the fair value of financial instruments)
This is the financial result according to IFRS exclusive of the change in fair value of financial assets and liabilities, and reflects the actual financial expenses of the company.
70 Press release – 28 July 2023
in euros (x 1,000) H1 2023 FY 2022 Financial result (IFRS) -40,844 176,642 To be excluded: Changes in fair value of financial assets and liabilities 20,355 -220,091 Interest capitalised during construction -3,738 -5,754 Interest cost related to leasing debts booked in accordance with IFRS 16 1,545 2,780 Other financial costs and revenues -395 -1,437 To be included: Interest expenses of joint ventures -717 -339 Effective financial expenses (proportional) A -23,795 -42,758 Average outstanding financial debt (IFRS) 2,473,897 2,475,410 Average outstanding financial debt of joint ventures 47,831 40,979 Average outstanding financial debt (proportional) B 2,521,728 2,105,685 Annualised average cost of debt A/B 1.9% 2.0%
in euros (x 1,000) H1 2023 H1 2022 Financial result -40,844 109,276 To be excluded: Changes in fair value of financial instruments 20,355 -130,047 Financial result (excluding the changes in fair value of financial instruments) -20,489 -20,771
Operating margin
The operating margin, obtained by dividing the operating result (before the result on the portfolio) by the property result. Operating margin is a measure of profitability that can indicate how well the company is managing its operating property operations.
Hedge ratio
Percentage of fixed-rate and floating-rate debts hedged against interest rate fluctuations by means of derivatives. This economic parameter is not an obligatory parameter under the Belgian regulated real-estate investment companies Law (Wet betreffende de gereglementeerde vastgoedvennootschappen or 'GVV-Wet').
71 Press release – 28 July 2023
in euros (x 1,000) H1 2023 H1 2022 Property result (IFRS) 173,335 153,793 Operating result (before the portfolio result) (excluding depreciation and write-downs on solar panels) 157,723 140,773 Operating margin 91.0% 91.5%
in euros (x 1,000) 30.06.2023 31.12.2022 Notional amount of Interest Rate Swaps 1,757,425 1,317,425 Fixed rate financial debt 1,071,085 1,071,328 Fixed-interest financial debt at balance sheet date and hedging instruments A 2,828,510 2,388,753 Current and non-current financial debt (IFRS) 2,601,498 2,401,901 Proportional share in joint ventures in current and non-current financial debt 45,327 49,959 Financial debt at balance sheet date B 2,646,825 2,451,859 Hedge ratio A/B 106.9% 97.4%
Gearing ratio
Statutory ratio calculated based on the GVV/SIR legislation by dividing the financial and other liabilities by the total assets. For the method used in the calculation of the gearing ratio, refer to the RD on Regulated real Estate Companies.
72 Press release – 28 July 2023
in euros (x 1,000) 30.06.2023 30.06.2023 31.12.2022 31.12.2022 IFRS Proportionate IFRS Proportionate Non-current and current liabilities 2,826,254 2,904,761 2,705,896 2,787,834 To be excluded: - I. Non-current liabilities A. Provisions 160 160 160 160 - I. Non-current liabilities C. Other non-current financial liabilitiesPermitted hedging instruments 0 0 0 0 - I. Non-current liabilities F. Deferred taxes - Liabilities 46,549 59,872 107,544 121,396 - II. Current liabilities A. Provisions 0 0 0 0 - II. Current liabilities E. Other current liabilities Other: Hedging instruments 0 0 0 0 - II. Current liabilities - F. Accruals and deferred income 44,265 45,431 40,877 41,493 Total debt A 2,735,279 2,799,297 2,557,315 2,624,785 Total assets 7,059,508 7,138,015 7,053,848 7,135,786 To be excluded: - E. Financial fixed assets - Financial instruments at fair value through profit and loss - Permitted hedging instruments 150,526 150,526 162,196 162,196 Total assets taken into account for the calculation of the gearing ratio B 6,908,982 6,987,489 6,891,651 6,973,590 Gearing ratio A/B 39.6% 40.1% 37.1% 37.6%
Loan-to-value
The loan-to-value is obtained from the IFRS statements by dividing the net financial liabilities by the sum of the fair value of the property portfolio, the fair value of the solar panels and financing to and holdings in associated companies and joint ventures.
73 Press release – 28 July 2023
in euros (x 1,000) 30.06.2023 31.12.2022 IFRS IFRS Non-current and current financial debt 2,601,498 2,401,901 Cash and cash equivalents -14,016 -8,040 Net financial debt A 2,587,481 2,393,860 Fair value of the real estate portfolio (excluding right of use concessions) 6,306,501 6,299,386 Fair value of the solar panels 155,618 160,636 Financing of and participations in associated companies and joint ventures 288,840 304,085 Total portfolio B 6,750,959 6,764,107 Loan-to-value A/B 38.3% 35.4%
Net debt / EBITDA (adjusted)
The net debt / EBITDA (adjusted) is calculated starting from the proportional accounts (WDP's joint ventures are included for their proportionate share): in the denominator taking into account the trailing-twelve-months normalized EBITDA and adjusted to reflect the annualized impact of external growth; in the numerator taking into consideration the net financial indebtedness adjusted for the projects under development multiplied by the loan-to-value of the group (as these projects are not yet income contributing but already (partially) financed on the balance sheet). For associated companies only the dividends are taken into account.
1 For the calculation of this APM, it is assumed that the operating result (before the result on the portfolio) is a proxy for EBITDA. TTM stands for trailing 12 months and means that the calculation is based on financial figures for the past 12 months.
2 On a normalized basis and including the annualized impact of organic growth (such as indexation) and external growth (in function of realised disposals, acquisitions and projects).
74 Press release – 28 July 2023
in euros (x 1,000) 30.06.2023 31.12.2022 Non-current and current financial debt (IFRS) 2,601,498 2,401,901 - Cash and cash equivalents (IFRS) -14,016 -8,040 Net debt (IFRS) A 2,587,481 2,393,860 Operating result (before the result on the portfolio) (IFRS) (TTM)¹ B 300,434 284,586 + Depreciation and write-down on solar panels 8,357 7,255 + Share in the EPRA Earnings of joint ventures 2,440 1,918 + Dividends received from associated companies 3,556 3,375 EBITDA (IFRS) C 314,787 297,134 Net debt / EBITDA A/C 8.2x 8.1x in euros (x 1,000) 30.06.2023 31.12.2022 Non-current and current financial debt (proportionate) 2,646,825 2,451,859 - Cash and cash equivalents (proportionate) -17,513 -8,424 Net debt (proportional) A 2,629,311 2,443,435 - Projects under development x Loan-to-value -59,650 -106,501 - Financing to joint ventures x Loan-to-value -1,660 -1,503 Net debt (proportional) (adjusted) B 2,568,001 2,335,431 Operating result (before the result on the portfolio) (IFRS) (TTM)¹ C 300,434 284,586 + Depreciation and write-down on solar panels 8,357 7,255 + Operating result (before the result on the portfolio) of joint ventures (TTM)¹ 4,006 3,259 + Dividends received from associated companies (TTM)¹ 3,556 3,375 Operating result (before the result on the portfolio) (proportionate) (TTM)¹ D 316,353 298,474 Adjustment for normalized EBITDA² 33,159 29,235 EBITDA (proportionate) (adjusted) E 349,512 327,709 Net debt / EBITDA (adjusted) B/E 7.3x 7.1x
4. Declarations
Tony De Pauw and Joost Uwents, both managing directors and co-CEOs, hereby declare on behalf of the Board of Directors, having taken all measures to ensure this and to the best of their knowledge, that:
• the condensed interim financial statements, drawn up as per the applicable standards for annual accounts, give a true and fair view of the group’s equity, financial position and the results of WDP, and of the companies included in the consolidation and that
• the interim report gives a faithful overview of the important events during the first six months of the current financial year, their effect on the condensed financial statements, the main risk factors and uncertainties for the remaining months of the financial year, and the main transactions between the related parties and their possible effect on the condensed financial statements should these transactions have or could have had material consequences for WDP’s financial position or results in the first six months of the current financial year.
75 Press release – 28 July 2023
11. Disclaimer
Warehouses De Pauw NV/SA, abbreviated WDP, having its registered office at Blakebergen 15, 1861 Wolvertem (Belgium), is a public regulated real estate company under Belgian law and listed on Euronext.
This press release contains forward-looking information, forecasts, beliefs, opinions and estimates prepared by WDP, relating to the currently expected future performance of WDP and the market in which WDP operates (‘forward-looking statements’). By their very nature, forward-looking statements involve inherent risks, uncertainties and assumptions, both general and specific, and risks exist that the forward-looking statements will not prove accurate. Investors should be aware that a number of important factors could cause actual results to differ materially from the plans, objectives, expectations, estimates and intentions expressed in, or implied by, such forward-looking statements. Such forward-looking statements are based on various hypotheses and assessments of known and unknown risks, uncertainties, and other factors which seemed sound at the time they were made, but which may or may not prove to be accurate. Some events are difficult to predict and can depend on factors on which WDP has no control. Statements contained in this press release regarding past trends or activities should not be taken as a representation that such trends or activities will continue in the future.
This uncertainty is further increased due to financial, operational, and regulatory risks and risks related to the economic outlook, which reduces the predictability of any declaration, forecast, or estimate made by WDP. Consequently, the reality of the earnings, financial situation, performance, or achievements of WDP may prove substantially different from the guidance regarding the future earnings, financial situation, performance, or achievements set out in, or implied by, such forward-looking statements. Given these uncertainties, investors are advised not to place undue reliance on these forward-looking statements. Additionally, the forward-looking statements only apply on the date of this press release. WDP expressly disclaims any obligation or undertaking, unless if required by applicable law, it must release any update or revision in respect of any forward-looking statement, to reflect any changes in its expectations or any change in the events, conditions, assumptions, or circumstances on which such forward-looking statements are based. Neither WDP, nor its representatives, officers, or advisors, guarantee that the assumptions underlying the forward-looking statements are free from errors, and neither do they make any representation, warranty, or prediction that the results anticipated by such forward-looking statements will be achieved.
76 Press release – 28 July 2023
More information
WDP NV/SA Joost Uwents
Mickael Van den Hauwe
Blakebergen 15 CEO CFO
B-1861 Wolvertem
www.wdp.eu
investorrelations@wdp.eu


joost.uwents@wdp.eu
mickael.vandenhauwe@wdp.eu
WDP develops and invests in logistics property (warehouses and offices). WDP’s property portfolio amounts to more than 7 million m². This international portfolio of semi-industrial and logistics buildings is spread over approximately 290 sites at prime logistics hubs for storage and distribution in Belgium, France, the Netherlands, Luxembourg, Germany and Romania.
WDP NV/SA – BE-REIT (public regulated real estate company under Belgian law).


Company number 0417.199.869 (Register of legal entities of Brussels, Dutch section)


77 Press release – 28 July 2023
___
