July 2023


Prepared by:
Table of Contents
Executive Summary
Top Climate Actions
Section 01 Introduction
Benefits of Climate Action Planning
Climate Change and Impacts
Minnesota Region 4’s Greenhouse Gas Emissions
GHG Emission Reduction Goal
Planning Process
Plan Framework
Section 2 Transportation and Mobility
Section 3 Buildings and Energy
Section 4 Waste Management
Section 5 Water and Wastewater
Section 6
Local Food and Agriculture
Section 7 Greenspace and Trees
Section 8 Health and Safety
Section 9
Section 10
Appendix A
Climate Economy
Climate Actions and Implementation
Supporting Research
Baseline and Strategic Goals Recommendations Report
Climate Vulnerability Assessment
MN Region 4 GHG Inventory

Ground Cover, Tree Canopy, and Carbon Sequestration Study
Region-Wide Solar Energy Potentials Study
Appendix B Abbreviations and Glossary of Terms
Appendix C
Appendix D
Funding Climate Action Memo
Acknowledgements
The Region
s Future Climate


+15-20 more days annually with
+69% more
+4-5°F warmer average annual temperature than now. air conditioning demand and energy needed than now.

+15% higher Annual average rainfall than now
+30% more Heavy precipitation events annually
+20 days longer Growing, allergy, and mosquito season

’
By 2050, MN Region 4’s climate can be expected to be: 1895 2020 Minnesota’s Annual Temperature Trends Each stripe represents the temperature Minnesota averaged over a year. Blue = Below Average Red = Above Average
a high temperature over 95°F.
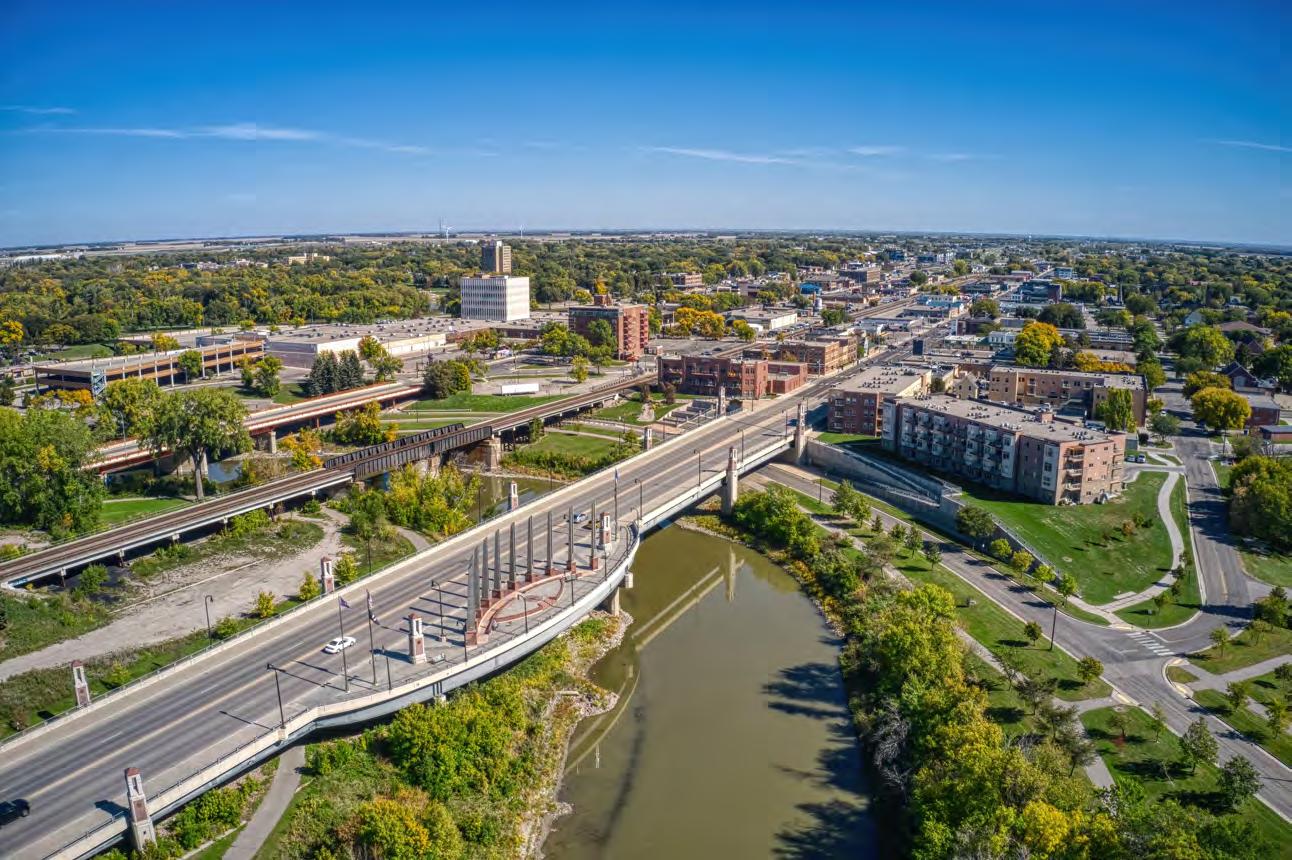
West Central Initiative (WCI) serves the west central Minnesota counties of Becker, Clay, Douglas, Grant, Otter Tail, Pope, Stevens, Traverse, and Wilkin and White Earth Nation. This region is known as the Minnesota Economic Development Region 4.
The work that went into the Minnesota Region 4 Climate Action Plan:
planning timeframe community members providing input planning team members foundational research study documents on-line community input survey efforts
WCI believes that a healthy, sustainable planet is one where all people belong and can live together in peace and prosperity. To that end, WCI has embarked on a process to create a Climate Action Plan for west central Minnesota. The plan identifies climate mitigation and adaptation goals, strategies and actions through 2030.
The plan was developed through two phases:

Phase one began in June 2022 with distribution of a Climate Action Survey open to every resident of west central Minnesota. The survey assisted in defining climate-related issues of relevance and concern to the people in our region. In addition to information gathered from the survey, paleBLUEdot compiled area-specific data on energy use and emissions, infrastructure, natural resources, transportation, and potential renewable energy sources.
Phase two started in December 2022 and was comprised of a collaborative planning process with 24 community members, elected officials, county, and municipal staff representatives from throughout the region. This collaborative planning process incorporated the public’s feedback from phase one and established climate action goals, strategies, and detailed actions to achieve those goals.
Click here to return to TOC
Our Carbon Reduction Goal


The plan aims to cut down greenhouse gas emissions in line with the Intergovernmental Panel on Climate Change (IPCC) recommendations, demonstrating a commitment to a healthier, sustainable future.

“To reduce regionwide GHG emissions 40% below 2021 levels by 2030, and achieve carbon neutrality by 2050.”


56% 10% 34% Transportation Solid Waste Buildings + Energy Region-wide Emissions
addresses through supported by over an 8 SECTORS
40 STRATEGIES 273 ACTIONS 8 YEAR
of GHG emissions and climate adaptation to achieve goals detailing steps to be taken
Climate Action Plan as Living Plan
This Climate Action Plan is a "living plan," designed for continual adaptation, rather than being a static document. Implementation will be marked by regular assessments of progress and necessary adjustments. The 2030 emissions reduction goal acts as a stable guide, acknowledging that initial actions might not immediately fulfill long-term objectives. Regular plan evaluations will highlight needed additional steps, or enhancements to action targets, to ultimately reach the 2030 greenhouse gas reduction goal.
Implementation is For Everyone
Addressing the widespread causes and impacts of climate change necessitates equally comprehensive solutions. This plan, crafted by the West Central Initiative (WCI), is designed to spur regional climate action. Success hinges on the endorsement and application of this plan by local governments throughout the region.
Key actions must be spearheaded by various stakeholders, such as elected officials, county/city departments, WCI staff, the business community, as well as households and individuals. Achieving the ambitious goals laid out in this plan mandates active participation and a sense of duty from not just WCI and local government officials, but from the entire community. Constant involvement, advocacy, and action towards measures deemed significant are crucial components for all stakeholders involved.
Next Steps and Implementation
This Climate Action Plan should be viewed as only the beginning of an ongoing process to evaluate and advance the region’s climate resilience, GHG emissions, and overall sustainability goals. The plan includes a Climate Action Implementation section providing detailed actions in a framework for launching, guiding, monitoring, and evaluating the execution of this plan.
 The Minnesota Region 4 Climate Action Plan:
Implementation timeframe
The Minnesota Region 4 Climate Action Plan:
Implementation timeframe

The following are likely the phase 1 actions with the greatest impact GHG reduction or climate adaptation potential or those which help to establish a solid foundation for later actions included in the Climate Action Plan. These climate actions represent a “Quick Start” sub-list of impactful actions for community-wide and municipal operations and are recommended for prioritized implementation.
Transportation and Mobility
TM 2- 1 Develop a region-wide Multimodal Transportation Plan (MTP) to facilitate the expansion of strong multimodal transportation connections (walk, bike, carpool, etc) and transit connections within and between municipalities.
TM 3- 4 Create an Electric Vehicle Action Plan (EVAP). An EV Action Plan should: 1) address increased public access to chargers, 2) identify locations for chargers in commercial areas, 3) identify DC Fast Charging locations 4) explore charging infrastructure technologies including streetlight integration, smart cable technologies, bi-directional charging, inductive charging and others 5) address barriers to charging at homes and rental properties (such as households without garages), 6) identify strategies to increase use of EVs in car sharing programs, and 7) assess the potential to partner with third-party EV charging station providers to lower program and construction costs.
Buildings and Energy
BE 1- 1 Partner with regional utilities and other established Energy Audit/Energy Efficiency Program(s) to accomplish significant residential energy efficiency improvements and make the program accessible to all Region residents, including reduced participation costs for low income households. The program should offer building envelope tests, infrared thermal scanning, light weatherization projects, LED light bulb replacement. Additionally, offer building operations and behavioral suggestions, as well as track carbon, energy, and financial savings Goal: 500 households annually achieving a 15% efficiency increase per location.
BE 3- 1 Deploy an incentive program for electrification. Work with regional utilities or other regional partnerships to create financial incentives to electrify new and existing buildings. For example, rebates for panel upgrades, electric appliances, Air Source Heat Pumps, Ground Source Heat Pumps, and solar thermal systems can encourage the transition to noncombustion energy use in homes and businesses. Goal: Target 10% residential market conversion and 5% commercial/ industrial market conversion by 2030.
BE 4- 1 Coordinate and promote a residential Solar Group Purchase Campaign annually to help reduce the costs of solar installation through volume purchasing power (goal, 500 households annually). Program design to explore strategies to support local small business solar installers and strategies to support local workforce development.
Waste Management
WM 2- 3 Collaborate with residential and commercial waste haulers to establish organics diversion programs for residential and commercial buildings. Explore options such as trash Integrated Food Scrap Compost Collection (see Ramsey County MN pilot program https://cutt.ly/8vZ6lDc )
WM 4- 1 Conduct a detailed feasibility study for the development of a plasma gasification system using all of the region's municipal solid waste currently being sent to landfill directly, or as RDF reject materials.* Study should include overall feasibility, projected electrical generation potential, identification of beneficial use end products, long-term return on investment, detailed environmental benefit/impact statements, and an identification of implementation challenges, opportunities, and next steps. * See Renewable Energy Potentials Study for more information on Plasma Gasification https://cutt.ly/984HCje
Water and Wastewater
W 1- 1 Facilitate a collaboration with the region's water utilities to create and promote a program focused on reduction of water use by top 20 water consumers annually for each utility through an opt-in program. Offer free technical resources to large institutions and businesses to identify specific opportunities for employees or customers to conserve water and incorporate water efficiency into internal operations.
W 2- 5 Collaborate with partners to prepare a flash flood risk map to identify areas within the region that are particularly vulnerable to the impacts of flooding, including details such as tree canopy, impervious surface, heat islands, critical community infrastructure (water wells, wastewater treatment and pump houses, emergency response, power generation, fresh water supply, hospitals, etc.), and vulnerable populations. Based on risk mapping and assessments, create and implement a risk reduction and response plan.
Local Food and Agriculture
FA 2- 2 Explore the development of a region-wide community supported agriculture (CSA) program focused on increasing affordable access to fresh fruits and vegetables for food insecure and low income community members CSA program to prioritize and incentivize local farmers using or transitioning to regenerative agriculture practices.
FA 5- 7 Collaborate with partners to work with local farmers to promote the use of regenerative agriculture systems (e.g., no-till practices, perennial groundcover, alley cropping, silvopasture, succession planting, rotational grazing practices, etc) through incentives, workshops, and demonstration projects in order to increase carbon sequestration on farmland while also improving soil health and increasing resilience to climate impacts such as drought and flooding. Tools: http:// www.comet-farm.com/ GHG and Carbon Sequestration Ranking Tool: https://cutt.ly/Vf04djN
Greenspace and Trees
GT 1- 2 Support local governments in creating comprehensive community tree plans. Tree plans should focus on increasing urban canopy cover and include elements such as 1) conducting an inventory of street trees and community-wide canopy cover, 2) determining canopy goals, 3) developing a planting guide that prioritizes carbon sequestration, climate change resilience, and other equitably-distributed co-benefits including reduction of micro-heat islands and increased resilience for areas of highest population vulnerabilities, and 4) devising a plan for retiring trees and addressing unintended consequences such as sidewalk uplifts. The plans should also include potential ways to support trees on private property. Plan should anticipate and account for tree loss.
GT 2- 2 Encourage and support local governments in establishing a policy to require the use of native plants in landscaping at local government owned properties. Develop a region park and government facility turf analysis and conversion study to identify lesser maintenance turf and ground cover types, to determine native plant, pollinator restoration, and low / no mow cover opportunities, and help communities establish a conversion master plan.
Health and Safety
HS 2- 2 Collaborate with local governments and regional partners to establish a severe weather, air quality, and hazards communication plan to increase awareness of national, state, regional, and other alert systems. Communication plan to include pathways for when community power and communication systems are non-functional. Resources: National Weather Service, MPCA, Douglas County Emergency Management. Weatherbug Alerts https://www.weatherbug.com/
HS 3- 2 Support local governments in updating emergency plans with specific climate change-related emergency risks and communications materials . These could include press release templates, information on cooling/heating centers, specific plans for populations requiring mobility assistance, and steps to identify and help populations affected by extended power outages, flooding, etc.
Climate Economy
CE 1- 1 Conduct a Climate Economy Economic Development Assessment to identify economic opportunities possible through the successful implementation of the Climate Action Plan and achievement of its goals, especially those which can provide opportunity for the region's vulnerable populations. Establish a campaign to communicate findings, job creation potential of the strategies included in the CAP, and promote action.
CE 2- 1 Establish a regional business incubator to support the establishment of innovative energy efficiency and renewable energy and sustainability business models within the community. Structure incubator to increase participation of underresourced communities and increase opportunities for equity.
Cross-Pollinating
CP 3- 1 Establish and maintain a database of federal funding, incentives, and grants available to support regional and local government climate action implementation resulting from the Inflation Reduction Act (IRA), Infrastructure Investment and Jobs Act (IIJA) and others. Distribute updated information monthly to Region 4 communities and flag potential strategies and actions which may be supported by available funding mechanisms. Support collaborative Region 4 grant submissions.
CP 2- 1 Establish a MN Region 4 CAP Implementation Team comprised of staff, volunteer commission, and elected official representatives from Region 4 counties and municipalities. The task of the CAP Team should be to meet regularly to support CAP implementation at the county and municipal level, identify initial and on-going joint action opportunities, establish annual joint action plans, and coordinate joint action implementation. The Team should also serve as a general supportive resource peer group for participating representatives.


Click here to return to TOC
West Central Initiative (WCI) serves the west central Minnesota counties of Becker, Clay, Douglas, Grant, Otter Tail, Pope, Stevens, Traverse, and Wilkin and White Earth Nation. This region is known as the Minnesota Economic Development Region 4.
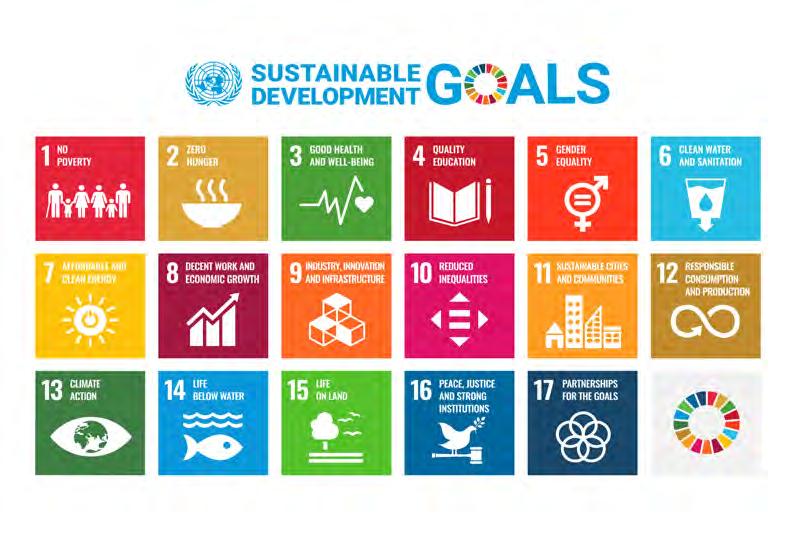
WCI believes that a healthy, sustainable planet is one where all people belong and can live together in peace and prosperity. To that end, WCI aligns and activates their work around climate change. As a roadmap to guide our work, WCI uses the Sustainable Development Goals. The goals apply to everyone around the globe.
In support of these goals, WCI embarked on a process to create a Climate Action Plan for west central Minnesota. The plan identifies climate mitigation and adaptation goals, strategies and actions through 2030. The planning process was highly collaborative and facilitated by paleBLUEdot
What is a Climate Action Plan (CAP)
Climate action plans are comprehensive road maps that outline the specific Strategies and Actions to implement for greenhouse gas emission reductions and to build resilience to related climatic impacts. The Minnesota Region 4 CAP addresses both climate mitigation and climate adaptation actions.
Why Create a Climate Action Plan
A Climate Action Plan (CAP) offers a structured approach for communities to combat global climate change, while enhancing resilience against climate impacts. CAPs can spur investment in innovative jobs and costsaving measures, improving quality of life. This is especially true for vulnerable community members, who often bear the brunt of climate change impacts.
Learn more about the Sustainable Development Goals here
Co– Benefits of Climate Action Planning


According to the World Health Organization, studies are increasingly showing that the implementation of climate policies leads to both cost savings and improvement in health. The actions communities take to reduce greenhouse gas emissions in various sectors, including housing, transportation, and energy have many co-benefits that go beyond climate change mitigation. These co-benefits to climate planning include reduced air pollution, substantial human health gains and reduced health risks, increased resource efficiency, improved local economic security, and improved resilience of ecosystems and our built environment. These benefits result in positive financial impacts as well as improved quality of life and natural resources.
Positive Financial Impacts


Many climate actions have a direct positive financial impact (e.g. savings from reduced fuel consumption). Many actions also have significant indirect financial impacts. Studies show that air pollution benefits of climate actions can cover a significant part of the cost of those initiatives. Still others help avoid costs through increased resilience such as reducing dependence on fossil fuels – estimated at $5 per metric ton (MT) of GHG reduction. Health benefits may offer the most significant financial opportunity. One study estimated global average health co-benefits of $58-380 per metric ton of GHG.
Improved Quality of Life


The actions included in this and other climate action plans support a continued improvement to the community’s quality of life. Studies indicate that successful implementation of many climate actions will result in increased mobility options, job creation, and reductions in poverty and inequality.

Improved Natural Resources
Addressing global warming could help lessen the harmful impacts of climate change on the ecosystems that now provide us with multiple benefits. Increasing Minnesota Region 4’s region-wide tree canopy to meet the goals of this climate action plan, for instance, could increase the economic benefit provided by the region’s trees by as much as $20,000,000 annually while other actions can result in improved access to greenspace for residents.
Common


-Benefits of Climate Action

Reduced Costs Improved Energy Resilience Jobs / Economic Development Improved Public Health Reduced Traffic Congestion Reduced Pollution Safer Streets Improved Community Resilience Improved Social Connectivity Protected / Enhanced Ecosystems Improved Quality of Life Improved Mobility Improved Air Quality Improved Community Equity
Co
Climate Change in Minnesota
Climate change is a global phenomenon that creates local impacts. It presents one of the most profound challenges of our time. A broad international consensus exists among atmospheric scientists that the Earth’s climate system is being destabilized in response to elevated levels of greenhouse gas emissions in the atmosphere. Two changes to Minnesota’s climate are occurring already: shorter winters with fewer cold extremes, and more heavy and extreme precipitation.
Climate Change in Minnesota Region 4
The climate in the region has already changed. From 1980 through 2018, the region has experienced an increase in annual average temperature, an increase in the number of days above 95 degrees, an increase in the number of heavy rain events, and a decrease in the number of days below 32 degrees.
Some of the most significant changes in the climate relate to variability. Climate variability can be seen in the changes in annual precipitation for the region. Overall annual precipitation has increased, however, this increase is not evenly distributed throughout the year. Fall and Winter precipitation have increased up to 15.5%, while Spring and Summer precipitation have remained nearly unchanged.
The region’s climate is anticipated to continue to warm through this century and beyond. Precipitation is anticipated to likely increase in all seasons particularly in the Spring and Fall. The primary changes to climate characteristics for the region include:
• Warmer annual average temperatures with a more significant warming in winter months.
• Increase in extreme heat days.
• Increase in heavy rain fall events, with increase in flood potential.
• Increase in time between precipitation with increase in drought potential.
• Greater variability in temperature and precipitation trends.
Looking Back
From 1980 through 2018, the region has experienced:
Increase in annual average temperature:
Increase in annual precipitation:
Increase in heavy precipitation
Increase in days >95°F:
Decrease in days <32°F:
Growing season:
Looking Forward
By 2100 the region can anticipate:
Increase in annual average temperature:
Increase in annual precipitation:
Increase in heavy precipitation
Increase in days >90:
Decrease in days <32:
Growing season:
Air Conditioning Demand:
1.62° 4.3% 34% 2 days -8 days +9 days
6°-12°F +10% 30% 45 days -45 days +43 days +178%
Climate Risks to The Region
The projected changes to Minnesota Region 4’s climate in the coming decades represent potential risks to residents. These risks are inequitably felt and are particularly acute in populations especially vulnerable to them such as children, seniors, and those with disabilities (see the Minnesota Region 4 Climate Vulnerability Assessment for more information). Below are some of the more significant risks to the community’s population.
Extreme Heat and Weather
Certain groups of people are more at risk for stress, health impacts, or death related to extreme weather events including tornadoes, wind storms, lightning, winter storms, hail storms, and cold waves. Vulnerability to heat stress can be increased by certain variables including the presence of health conditions like diabetes and heart conditions, demographic and socioeconomic factors, and surrounding land cover.
Air Quality
Climate change is expected to affect air quality through several pathways including production and potency of allergens and pollen, and increased regional concentrations of ozone, increased potential of smoke from wildfires, and increased particulate air pollution and dust.
Flooding
According to the latest National Climate Assessment, the frequency of heavy precipitation events are already increasing for the nation as a whole as well as for Minnesota specifically. These heavy rain events are projected to increase throughout Minnesota. Increases in both extreme precipitation and total precipitation are likely to increasingly contribute to over-bank flooding (river and lake flooding) as well as flash flooding.
Food Insecurity
Climate change is likely to destabilize cropping systems, interrupt transportation networks, and trigger food shortages and spikes in food cost.
Infrastructure Failure
Extreme weather events, flooding and flash flooding, as well as increasing daily stresses caused by increasing climate variability, all represent potential causes of failure of our aging infrastructure. Power outages, road damage, bridge collapse, and water infrastructure failure each represent significant physical climate risks to the community - especially individuals who are climate vulnerable.
What Are GHGs?
A greenhouse gas (GHG) is a molecule in the atmosphere which does not react to light energy in the visible range, but does react to light energy in the infrared range-like that which is emitted from the Earth after being warmed by the sun. The most common greenhouse gases include carbon dioxide (CO2), methane (CH4), and nitrous oxide (N2O).
Minnesota Region 4’s GHG Emissions
The Minnesota Region 4 Greenhouse Gas Inventory report provides an overview of Greenhouse Gas (GHG) emissions for the communities within the Minnesota Economic Development Region 4 including the counties of Becker, Clay, Douglas, Grant, Otter Tail, Pope, Stevens, Traverse, and Wilkin and White Earth Nation. As detailed in that report, the reported 2021 community wide emissions for Minnesota Region 4 totaled 3,786,676 metric tons comparable to the City of St Paul’s reported 2015 emissions.
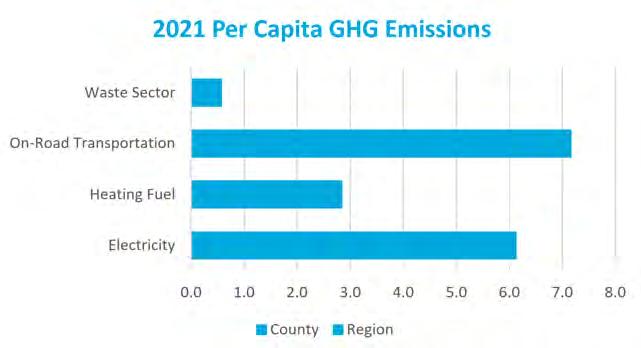
Understanding MN Region 4’s Per-Capita GHG Emissions
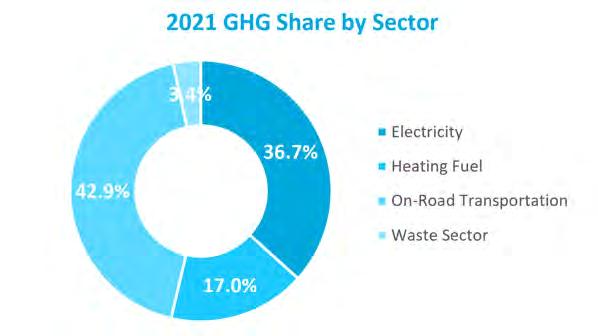
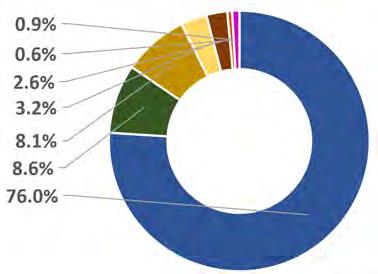
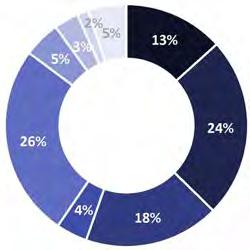
The reported 2021 community wide emissions for Minnesota Region 4 totaled 3,786,676 metric tons for a per capita GHG emissions average 16.7 metric tons (MT). The chart to the right indicates the per capita breakdown by sector.
Why do GHGs Matter?
GHGs let the sun's light shine onto the Earth's surface, but they trap the heat that reflects back up into the atmosphere. In this way, they act like the insulating glass walls of a greenhouse. The more GHGs there are the more heat that is trapped in our atmosphere and the more we experience the impacts of global warming.
What can we do to reduce GHGs?
Greenhouse gases can be reduced by making changes to the key sectors throughout our community particularly through the reduction and elimination of fossil fuel combustion and the advancement of clean energy sources.
MTCO2e = metric tons of carbon dioxide equivalent
Electricity Residential 483,057 Electricity Non-Residential 905,431 Heating Fuel Residential 147,189 Heating Fuel Non-Residential 496,775 On-Road Transportation 1,624,040 Waste Sector 130,184 Total GHG Emissions 3,786,676
2021 Region 4 GHG Emissions Summary (MTCO2e)
2021 Region 4 GHG Emissions Per Capita (MTCO2e)
2021 Region 4 GHG Emissions Share By Sector
Our Carbon Reduction Goal
The plan aims to cut down greenhouse gas emissions in line with the Intergovernmental Panel on Climate Change (IPCC) recommendations, demonstrating a commitment to a healthier, sustainable future.
To reduce region-wide GHG emissions 40% below 2021 levels by 2030, and achieve carbon neutrality by 2050.*
This region-wide goal is reflected in strategies established for individual sectors. Sector goals related to GHG emissions reductions are designed to balance reduction across all sectors and achieve the overall emissions goals set forth for the region. The goals seek to strike a balance between achievability while also stretching for improvement beyond business-as-usual.
Survey of Peer Regional Community Carbon Reduction
Albert Lea
Reduction in City operations and community-wide emissions of 25% below 2019 levels by 2030 and 80% below by 2040.
Burnsville
Duluth
Reduce community-wide GHG emissions 40% below 2005 levels by 2030 and 80% below 2005 levels by 2050.
80% reduction in GHG by 2050 from municipal operations compared to 2008 levels.
Edina
45% below 2019 levels by 2030 and achieve net zero emissions by 2050.
Madison 100% renewable energy and net-zero emissions by 2030 .
Maplewood
Reducing greenhouse gas emissions to 20 percent of the City’s 2015 baseline levels by 2050 (an 80 percent reduction).
Milwaukee
By 2030, Milwaukee aims to reduce community-wide net greenhouse gas emissions by at least 45% and net zero GHG emissions By 2050, or sooner.
Minneapolis
100% renewable energy for city operations by 2022 and citywide electricity by 2030.
New Brighton
Reduce GHG emissions by 42% below 2013 levels by 2030, and achieve carbon neutrality by 2050.
Rochester 100% renewable energy citywide by 2031 across all sectors.
St Louis Park
100% renewable electricity citywide by 2030, carbon neutrality by 2040.
* Carbon Neutrality refers to a community for which, on an annual basis, all greenhouse gas emissions resulting from community-wide operations are offset by carbon-free energy production.
St Paul
Carbon neutral municipal operations by 2030, carbon neutral citywide by 2050.
Winona Carbon neutral citywide by 2050.
The Process
The CAP was developed in collaboration with a 24 community members, West Central Initiative staff, elected officials, county, and municipal staff representatives from throughout the region. This collaborative planning process incorporated the public’s feedback from phase one and established climate action goals, strategies, and detailed actions to achieve those goals. The planning team was organized into sub-teams aligned with each of the sectors included in this plan (see Plan Framework). The plan was developed through a number of planning workshops from December 2022 through June 2023.
The goals and actions identified in the Climate Action Plan are grounded in community input, expert analysis, and best practices from other cities throughout the United States. Strategic goals and detailed actions were developed, refined, prioritized, and finalized by the Planning Team through a series of workshop meetings. The result of this process is a collaboratively created, co-authored Climate Action Plan which directly integrates the voices of the region’s community members and the volunteers of the collaborative planning team.
Research Based Climate Action Plan


In support of establishing the goals, strategies, and actions included in this plan, paleBLUEdot also produced a Greenhouse Gas Inventory, a Climate Vulnerability Assessment, a city-wide Renewable Energy Potentials Study, a community-wide Ground Cover, Tree Canopy, and Carbon Sequestration Study, and a Climate Action Baseline Assessment. These assessments created the foundation of the Climate Action Planning process.
Community Input
The climate action planning effort began in June 2022 with distribution of a Climate Action Survey open to every resident of west central Minnesota. The survey assisted in defining climate-related issues of relevance and concern to the people in our region. The survey was made available through April 2023 and received 380 responses. Below is a summary of key take-aways from the survey.
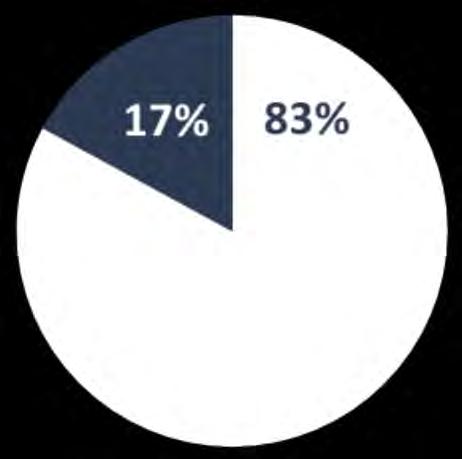
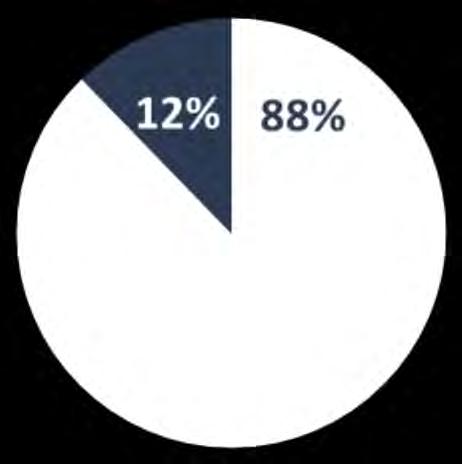
Over 88% of respondents have noticed signs of Climate Change while 75% reported being personally impacted by the effects of Climate Change.
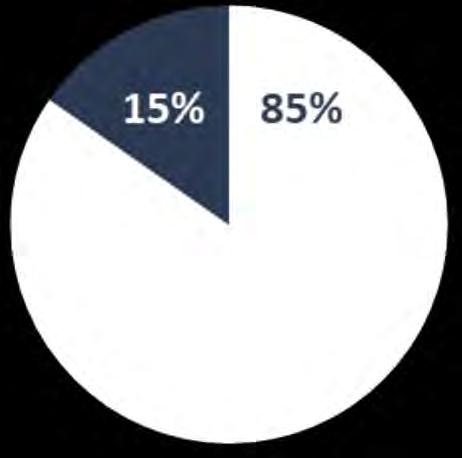
Action Support
Support for sector actions
Transportation Support one or more sector actions
Noticed Signs of Climate Change
Personally Impacted by Effects of Climate Change
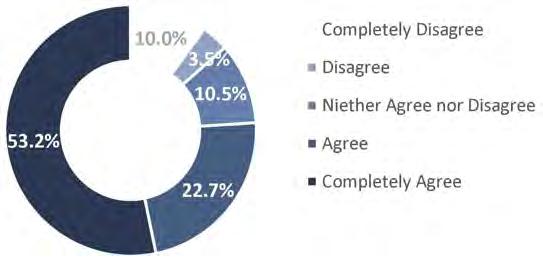
How much do you agree with the following statement: “It is important for our County / region to take action to prepare for the projected impacts of climate change like more heat waves, heavier rain events, and more days of poor air quality.”?
Building Energy Support one or more sector actions
Renewable Energy Support one or more sector actions
Waste Management Support one or more sector actions
Using This Plan
Each of these sector areas is described in a separate section with background considerations on the subject covered. Sectors have over-arching strategies established to meet 2030 goals and detailed actions for implementation. Sector actions primarily focus on Climate Mitigation, Climate Adaptation, or both:
Strategies: specific statements of direction that expand on the sustainability vision and GHG reduction goals and guide decisions about future public policy, community investment, and actions.
Actions: are detailed items that should be completed to carry out the vision and strategies identified in the plan.


Plan Framework

This Climate Action Plan includes an implementation framework designed to achieve region-wide goals for greenhouse gas reduction and climate adaptation and resilience. The plan is structured around a unifying framework organized by eight community-wide sectors.
Transportation and Mobility
Addressing GHG emissions from and resilience of on and off-road vehicles and equipment.

Buildings and Energy

Addressing GHG emissions from and resilience of our building stock and building energy supply.
Waste Management
Addressing GHG emissions from waste management and improved community resilience through waste reduction.
Water and Wastewater

Increasing resilience of our water supply and reducing GHG emissions associated with wastewater treatment.
Local Food and Agriculture
Increasing resilience of our food systems and improving food access and security.
Greenspace and Trees
Improving community adaptation through improved green infrastructure and addressing ecosystem resilience.

Health and Safety
Improving community resilience through healthy community connections, infrastructure, and systems.
Economy
Increasing the preparedness of our businesses and workforce and leveraging economic advantage of climate action.
Cross-Pollinating
Cross-Cutting Actions are foundational or organizational recommendations that apply to multiple Sectors.


Click here to return to TOC
Transportation significantly influences climate change, accounting for nearly 29% of US greenhouse gas emissions in 2019, primarily from fossil fuel combustion in various vehicles. Passenger cars and light-duty trucks, including SUVs, are responsible for over half of these emissions. Consequently, shifting towards cleaner technologies like electric vehicles, powered by renewable energy, and implementing efficient vehicle designs could significantly reduce emissions. Enhancing public transit and promoting walking and cycling can also decrease car ownership and related emissions. Climate change threatens transportation infrastructure too, with extreme weather events causing substantial damage, leading to disrupted travel, increased maintenance costs, and further emissions.
Transportation and Mobility Challenge and Opportunity for Rural Areas
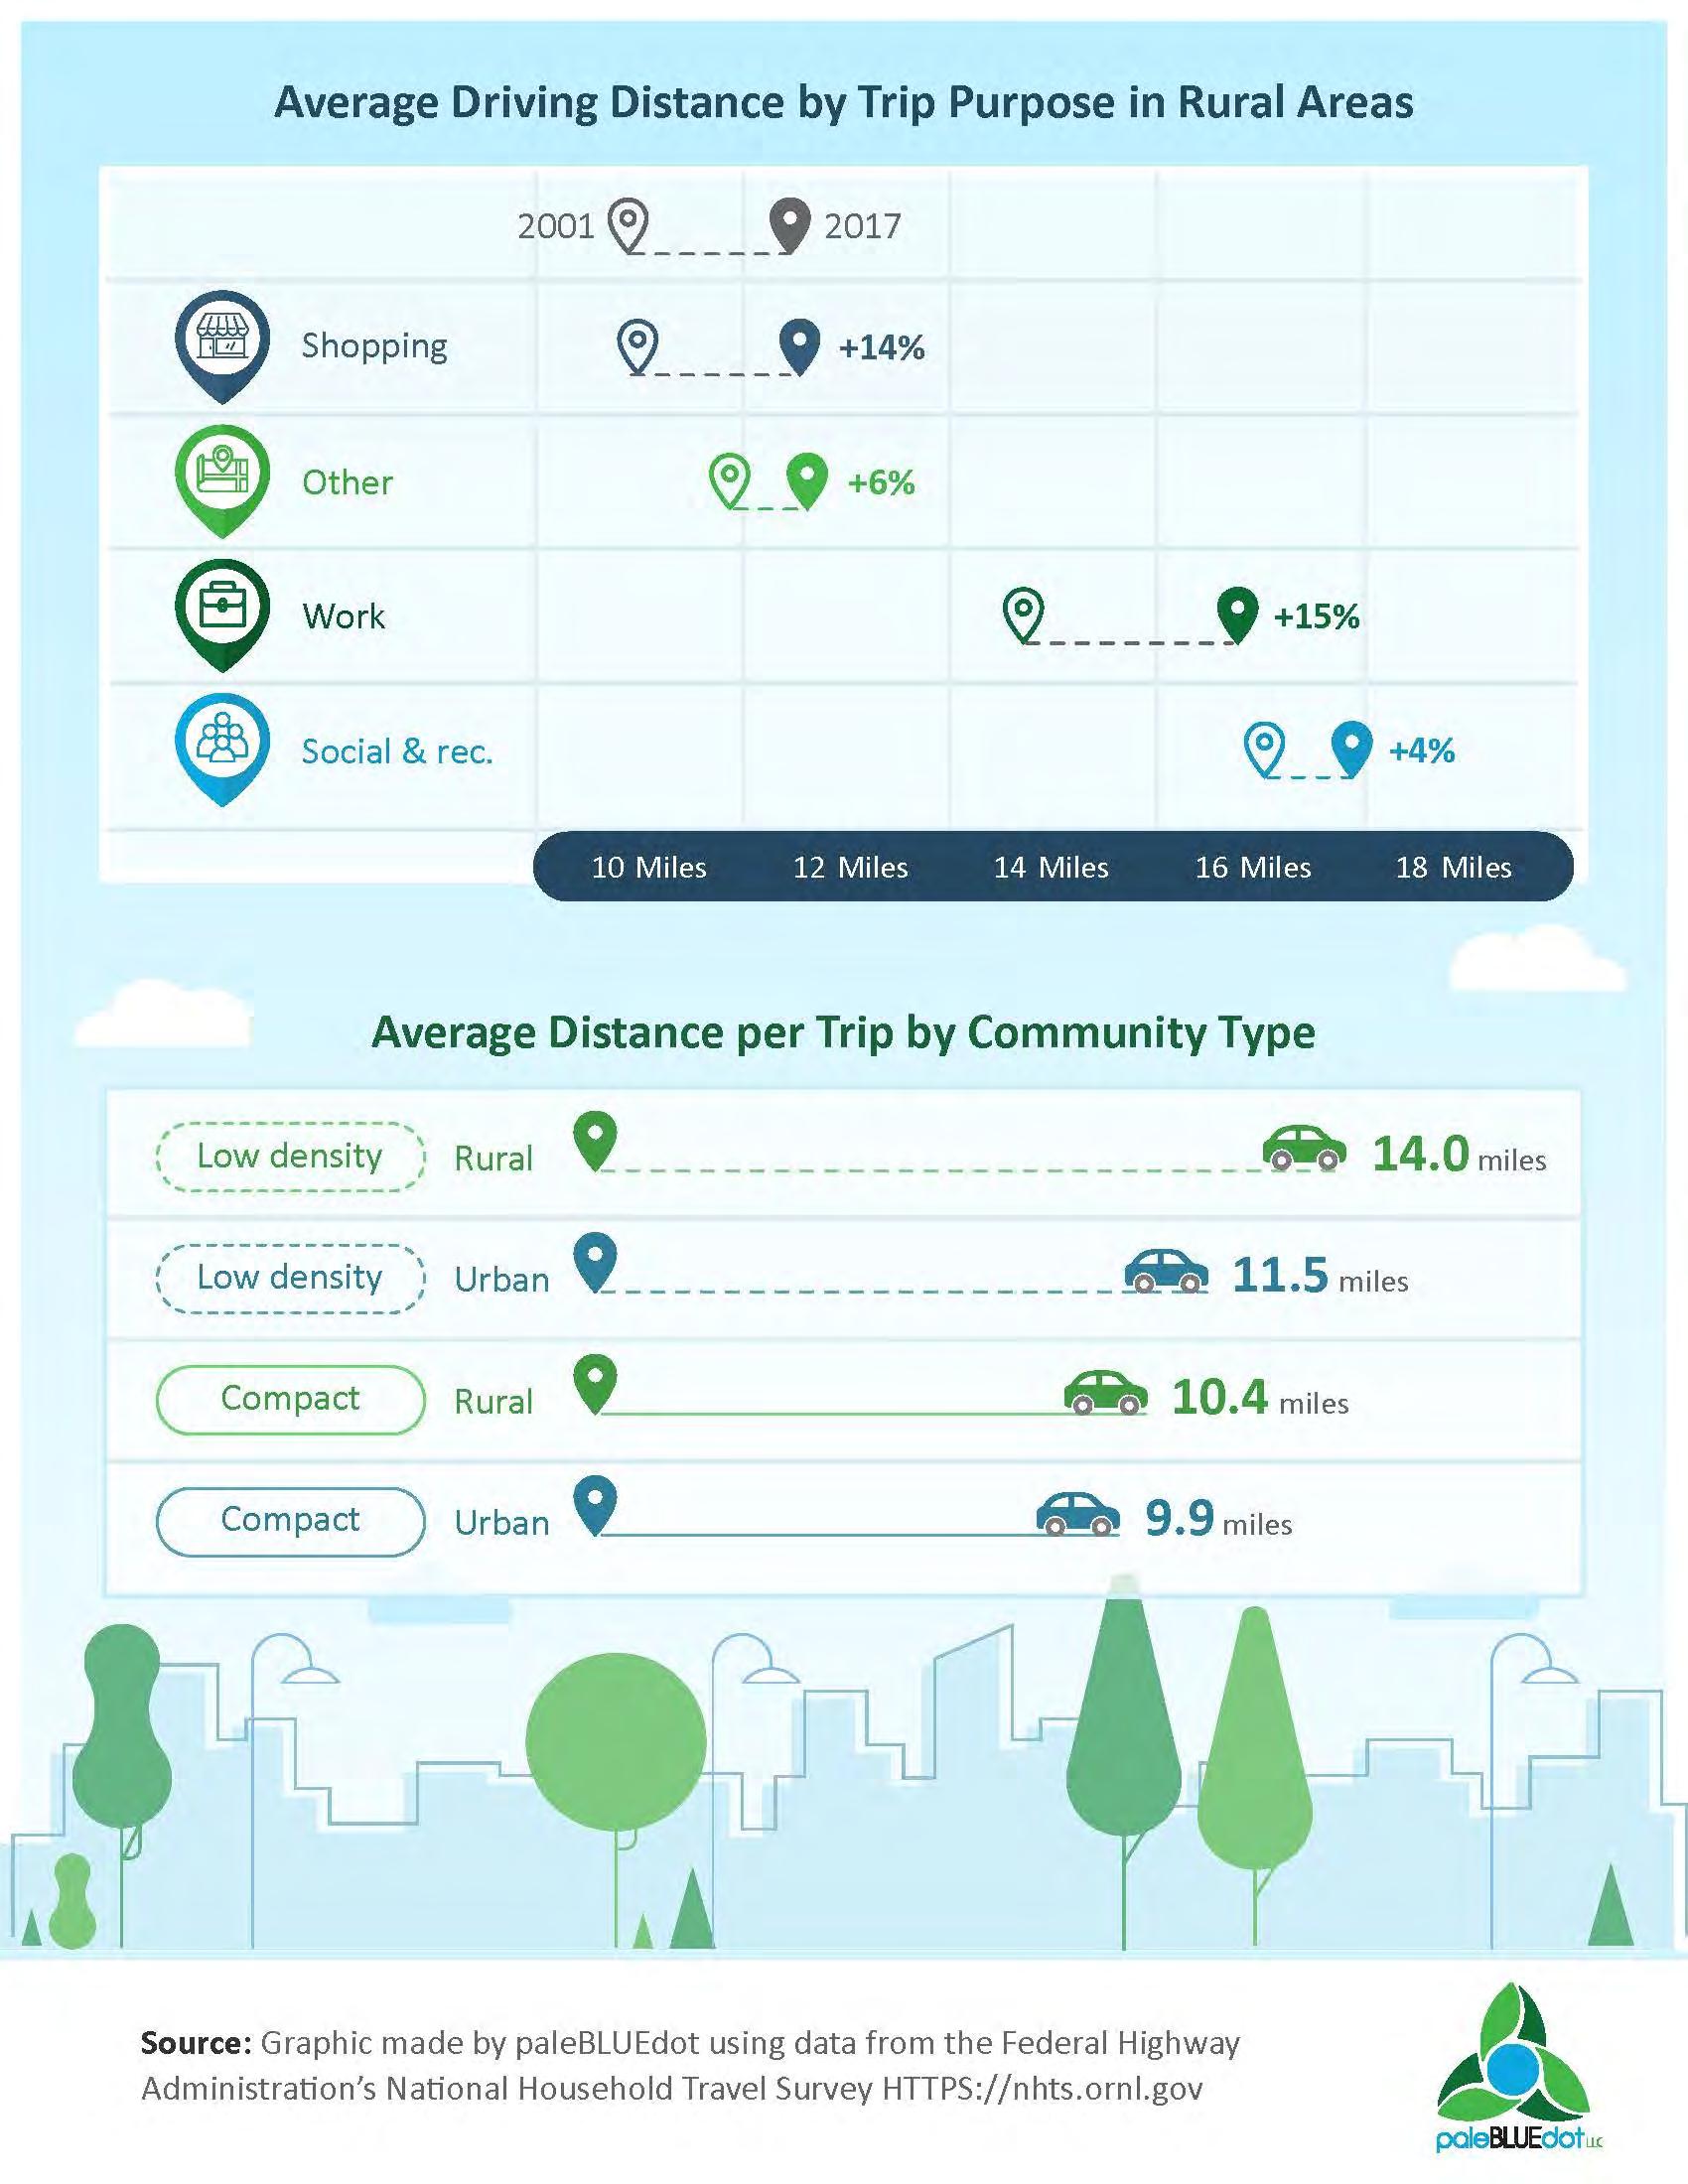
As of 2017, households in rural areas are traveling significantly longer distances per trip compared to 2001, especially for work-related journeys. These extended trips impose greater burdens on rural Americans, impacting their economic opportunities, quality of life, and healthcare access. Furthermore, limited transportation options are compounded by inadequate internet access in dispersed rural communities, where providing infrastructure is costly and private providers lack motivation. Conversely, households in densely developed areas, whether urban or rural, have shorter daily trips.
The higher percentage of seniors 65 and above in rural areas combined with lack of transportation options can also result in isolation. The 2004 study "Aging Americans: Stranded without Options" revealed that elderly individuals who no longer drive make significantly fewer trips for medical appointments (59% less), shopping or dining out (59% less), and visiting loved ones (65% less) compared to those who can still drive. This limited mobility negatively impacts their access to essential services and social connections, underscoring the difficulties faced by rural seniors.
Policymakers representing rural areas have a vested interest in promoting shorter trips to save time and money, reduce emissions, and cater to the needs of millions of rural residents who lack vehicle access or opt for alternative modes of transportation. Key opportunities to improve rural mobility include:
1. Make substantial investments in rural transit infrastructure.
2. Give priority to projects that enhance accessibility and decrease travel distances.
3. Emphasize safety measures for pedestrians, cyclists, and other active transportation modes, particularly within and between town centers.
4. Focus on preserving rural highways rather than expanding them.
5. Foster connectivity among rural communities by making significant investments to improve broadband access
Equity Considerations

Equity in transportation climate actions ensures a fair distribution of costs, benefits, and burdens in mitigating climate change within the sector. Marginalized communities are often disproportionately affected. Key equity considerations include:
Access: Equitable access to affordable, reliable, and sustainable transportation options, improving public transit, bike lanes, and addressing transportation gaps in marginalized areas.

Affordability: Minimizing financial barriers, providing incentives, subsidies, and financing for low-income individuals transitioning to low-carbon transportation.

Jobs: Ensuring impacted workers have retraining, job opportunities, and fair wages during the transition to a green economy.
Strategies
The strategies on the following pages guide our path in meeting our climate goals for the Transportation and Land Use sector. Each strategy is supported by a series of detailed actions to be explored and undertaken in order to carry out the vision and goals. These supporting actions are outlined in the Implementation section of this plan.
Go to Implementation for supporting actions.

Vehicle Miles Traveled MN Region 4 Transit Use Electric Vehicles +2030 Targets
Sector Goals 3.2 billion 3.0 billion 1% 2% 0.8% 15%
Today
+
Average Driving Distance by Trip Purpose in Rural Areas
Average Distance per Trip by Community Type
Source: Graphic made by paleBLUEdot using data from the Federal Highway Administration’s National Household Travel Survey HTTPS://nhts.ornl.gov
Strategy TM 1
Decrease community wide VMT by 5% by 2030.
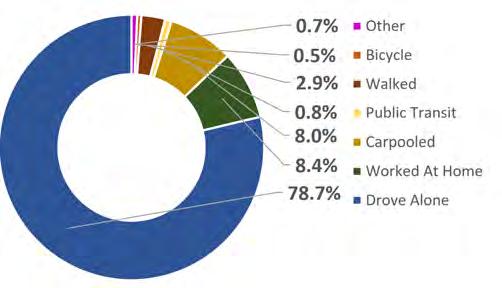
As outlined in the chart to the right, the total vehicle miles traveled (VMT) in MN Region 4 in 2021 was 3.2 billion miles. MN Region 4 has also seen a steady trend in commuter modes with 79% commuters driving alone. Decreasing commuters driving alone by 5% would decrease vehicle miles traveled by up to 160 million miles and reduce region-wide GHG emissions by over 80,000 metric tons annually. Increasing opportunities and safety of bike and walking routes to schools, retail nodes, and recreation centers can support reduced vehicle use for other types of daily trips. Strategy TM 2
Strategy TM 3
Go to Implementation for supporting actions.
Increase public transit commuter ridership from approximately 1% to 2% by 2030.
The average commute in MN Region 4 is 19.1 minutes, or approximately 25 miles. Of the nearly 120,000 jobs in the region, over 78,000 are filled by employees who live in the region. These workers generate an estimated 800 million vehicle miles commuting to and from work. Meanwhile, AAA estimates that the cost per mile for operating a vehicle is $0.74. Consequently, every 1% increase in commuter utilization of public transit in MN Region 4 may decrease vehicle miles traveled by 8 million miles, saving an estimated $5 million annually.
Go to Implementation for supporting actions.
Commuter Transport Share by Mode 2018 MN Region 4 State
Increase electric vehicle (BEV and PHEV) utilization to 15% of community onroad vehicles. (from approximately 1,497 vehicles to 29,400 vehicles regionwide).
According to the US Census data there are an estimated 193,600 vehicles total in the Region. Transitioning community-wide vehicle stock from fossil fuel combustion to low and no emission alternative is critical in meeting significant long-range emissions reductions in this sector. As of September 2022, MN Region 4 had 655 battery electric vehicles (BEV), and 842 plug-in electric vehicles (PHEV). For every additional 1% of vehicles converted to EV over 13,000 metric tons of GHG emissions can be eliminated annually (including emissions associated with increased electricity consumption).
Go to Implementation for supporting actions.

MN Region 4 Vehicle Miles Traveled 2021 VMT 3.2 Billion Miles Driven
of Minnesota
Strategy
Establish viable renewable diesel and/or biodiesel sources to serve region by 2027. Achieve 20% diesel consumption replacement by 2030.
The transition to electric vehicles is a major climate solution, but it's challenging for some dieselpowered equipment due to performance needs and infrastructure issues. Consequently, immediate alternatives are essential for rapid emission reductions. Biodiesel, produced from organic matter and waste biomass oils, can reduce greenhouse gas emissions by over 70% compared to standard diesel. Renewable diesel, typically derived using green electricity sources, can also reduce emissions by 6080%. Renewable diesel also serves as an energy storage for excess renewable electricity. By adopting bio and renewable diesel, we can significantly cut climate pollution from equipment in Minnesota's Region 4 during the shift to zero-emission vehicles.
Go to Implementation for supporting actions.
Strategy TM 5
Achieve 20% conversion of gasoline vehicles and equipment within regional government operations’ fleets to EV's by 2030. Achieve 100% conversion by 2050.
Municipalities can lead the transition to electric vehicles (EVs), showcasing the benefits and feasibility of sustainable transportation. By converting municipal fleets to EVs, cities can significantly reduce their carbon footprint, demonstrating a commitment to environmental stewardship. This shift can stimulate local economies by creating demand for charging infrastructure and electric vehicle services. Additionally, public exposure to municipal EV fleets can increase community awareness and acceptance of electric mobility, inspiring individuals and businesses to follow suit. Therefore, municipalities embracing EVs can trigger broader societal change towards sustainable transportation, emphasizing their role as climate leaders.
Go to Implementation for supporting actions.
Increase fuel efficiency of remaining regional government operations
Strategy TM 6
combustion engine fleets by 5% by 2030.
Enhancing the fuel efficiency of vehicles not yet ready for electrification is crucial in the immediate fight against climate change. Less fuel consumption per mile means less greenhouse gas emissions per mile. As a practical interim measure, it helps lessen the transportation sector's environmental footprint while electric vehicle tech and infrastructure advance. This can be achieved by cultivating fuel-efficient driving practices, such as avoiding abrupt acceleration or deceleration, maintaining ideal speeds, and minimizing idling. Proper vehicle maintenance and selecting high-efficiency replacement components like tires and engines is equally crucial. Vehicles that are designated for replacement but whose use is not yet well suited for electric should be replaced with plug-in hybrid vehicles or others with very high fuel efficiency. These measures collectively amplify a vehicle's fuel economy, marking a vital stride in our journey towards sustainable transportation.
Go to Implementation for supporting actions.

TM 4
Planned Sector Emission Reductions Through 2030
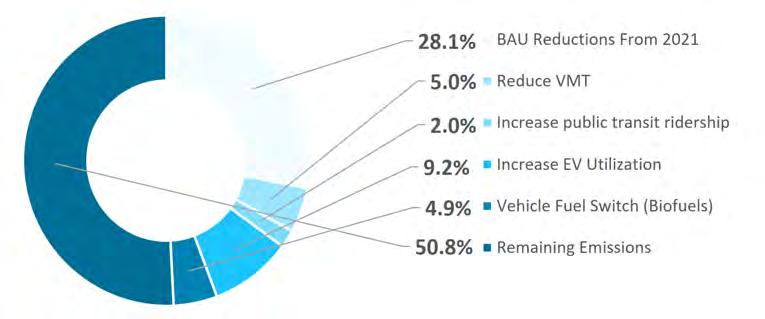
The strategies and actions included in this section of the Climate Action Plan are projected to reduce the region’s annual GHG emissions by 343,000 metric tons (MT) annually by 2030 - a 21.1% reduction from 2021 levels. Changes in business-as-usual impacts over the same period are anticipated to reduce an additional 455,596 metric tons. The result is a total region-wide Transportation and Mobility sector reduction of 49.2% below 2021 levels.
When compared to 2021 emissions, this is equivalent to eliminating over 95,000 of the region’s current vehicles from the road, or 15.7 billion cubic feet of human-made greenhouse gas atmosphere annually by 2030.

Sector Emissions Reduction below 2021 by 2030
The total change to sector emissions include CAP reductions and businessas-usual (BAU) emission changes as follows:
What You Can Do
You can support the goals of the Transportation and Mobility section of this climate action plan as an individual, household, or a business. Here are just a few things you can do:
1. Walk or bike when traveling short distances.
2. Drive an electric, plug-in hybrid or low-emission vehicle.
3. If possible, telecommute or carpool to avoid transportation emissions.
4. Don’t idle your car – even in the winter. The best way to warm up your car in the winter time is by driving it. No more than 30 seconds of warm-up is needed.
5. Keep your personal vehicle well-tuned and tires inflated properly, saving up to 20% in gasoline use.
6. Ditch your grass lawn and plant native pollinators that support our wildlife and don’t require mowing.
7. Replace your lawn equipment with electric
8. Refuel your car and mow your lawn after 7pm, which helps prevent ground-level ozone.


Click here to return to TOC
Buildings significantly influence climate change, contributing to nearly 40% of global carbon emissions through their energy demands and simultaneously being vulnerable to climate-induced risks. They are primary candidates for climate change mitigation, with more energyefficient structures and renewable energy integration helping reduce emissions.
The built environment is increasingly at risk from climatic events, especially in regions like the Midwest. Extremities like heatwaves stress a building's cooling system, resulting in higher energy use and emissions, while impairing occupant comfort and health. Heavy rain and flooding can harm a building's structure and indoor air quality through damage, dampness, and mold. More intense storms with high winds can particularly harm older, less robust buildings, and shifting freeze-thaw cycles can degrade building materials.
These escalating risks underscore the necessity for climate-adaptive building practices. Designs and renovations must consider insulation improvements for temperature extremes, flood-resistant materials and designs, and enhanced structural resilience against high winds. Urban planning strategies, such as green spaces and permeable surfaces, can aid in managing water runoff and reducing urban heat island effects. Buildings throughout the region, as significant climate change contributors and potential victims, must shift towards low-carbon, energy-efficient, and climate-adaptive strategies to mitigate and adapt to climate change impacts.
Saving Money and Reducing Emissions Through the Inflation Reduction Act
The Inflation Reduction Act, enacted in 2022, provides new tax credits to encourage U.S. households to transition to cleaner energy, addressing climate change and potentially lowering energy costs for millions. Key credits include a previously owned clean vehicles credit, offering a maximum of $4,000 for the purchase of used electric vehicles, and an energy-efficient home improvement credit, providing up to $1,200 per year for energy-efficient installations and upgrades in homes. Additionally, the residential clean energy credit supports the installation of clean energy units in homes. The Act protects households from energy price volatility while encouraging cost savings and job creation in the clean energy sector.
Several provisions in the Act synergize with other programs, increasing the benefits of transitioning to cleaner energy. The Act also ensures that disadvantaged communities benefit from these incentives, with a focus on outreach and technical assistance. The new credits lower costs for Americans, stimulate the creation of quality jobs in the clean energy industry, and promote the equitable distribution of benefits.
Equity Considerations
The shift to sustainable energy demands hefty investments in sectors like infrastructure and waste management. However, this transition risks exacerbating social disparities within Minnesota's Region 4 communities. Lack of funds for home upgrades, inability to participate in renewable energy ventures, or inability to afford electric vehicles might marginalize certain groups. As the world pivots away from fossil fuels, these traditional systems might become more expensive to fuel and maintain and less reliable, thereby intensifying the financial strain. Economically disadvantaged individuals may be more vulnerable to climate change effects, having limited resources to manage weather extremes.
Sector Goals

• Home Energy Efficiency Retrofitting: Without financial resources, individuals can't upgrade their homes to be energy efficient.
• Renewable Energy Projects: Many can't participate due to financial constraints.

• Electrification: High upfront costs of switching from fossil fuel to electric heating systems are a barrier for many.


Strategies
The strategies on the following pages guide our path in meeting our climate goals for the Transportation and Land Use sector. Each strategy is supported by a series of detailed actions to be explored and undertaken in order to carry out the vision and goals. These supporting actions are outlined in the Implementation section of this plan.
Go to Implementation for supporting actions.
Region-Wide Renewable Energy Region-Wide Electricity Use Region-Wide Fossil Fuel Heating Use 2030 Targets + -6% 22% 533GWH 453GWH 11.7TrillionBTU 10.5TrillionBTU Today9
Saving Money and Reducing Emissions At Home

Transition to high-efficiency electric heating, cooking, hot water systems, appliances, and electric vehicles, all powered by renewable electricity, to effectively reduce pollution and carbon emissions to zero. For many households, rebates and incentives can help make pay for upgrades to reduce your energy consumption and greenhouse gas emissions.

Below are key steps you can take and links to information on federal tax incentives supporting them included in the 2022 Inflation Reduction Act:
Calculate what your household can get from the Inflation Reduction Act here:
1 2 3 5 6 7 8 9 4 Solar
Insulated
Up
Up
Up
Up
Induction
Up
in rebates Heat
Heating and Cooling Up to $8,000 in rebates Smart Thermostat 1 2 3 4 5 6 7 8 9
Panels 30% tax incentive
Walls, Floors and Attic
to $8,000 in rebates Energy Efficient Windows & Doors
to $850 in rebates Electric Car Up to $4,000 for a used car Up to $7,500 for a new car Heat Pump Water Heater
to $2,000 in tax incentive Heat Pump Dryer
to $840 in rebates
Stove
to $840
Pump
Strategy BE 1
Improve total Region wide residential, commercial, educational, institutional, and industrial building energy efficiency by 10% by 2030. (electricity and heating fuel)

The US Energy Information Administration reports that homes constructed after 2000 consume 15% less energy per square foot compared to those built in the 1980s, and 40% less than those pre-1950. Therefore, there's considerable scope for enhancing energy efficiency by retrofitting older homes with modern technologies. There are over 52,000 homes built before 1980 throughout the region. Making up 54% of owned and 54% of rented homes, upgrading the energy efficiency of these older structures could significantly curb community energy use, especially in terms of heating fuel consumption.
Go to Implementation for supporting actions.
Strategy BE 2
Increase adoption of high performance building construction technology, achieving 1/2% Net Zero households and commercial properties Region wide by 2030.
High-performance buildings, offering 30% more energy efficiency than standard buildings, provide numerous benefits. They reduce energy usage and carbon emissions, advancing environmental sustainability. Lower utility bills result in significant long-term savings. Utilizing advanced materials and technologies, these buildings require less maintenance, further cutting costs. Enhanced indoor air quality and natural light boost occupant health and productivity. Net Zero buildings, a highperformance subset, minimize energy use and generate equal power onsite, typically using renewables like solar or wind. This not only adds resilience against power outages but also yields additional savings. Hence, they are an optimal solution for a sustainable future.
Go to Implementation for supporting actions.
Strategy BE 3
Achieve 20% residential and commercial and industrial building "fuel switching" from on-site fossil fuel combustion to electrification by 2030.
In Region 4, about 82% of heating comes from natural gas, 10% from propane, 4% each from fuel oil and wood. As the regional electric grid expands its renewable electricity share, targeting building heating fuel becomes vital for emissions reductions. To achieve broad-based carbon reductions, it's necessary to reduce and eventually eliminate all fossil fuel heating, including oil, propane, and natural gas. This is where building heating fuel switch to electrification plays a key role. This process involves replacing traditional fossil fuel-based heating systems with electric ones. By doing so, it not only reduces carbon emissions but also improves energy efficiency. Moreover, this transition is a central requirement to achieving regional GHG reduction goals in the building sector.
Go to Implementation for supporting actions.
 Region’s Occupied Homes Built Before 1980
Strategy BE 4
Increase renewable energy from 0.8% to 20% of Regionwide residential and commercial electric use by 2030.
(distributed solar and purchased renewable through utilities)


Expected reductions in GHG emissions from grid-supplied electricity shouldn't diminish the focus on consumer-driven renewable energy purchases to meet our GHG reduction targets. For those unable to install solar panels, buying renewable energy from utility providers or community solar subscriptions offers a path to Net Zero electricity and aids in greening the state's power grid. For properties suitable for solar, increased on-site renewable energy use offers multiple benefits beyond reducing GHG emissions, including cost savings and enhanced energy resilience. This wide array of benefits underscores the importance of increased renewable energy adoption for the community's sustainable future.
Go to Implementation for supporting actions.
Region 4’s Local Governments Leading The Way
Local governments can pioneer climate action by ensuring their buildings are energy-efficient, powered by renewable sources, and heated without fossil fuels. Such initiatives demonstrate commitment to sustainability, set a positive example for residents and businesses, and drive local economies towards low -carbon solutions. This leadership role can inspire broader community engagement in climate action, amplify impact, and expedite progress towards our shared environmental goals. The following strategies are key to achieving this leadership in Minnesota Region 4:
Strategy BE 5

Strategy BE 6
Strategy BE 7
Improve total regional county and municipal government building energy efficiency by 12% by 2030. (electricity and heating fuel)
Achieve 20% regional county and municipal building thermal “fuel switching" from on-site fossil fuel combustion to electrification by 2030.


Increase renewable energy to 25% of region county and municipal government operations electricity consumption by 2030.
Go to Implementation for supporting actions.
MN Region 4 Homes with Wood Heat (for year 2020)
MN Region 4 Homes with Oil Heat (for year 2020)
MN Region 4 Homes with Gas Heat (for year 2020)
Planned Sector Emission Reductions Through 2030
The strategies and actions included in this section of the Climate Action Plan are projected to reduce the region’s annual GHG emissions by 574.070 metric tons (MT) annually by 2030 - a 28.3% reduction from 2021 levels. Changes in business-as-usual impacts over the same period are anticipated to reduce an additional 14,684 metric tons. The result is a total region-wide Buildings and Energy sector reduction of 29% below 2021 levels.

When compared to 2021 emissions, this is equivalent to eliminating over 70,200 of the region’s current vehicles from the road, or 11.6 billion cubic feet of human-made greenhouse gas atmosphere annually by 2030.
Sector Emissions Reduction below 2021 by 2030
The total change to sector emissions include CAP reductions and businessas-usual (BAU) emission changes as follows:

What You Can Do
You can support the goals of the Buildings and Energy section of this climate action plan as an individual, household, or a business. Here are just a few things you can do:
1. Set your thermostat 2 or more degrees higher during cooling season, lower during heating season.
2. Turn down your water heater to 120°.
3. Replace an older home thermostat with a “smart,” programmable model.
4. Replace a major appliance (e.g., refrigerator, air conditioner, furnace) with a newer, energyefficient model.
5. Replace a gas range or clothes dryer with an electric model.
6. Schedule a home energy audit with a licensed contractor or through your utility.
7. Install solar panels at your home, working with a licensed contractor. If possible, participate in a residential solar group purchasing program within the Region.
8. If you don’t own your home (or if your home is not suitable for solar) but support clean, renewable energy, enroll in your utility’s clean power option to support renewable energy.
9. Install ― or have a licensed contractor install ― more insulation in your home.
10. Install energy-efficient windows and doors, working with a licensed contractor.


Click here to return to TOC
Municipal solid waste (MSW) contributes significantly to climate change, primarily through methane emissions from landfill decomposition and carbon emissions from fossil-fuelled transport. Mitigation strategies such as waste reduction, recycling, and organic collection can help reduce these impacts.
Lower waste generation reduces methane emissions by decreasing landfill volume. Improved recycling reduces the need for new resource extraction and manufacturing, saving energy and reducing carbon emissions. Composting organic waste instead of landfilling it lowers methane emissions, sequesters carbon, and provides an eco-friendly alternative to synthetic fertilizers.
MN Region 4 Solid Waste Per Capita Trends
In 2021, MN Region 4 handled 216,171 tons of MSW. Recycling accounted for 22.4% of this total, organics collection for 12.9%, refuse-derived fuel management for 32%, and landfilling for the remaining 32.7%.
Minnesota Waste Stream Changing
A Minnesota Pollution Control Agency study showed changes in waste composition since 2000, with increasing amounts of plastic and food waste but less paper. This shift indicates potential for expanding organics recycling.
Waste Characterization Study


In 2013, the State of Minnesota initiated a comprehensive, quantitative evaluation to understand the make up of the current waste stream (materials not diverted through recycling or organics collection). The classifications of waste defined in the 2013 study were organized into broad categories based on their diversion potential including: Compostables, Potential Recyclables, Potential Recoverables, and Other.
Waste Diversion Potential


Based on the State of Minnesota Waste Characterization Study, there may be waste diversion potential of up to 81.3% in the current landfilled materials (idealized maximum). Below is the breakdown of the estimated total maximum potential waste diversion (excluding waste reduction):

49.1% Recyclable 31.0% Compostable 1.2% Recoverable 18.7% Remaining (81.3% Diversion Potential)
Equity Considerations

Incorporating fairness into solid waste management, such as waste minimization, recycling, and collection of organic waste, guarantees all sectors of the community can access and reap benefits from these services. Overcoming challenges like language, cost, or logistical issues is crucial to encourage widespread participation. Furthermore, food waste reduction could alleviate strains on economically disadvantaged households by redirecting surplus food. Ensuring equity in waste management strategies enhances environmental sustainability while fostering social justice.
Equity Program Examples:
1. San Francisco's Zero Waste Program provides equitable recycling and composting services to all community sectors, overcoming language barriers with multilingual resources.
2. Surplus Food Redistribution Programs like Feeding America reduce food waste by redistributing surplus food from various sources to the needy, aiding lowincome households.


3. The RecycleBank Program incentivizes recycling with rewards, overcoming cost barriers and indirectly supporting economically disadvantaged households.


Strategies
The strategies on the following pages guide our path in meeting our climate goals for the Waste Management sector. Each strategy is supported by a series of detailed actions to be explored and undertaken in order to carry out the vision and goals. These supporting actions are outlined in the Implementation section of this plan.
Go to Implementation for supporting actions.
2030 Targets Sector Goals - + + Total MSW Handled Organics Diversion Recycling Today 216,171tons 205,000 tons 27,872 tons 38,900 tons 48,432 tons 83,250 tons
RECYCLING AND COMPOSTING HELPS


SAVE NATURAL RESOURCES

1,665 GALLONS OF


RECYCLING and COMPOSTING 10,000 TONS of Municipal Solid Waste Save more than 126 BILLION BTU OF ENERGY THAT’S THE SAME AMOUNT
ENERGY USED BY 530 HOMES IN THE REGION ANNUALLY EVERY TON OF PAPER RECYCLED CAN SAVE AS 165 GALLONS OF GASOLINE RECYCLING 1 TON 0F ALUMINUM CONSERVES OVER 153 MILLION
TO 26
OIL
OF
BTUs EQUIVALENT
BARRELS OF
GASOLINE
Strategy WM 1
Decrease total per capita municipal solid waste handled by 5% by 2030.
The MPCA has developed a hierarchy of waste management methods, ranking them based on their environmental impact. This framework gives preference to waste reduction, reuse, recycling, and organic recovery. Essentially, by decreasing the amount of materials we use and throw away, we reduce energy consumption and greenhouse gas emissions from landfills. Households and businesses practicing waste reduction can save substantial sums each year. The ongoing creation of policies and enhancements to operations that facilitate substantial landfill diversion and productive waste stream utilization present a major environmental prospect for Minnesota's Region 4.

Go to Implementation for supporting actions.
Strategy WM 2
Waste Management Hierarchy
Achieve 78% organics waste diversion by 2030. (from 12.9% to 18% of total MSW)

Organic compound breakdown in landfills, being the largest source of methane, presents a considerable opportunity for Minnesota Region 4, as it constitutes nearly a third of the county's mixed waste collection.
Go to Implementation for supporting actions.
State of Minnesota
Strategy WM 3
Strategy
WM 4
Achieve 69% recycling waste diversion by 2030. (from 22.4% to 38.5% of total MSW)
Portions of Minnesota Region 4 residents have good participation rates for recycling. However, the State of Minnesota waste sort and SCORE Reports indicate opportunities for increased capture of paper, plastics, and aluminum.
Go to Implementation for supporting actions.
Establish no/low emission waste-to-energy operations producing biodiesel (or other needed energy) from region’s landfill waste.
Diverting waste from landfills to waste-to-energy plants offers substantial opportunities to generate emission-free energy and fuels, thus contributing to sustainable practices and reducing environmental impacts. Examples include:
• Plasma Gasification: This technology converts waste into syngas, which can be used for electricity or biofuels, and into a safe, reusable slag.
• Anaerobic Digestion: Organic waste is transformed into biogas for heat and electricity and biofertilizer, reducing landfill emissions and offering sustainable energy.
• Pyrolysis: This process heats organic waste, producing bio-oil for biofuel, syngas for energy, and biochar for soil fertility, transforming waste into valuable resources.
Go to Implementation for supporting actions.
Planned Sector Emission Reductions Through 2030
The strategies and actions included in this section of the Climate Action Plan are projected to reduce the region’s annual GHG emissions by 105,404 metric tons (MT) annually by 2030 - an 81% reduction from 2021 levels.
When compared to 2021 emissions, this is equivalent to eliminating over 12,600 of the region’s current vehicles from the road, or 2.1 billion cubic feet of human-made greenhouse gas atmosphere annually by 2030.

Sector Emissions Reduction below 2021 by 2030
The total change to sector emissions include CAP reductions and business-asusual (BAU) emission changes as follows:

What You Can Do
You can support the goals of the Waste Management section of this climate action plan as an individual, household, or a business. Here are just a few things you can do:
1. Compost food and yard waste.
2. Aim to eliminate food waste. Eat existing fridge contents first. Plan meals and shop accordingly. More at https:// www.epa.gov/recycle/ reducing-wasted-food-home.
3. Use LEDs and rechargeable batteries to reduce eWaste.
4. Upgrade, donate, or recycle old electronics.
5. Use reusable bags for all shopping.
6. Swap single-use plastics for durable, reusable alternatives.
7. Opt for items with no, minimal, compostable, or fully recyclable packaging.
8. Repair or donate reusable or repairable items instead of discarding.


Click here to return to TOC
Climate change adaptation in the Midwest is closely linked with water and wastewater management. As global warming alters temperature and rainfall patterns, it impacts water availability and quality, posing challenges for wastewater management. Climate adaptive measures to address the Region’s water risks are essential.
With changing climate affecting water supply, measures like water conservation, efficient irrigation and agricultural techniques, and droughttolerant landscaping – also known as Xeriscape - are vital for an agriculturally dominant region like the Midwest. Implementing efficient water usage can stretch limited water resources to meet needs under fluctuating climate conditions.
Intensified rainfall can overwhelm wastewater infrastructure, leading to untreated sewage seeping into water sources. Adaptive strategies include strengthening wastewater facilities, employing green infrastructure like rain gardens and bioswales to manage stormwater runoff, and preventing contamination.
Changes in water availability and quality also challenge the effectiveness of water treatment plants. Adaptation might involve using advanced treatment technologies or modifying treatment processes to deal with varying water quality.
Incorporating climate forecasts into planning promotes proactive adaptation, enhancing the long-term sustainability of water and wastewater management. By prioritizing resilience through strategies that anticipate climate change impacts, Minnesota Region 4 can secure safe water and effective wastewater treatment, protecting public health, the economy, and the environment.
Regional Water Stress
By 2025, an estimated 1.8 billion people will live in areas plagued by water scarcity, with two-thirds of the world's population living in water-stressed regions. Since 1985 the MN Region 4 region has had a reduction in water yield of approximately 10% to 20%. Through 2050, the Region can anticipate an increase in water demand of 20%.
Equity Considerations
Climate change impacts water scarcity and quality, disproportionately affecting underserved communities lacking resources for adaptation. They often reside in flood -prone areas, risking exposure to untreated sewage. Equity in climate adaptation entails inclusive strategies benefiting all communities. This includes extending resilient infrastructure investment to all regions, supporting lowerincome households' access to water-saving technologies, and prioritizing public engagement in decision-making.
Equity Program Examples:
1. Disadvantaged Communities Involvement – a program in California which allocates funding for water infrastructure in vulnerable areas.
2. Denver Water's Assistance Program - supports lowincome households in acquiring water-efficient appliances, promoting water conservation.
3. Flint, Michigan's Community Engagement and Citizen Advisory Committee - ensures residents participate in decision-making affecting their water security.

Strategies
The strategies on the following pages guide our path in meeting our climate goals for the Waste Management sector. Each strategy is supported by a series of detailed actions to be explored and undertaken in order to carry out the vision and goals. These supporting actions are outlined in the Implementation section of this plan.
Go to Implementation for supporting actions.
Restore replace turf with native prairie and wildflower grasses.
Planning prioritize water + energy efficiency, such as placing plants for home

Outside The Home
Inside The Home
Turn It Off

turn off water when washing dishes and brushing teeth.

Mulch use organic mulches to lessen soil evaporation.
Care avoid improper pruning/fertilizing to reduce landscape water usage.
Under 5 shower in five minutes or less.

Fill It Up

use full loads in your washing


WaterSense replace fixtures with WaterSense labeled products.


Strategy W 1
Promote increased water conservation Region-Wide with a targeted reduction of 6% by 2030.

Reducing water consumption and minimizing wastewater are vital for addressing climate change, as they connect water resources, energy use, and greenhouse gas emissions. Water scarcity is a global concern exacerbated by climate change – and Minnesota Region 4 will be equally impacted. Lowering water usage relieves pressure on freshwater supplies, supporting ecosystems and biodiversity. It also reduces energy demands for water treatment, transportation, and pumping, thereby lowering greenhouse gas emissions. Minimizing wastewater generation is equally crucial as it saves energy and curbs greenhouse gas emissions from treatment processes. These practices foster sustainable development, enhance water security, and build resilience to climate impacts.
Go to Implementation for supporting actions.
Strategy W 2
Mitigate the projected increased flood hazards and impacts due to climate change.
The US National Climate Assessment highlights the significant contribution of the ten rainiest days, which can account for up to 40% of annual precipitation in Minnesota. By 2070, the Minnesota Region 4 is projected to experience a potential increase of up to 15% in total annual precipitation, accompanied by longer gaps between rainfall events. This may result in notably wetter springs with heavier storms. To prepare for such scenarios, it is crucial to evaluate flood-prone areas in the region and assess the adequacy of current stormwater management systems in light of projected extreme rainfall events.
Taking proactive measures can mitigate these impacts, including reduction of impervious surfaces and implementing green infrastructure, enhancing stormwater storage and management capacity, and updating the region plans and standards to reflect the projected impacts of extreme water events.
Go to Implementation for supporting actions.
Strategy W 3
Protect the region’s aquifers and natural waterways and lakes.
Protecting aquifers, natural waterways, and lakes is vital for effective climate adaptation. These water sources are critical for freshwater storage, sustaining ecosystems, and supporting human livelihoods. They ensure water security, enhance ecosystem resilience, and aid in stormwater management. To safeguard them, sustainable groundwater management practices, land use planning that avoids contamination, and preservation of riparian zones are essential. Enforcing water pollution regulations and educating communities about their significance are crucial steps to ensure long-term protection and enhance climate adaptation efforts.
Go to Implementation for supporting actions.
What You Can Do
You can support the goals of the Water and Wastewater section of this climate action plan as an individual, household, or a business. Here are just a few things you can do:
1. Be mindful of your water use and focus on changes in habits such as turning off water when brushing your teeth and taking shorter showers.
2. Trade your shower heads and faucets for WaterSense labeled low-flow, water-efficient options.
3. Replace your lawn with prairie grass, wildflowers, or landscape using Xeriscaping principles. (link to infographic)
4. Collect rainwater in rain barrels to water your lawn and/or plants
5. If you have a lawn and garden irrigation system, or use hoses and sprinklers, water thoroughly less often, and do so in the early morning or evening
6. Install ― or have a licensed plumber install a WaterSense labeled, water-saving low-flow toilet.


Click here to return to TOC
Climate change has serious implications for agricultural resilience and food security. Extreme weather events or shifting climate patterns caused by global warming can lead to inconsistent crop yields and price volatility, making access to nutritious food challenging for many
Meanwhile, our personal food choices can both contribute to and be impacted by climate change. The demand for animal-based products, which have a higher environmental footprint due to their methane emissions and land requirements, accelerates global warming. In turn, the changes in climate affect the production of these very food sources.
Where our food comes from also has direct relationships to climate change. Transporting food across long distances burns fossil fuels and emits greenhouse gases. The extended period of time of long-distance transport increases the need for refrigeration. Refrigeration is carbonintensive. The less transportation and refrigeration needed to supply us our food, the more sustainable it becomes.
Linking Climate Change and Agriculture
The Midwest, America's "breadbasket," is threatened by climate change exacerbated by its agricultural practices, including synthetic fertilizers, livestock methane, and machinery, which emit greenhouse gases. Anticipated climate changes in this region, such as altered precipitation patterns and increased extreme weather and temperatures, pose serious challenges to crop growth, irrigation, and water management.
Sustainable farming practices offer mitigation possibilities. Techniques like cover cropping, reduced tillage, precision nutrient management improve soil health and boost carbon sequestration, helping to decrease atmospheric CO2. Other methods like organic farming, agroforestry, and regenerative farming enhance soil health, biodiversity, and resource conservation, concurrently reducing greenhouse gas emissions. Thus, sustainable farming can help combat climate change impacts.
Economic Potential of Local Food Purchases
Buying food from local sources can reduce the carbon intensity of our diet, reducing our food’s supply chain and curbing greenhouse gas emissions associated with food transportation - while also supporting your small business local economy. Studies have indicated that nearly 32 jobs are created for every $1 million in revenue generated by produce farms involved in a local food market, compared to only 10.5 jobs for those involved in wholesale channels exclusively. Meanwhile, the outdoor and social activity supported by community gardens and increased gardening in neighborhoods have social and community benefits like increasing social cohesion, providing multi-generational activity, supporting outdoor low-impact exercise, and support of plant/animal/pollinator habitat.
Equity Considerations

"Food deserts" often prevail in low-income neighborhoods, where access to full-service supermarkets or grocery stores is limited, leaving residents with inadequate affordable, nutritious food options. This situation, compounded by the prevalence of fast-food restaurants, leads to "nutrition deserts." However, attempts to rectify this via local food programs can unintentionally perpetuate inequities. These programs, typically shaped by the dominant population, may overlook the disenfranchisement of marginalized individuals within the food system. As a result, those unable to afford "local" or organic may remain excluded, perpetuating food insecurity.
Equity Program Examples:
1. Philadelphia Food Trust - an initiative to combat food deserts by partnering with local supermarkets and community organizations to improve the availability of fresh food in underserved neighborhoods.
2. Healthy Bodegas Initiative – a program of the City of New York to transform local corner stores into sources of healthier food.
3. Daily Table is a nonprofit community grocery store chain dedicated to providing fresh, convenient and nutritious food at prices everyone can afford.
Strategies
The strategies on the following pages guide our path in meeting our climate goals for the Transportation and Land Use sector. Each strategy is supported by a series of detailed actions to be explored and undertaken in order to carry out the vision and goals. These supporting actions are outlined in the Implementation section of this plan.
EATING OUR WAY
TO CLIMATE RESILIENCE
6 Ways to Combat Climate Change with Food
Eat ClimateFriendly

The simplest way to increase climate-friendly purchasing is to buy more fruits, vegetables and other plant-based foods.
Waste Less
1/3 of all food produced is wasted and is responsible for 8% of worldwide GHG emissions. Eliminating food waste reduces this impact and address food insecurity.
Protect Soil


Safeguarding farmlands, promoting local, sustainable agriculture, and using climatefriendly practices boosts soil protection and carbon sequestration.

Eat Less & Better Meat
Meat has a high carbon footprint eating less helps. You can also choose lowerfootprint meats like chicken or fish.


Urban Agriculture
Urban farms, from community gardens to rooftop greenhouses, boost fresh food availability, fortify food system resilience, and promote urban sustainability.
Eat Local
Buying local food reduces "food miles", lowers fossil fuel usage and greenhouse gas emissions, preserves local lands, supports wildlife habitats, and encourages availability of fresh produce.

Strategy FA 1
Reduce food waste and hunger, achieve a 50% reduction in food insecurity Region -wide by 2030.
In the US, food waste is estimated at 30-40% of the supply. Based on State of Minnesota information, there is as much as 40-45,000 tons of annual food waste in the Region. This not only contributes to greenhouse gas emissions, but also results in an economic loss of over $50 million yearly, according to the nonprofit ReFed. Beyond economic implications, this wasted food could have helped needy families. As climate change threatens food security by disrupting production, limiting local availability, increasing prices, and reducing safety, food waste reduction becomes vital. It aligns with the region's Climate Action Plan Waste Management goals, enhances community sustainability, and could mitigate food insecurity.
Go to Implementation for supporting actions.
Strategy FA 2
Increase production of and access to local food, particularly serving food insecure and low income individuals.
The national US agricultural system, including specific regions, is susceptible to climate change impacts. Pacific states face challenges from dwindling water supplies, milder winters, and erratic spring weather. Grain production in the Great Plains and Midwest is at risk from fluctuating weather, warm winters, heatwaves, warm summer nights, and flooding. The production of beef, pork, and poultry in the Great Plains and Southeast is threatened by frequent and intense extreme weather and susceptible to disruptions in feed, water, and power supplies, which can occur with extreme weather events and other climate drivers.
While everyone may experience the effects of climate change on the food system, these impacts are likely to be more severe for those already facing low income or food insecurity. Boosting local food system capacity can enhance resilience, food security, job creation, and community wealth-building benefits.
Go to Implementation for supporting actions.
Protect and preserve agricultural land while increasing its resilience to climate shocks.
Local farms enhance food production and resilience, and agriculture along with forestry could contribute 20-30% of the required mitigation to restrict global warming to 1.5°C. Regrettably, climate impacts on farming have escalated over the past 40 years and are set to intensify, adding pressure on agricultural lands and their stewards. Concurrently, over 80 acres of US farmland are lost to development hourly. Preserving this land is key to fortifying the resilience of local food systems. Protecting and preserving the region’s agricultural land is an important component of supporting the resilience of local food systems.
Go to Implementation for supporting actions.
Strategy BE 3
Strategy
FA 4
Increase share of farms using low emissions animal management practices achieving 75% adoption by 2030. (high feed efficiency and low emission manure management)
Adopting low-GHG animal management practices is essential for sustainability in farming. These practices not only minimize resource usage and methane emissions but also bolster animal well-being. For instance, precision livestock farming utilizes technology for optimal animal care, reducing emissions. Effective manure management, another example, helps control methane release. Lastly, integrating rotational grazing and dietary modifications for livestock can further diminish GHGs. Altogether, these practices combat climate change, fostering a more resilient, sustainable agriculture sector.
Go to Implementation for supporting actions.
Strategy
FA 5
Increase adoption of carbon positive soil and crop management practices, achieving 25% adoption by 2030.
Carbon-positive farming techniques, such as cover cropping, reduced tillage, and composting, are indispensable for agriculture. These practices store more carbon in the soil, enhancing its health, increasing crop productivity, and fostering biodiversity. By absorbing more CO2 than they release, they counteract climate change, supporting both the global carbon balance and farm sustainability. The proactive adoption of these carbon-positive practices is key for a resilient agricultural future.
Go to Implementation for supporting actions.
Strategy
FA 6
Increase use of anaerobic digestion, achieving 15% adoption by 2030.
Anaerobic digestion represents a significant opportunity to support climate action by transforming organic waste into bioenergy and fertilizer.. The process involves breaking down organic materials, like food waste or livestock manure, in an oxygen-free environment. The resultant biogas, a mix of methane and CO2, can be harnessed for heat or electricity, replacing fossil fuel usage and reducing our carbon footprint. Additionally, the process reduces methane emissions from decomposing waste a potent greenhouse gas thus mitigating climate change. The by-product, biofertilizer, can be used to improve soil health and fertility, further promoting sustainable agriculture. Therefore, anaerobic digestion serves dual climate action goals: it not only transforms waste into valuable resources but also contributes to a circular economy, reinforcing sustainable and resilient systems.
Go to Implementation for supporting actions.
What You Can Do
You can support the goals of the Local Food and Agriculture section of this climate action plan as an individual, household, or a business. Here are just a few things you can do:
1. Rent a plot at your local community gardens and grow your own.
2. Eat a plant-rich diet. Animal products are extremely GHGintensive to produce compared to plants. Eating less meat and dairy will reduce emissions associated with food consumption. Eating regionally-grown food that is suitable for the Minnesota climate will also make a difference through reduced transportation-related emissions. A great place to start is with “Meatless Mondays” or one meat-free meal a day.
3. Buy food directly from a local grower on an ongoing basis by joining a Community Sponsored Agriculture (CSA) group or frequenting the farmer’s market.
4. Plant fruit or nut bearing trees or shrubs that are well suited for our hardiness zone on your property. Examples include: Trees: Apple, Pear, Plum, Black walnut, Shrub: Serviceberry, Currant.
5. Support restaurants and grocery stores that use and sell locally-grown food.

6. Buy food that is in season, minimizing the distance food must travel.
7. Support your local farmers markets.
8. Buy ethically grown and harvested food, like fair-trade coffee and chocolate.


Click here to return to TOC
Trees and natural ground coverings are instrumental in bolstering regional health, enhancing air and water quality, cutting down energy usage in buildings, and contributing to climate mitigation. Recent research indicates that even simple interactions with nature, like visiting a park or observing a tree, can substantially boost a person's health and reduce stress levels. Consequently, our appreciation of trees has broadened to include their significant mental and physical health benefits. In terms of environmental advantages, trees play an indispensable role in purifying air by extracting harmful pollutants, such as Carbon Monoxide, particulate matter, and Ground -level Ozone. These contaminants can reach toxic levels and trigger asthma and other respiratory issues.
Prairie Grass and Climate Action
Replacing traditional turf lawns with prairie grass and wildflowers serves as an effective climate adaptation strategy. These native species require less water and maintenance, reducing irrigation needs and carbon emissions from lawn care equipment. Their deep root systems improve soil health, enhance water absorption, and increase carbon sequestration, mitigating flood risk and contributing to climate change mitigation. Additionally, they provide habitats for local wildlife, promoting biodiversity. This transformation supports the ecosystem, reduces environmental impact, and fosters resilience against changing climate conditions, making it a sustainable, multifaceted approach to climate adaptation.
The Link Between Impervious Surfaces and Extreme Heat
Impervious surfaces like pavements and buildings in a region contribute to higher "heat island" effects, resulting in increased atmospheric and surface temperatures in developed areas compared to rural ones. This rise in temperature, particularly during summer, heightens discomfort and health risks, especially during heat waves. A 2006 study by Minnesota State University and the University of Minnesota elucidated a ratio illustrating the correlation between a region's impervious surface percentage and the corresponding heat island temperature increase.
Equity Considerations

Lower-income and diverse areas often have less tree canopy coverage, which results in missed benefits such as environmental enhancement, economic gains, and improved quality-of-life. These neighborhoods also suffer disproportionately from the urban heat island effect, characterized by higher temperatures due to fewer trees and more heat-absorbing surfaces like pavements and buildings. Consequently, residents experience increased heat, discomfort, and health risks, further compounding environmental inequalities.
Equity Approach Examples:
1. Targeted tree-planting initiatives in these neighborhoods.

2. Community-led programs for pavement-to-garden and turf-to-prairie conversions to promote local involvement.
3. Policy-driven incentives for green roof installations on buildings, aiming to reduce temperature disparities and enhance residents' well-being.
(831,200 acres by 2040)
Strategies
The strategies on the following pages guide our path in meeting our climate goals for the Greenspace and Trees sector. Each strategy is supported by a series of detailed actions to be explored and undertaken in order to carry out the vision and goals. These supporting actions are outlined in the Implementation section of this plan.
Go to Implementation for supporting actions.

2030 Targets Sector Goals + -Tree Canopy Cover Turf Coverage Dark Impervious Surface Coverage Today 814,700acres 831,200acres 885,150acres 863,000acres 77,400acres 73,500acres
WHY TREES MATTER

The Benefits of Planting Trees
Community


Trees and green spaces enhance life quality and reduce stress levels.
Trees on your property can uplift the whole community
Environment


Trees reduce heat islands by cooling through evaporation and shading.
Trees enhance air quality by filtering dust and harmful pollutants like ozone.

Traffic moves more slowly and safely on treelined streets.
Trees provide habitat, food, shelter, and protection for various wildlife.

Economy


Trees can regulate home temperature, reducing cooling and buffering winter winds.
Welllandscaped homes with mature trees can increase property value by up to 10%.

Through reducing energy demand, trees lower utility infrastructure costs, benefiting consumers.

Strategy GT 1
Increase tree cover, particularly in areas of increased vulnerable population shares 5% by 2040. (an increase of 40,000 acres total)
Our tree canopy reduces storm water runoff, provides clean drinking water, reduces the effects of urban heat islands, decreases energy use in our buildings, sequesters atmospheric carbon dioxide while serving as a long-term carbon sink, and supports increasing economic growth. Increasing tree canopy coverage and health provides critical climate adaptation services. Increases should be prioritized to balance the potential for increased tree canopy with the opportunity to improve tree canopy benefit equity, potential to positively impact as many households as possible, and the need for mitigation of heat island impacts. The suggested tree canopy increases by county shown below prioritizes based on the following weighted criteria:
Potential for new trees: 20%
Population density: 20%
Low-income density (equity adjustment): 30%

Heat island reduction need: 30%
Go to Implementation for supporting actions.
Tree Canopy Increase Over Existing Tree Canopy Area
Strategy
GT 3
Increase pollinator supportiveness of lawns and grasslands in Region and achieve a 2.5% turf replacement with native grasses and wildflowers

Region-wide by 2030. (an decrease of 22,000 acres total)
Replacing lawns with native grasses and wildflowers creates a more authentic, natural American landscape that combats climate change and provides shelter and food for songbirds and other small mammals. Compared to the typical lawn, native grasses improve water quality, reduce air pollution, provide habitat restoration and protection, and increase carbon sequestration. Over 1,085,000 acres of land in the region (21% of all land) is covered in grasses. 82% of all grass land coverage is manicured, mowed lawns with the remaining 18% being native/prairie grasses.
Go to Implementation for supporting actions.
Reduce heat island effect through Region-wide
“dark” impervious surface coverage particularly in areas of increased vulnerable population shares, by 5% from 77,400 acres to 73,500 acres by 2030.
Increased heat island effects raise human discomfort and health risk levels in developed areas, especially during heat waves which are projected to become more severe and more common for the region. There is a direct relationship between impervious surface coverage of a community and the amount of heat island temperature increase, particularly dark impervious surfaces. Dark impervious surfaces are dark colored building and pavement surfaces made from materials that absorb more light than they reflect such as asphalt, black roof membranes. Decreasing the amount of dark impervious surfaces will help decrease heat island and extreme heat and weather impacts in the region.
Go to Implementation for supporting actions.
Strategy GT 2
What You Can Do
You can support the goals of the Greenspace and Trees section of this climate action plan as an individual, household, or a business. Here are just a few things you can do:
1. Plant a rain garden with native plantings to absorb storm water and replenish our aquifers.
2. Plant trees in your yard to provide shade and cooling in summer heat. Select trees suited for the changing climate of Central Minnesota.
3. Replace your lawn and landscape with droughtresistant, native or well-adapted, non-invasive plants.
4. Make your backyard a Certified Wildlife Habitat with the National Wildlife Federation.
4. Remove pavement and increase permeable surfaces. De-pave areas wherever possible to encourage stormwater infiltration onsite.
5. Install bioswales/rain gardens or rainwater diversion systems to reduce impact on the stormwater system.
6. Install a Green Roof (living roof) to reduce your energy consumption. Decrease heat island impacts, and reduce stormwater runoff.
*According to First Street Foundation, these properties have a greater than a 26% chance of being severely affected by flooding over the next 30 years. This represents 14% of all properties in Region 4.


Click here to return to TOC °
The correlation between human health and environmental health is undeniable and profound. In the Midwest, escalating environmental impacts brought about by climate change are expected to aggravate health problems. This is primarily attributable to increasing temperatures, changing rainfall patterns, and the broadening habitat of disease-carrying vectors.
Rising temperatures bring about more frequent heat waves, a phenomenon that escalates the occurrence of heat-related illnesses. Such health issues pose a particular risk to the more vulnerable groups, including the elderly, infants, and those with pre-existing health conditions.
Changes in precipitation patterns could result in more frequent and intense floods and droughts. Flooding often contaminates water supplies, thereby increasing the risk of waterborne diseases. On the other hand, drought conditions raise the likelihood of wildfires and dust storms, both of which significantly degrade air quality and exacerbate respiratory conditions such as asthma and allergies.
Increasing temperatures and general season shift will cause Minnesota’s growing season to expand. The habitat and season of disease-transmitting vectors, including mosquitoes and ticks will expand with it. This could lead to an increased prevalence of vector-borne diseases such as West Nile virus and Lyme disease.
Mental health impacts may see a rise due to the social and economic impacts of climate change. Increased anxiety and stress about the future, as well as trauma from climate-related disasters, could lead to an upsurge in mental health disorders.
The Role of Local Governments in Climate Health and Safety
The effects of climate change pose significant threats to public health and safety. They influence the air we inhale, our weather conditions, the reliability of our food and water sources, and our engagement with both man -made and natural environments. As the climate change impacts continue to grow, so do the health hazards they induce. Local governments and the healthcare industry have long promoted healthy habits like a balanced diet and regular exercise to improve public health. In the same way, it's imperative for local governments to recognize and act on the relationship between climate impacts, adaptation and resilience measures, and community health. After all, the state of our environment plays a crucial role in shaping our public health outcomes.
Equity Considerations
Climate change impacts the health of all community members, however, people within our communities are differently exposed to hazards and some are disproportionately affected by the risks of climate change. According to the National Climate Assessment, greater health risks related to climate impacts can be experienced by some populations in our communities including children, older adults, low-income communities, and some communities of color. Others, like children, older adults, low-income communities, some communities of color, and those experiencing discrimination are disproportionately affected by extreme heat and weather events, and many have increased health and social vulnerability which decreases their access to resources that can help them avoid the risks of climate change.
Equity Approach Examples:
Effectively managing climate impact and health inequities necessitates understanding climate change's varying effects and prioritizing vulnerable groups in adaptive policy implementation. The following are example approaches:
1. Subsidized solutions for home-cooling and accessible public cooling centers can protect vulnerable households during heatwaves.
2. Green infrastructure investments, like tree coverage and community gardens, boost public health by improving air quality and cooling neighborhoods.
3. Enhanced stormwater management and affordable insurance shield low-income communities from rising flood risk.

Strategies
The strategies on the following pages guide our path in meeting our climate goals for the Transportation and Land Use sector. Each strategy is supported by a series of detailed actions to be explored and undertaken in order to carry out the vision and goals. These supporting actions are outlined in the Implementation section of this plan.
Go to Implementation for supporting actions.

Strategy HS 1


Assist the Region’s climate vulnerable populations in preparing for and mitigating climate change impacts. (see the Minnesota Region 4 Climate Vulnerability Assessment for more information)

Local governments should support climate-vulnerable populations, who often bear an unequal share of climate change repercussions. These communities typically lack the necessary resources to adequately prepare for, and recover from, climatic incidents, putting their resilience under enormous stress. Government initiatives can enhance resilience through infrastructural improvements, emergency readiness plans, and climate literacy programs. Such endeavors safeguard not only the vulnerable individuals but also secure the economic and societal continuity of the community, endorsing enduring sustainability amid escalating climatic uncertainties.

Climate change impacts are universal and local government measures should accommodate the adaptive requirements of the entire community. The establishment of a prioritization structure is not an exclusionary practice but rather a crucial step in maximizing the impact and efficiency of finite governmental resources.


Drawing on the insights of the Minnesota Region 4 Climate Vulnerability Assessment, adaptive efforts in the region may be most effectively deployed by prioritizing strategies that mitigate climate risks of extreme heat, air quality deterioration, power/infrastructure failure, and food insecurity. Special emphasis should be placed on strategies that yield the most benefits for seniors over 65, economically stressed individuals, endangered workers, and people with disabilities.
Go to Implementation for supporting actions.


 Vulnerable Populations Risk Sensitivity Chart
Strategy HS 2
Educate, engage, and empower the public on health and safety risks of climate change impacts.
Education is a pivotal tool in catalyzing climate action. By enhancing comprehension of the climate crisis and its implications, education equips individuals with the necessary knowledge, skills, values, and attitudes to serve as catalysts for change. Studies indicate that climate education contributes to emission reduction and decreases susceptibility to both acute and chronic environmental risks.
Effectively countering climate change as a public health menace necessitates preventive strategies such as education and outreach. These can shape individuals' behaviors, aiding in the prevention and reduction of the climate change impact across the community especially on the region's most vulnerable communities.
Go to Implementation for supporting actions.
Strategy HS 3
Ensure that the Region’s mission critical, emergency services, health care facilities, and infrastructure are prepared for impacts of climate change.
Mission-critical services, emergency facilities, health care systems, and infrastructure underpin community resilience. Their disruption during extreme weather can have severe consequences. Local governments, by preparing these infrastructures for climate change impacts, minimize risks, ensure service continuity, safeguard the vulnerable, and save lives. Climate-proofing these services reflects proactive governance, bolsters public trust, and spurs community engagement in climate change efforts. Amid escalating climate threats, such measures are key to sustainable development.
Go to Implementation for supporting actions.
Strategy HS 4
Strengthen community response capacity and social support networks.

Research highlights the significance of social networks during stressful periods, serving as catalysts for collective action and communication. Cohesive communities are more likely to implement climate risk management strategies, withstand severe weather events, and adapt to changing conditions. Some studies even suggest that mutual aid within communities can rival, or even exceed, the importance of emergency services. Therefore, Region 4's local governments can mitigate community vulnerabilities to climate impacts by fostering enhanced social connectivity.
Go to Implementation for supporting actions.
What You Can Do
You can support the goals of the Health and Safety section of this climate action plan as an individual, household, or a business. Here are just a few things you can do:
1. Put together an emergency preparedness kit for your household.
2. Get involved with your community’s Emergency Response Team (CERT) and join your neighbors and receive training to prepare for potential disasters.
3. Prepare your home for the extremes. Understand the risk of extreme weather, extreme temperatures, flooding or wildfire to your home, and take action to safeguard your home.
4. Keep yourself and your family current with physicals, vaccinations and prescribed medications and therapies.
5. Plan and rehearse a fire evacuation plan with everyone who lives in your home or apartment.
6. Have breathing-protection masks available for you and your family for when air quality alerts are declared.
7. Take first-aid and CPR certification training.
8. Notice a person who lives alone. Offer to check on them periodically, especially during extreme weather or a natural disaster.
9. Notice a person who sometimes lacks transportation to their doctor, shopping or other services. Offer to drive them.
10. Notice a person or family who lacks air conditioning in their home or apartment. Offer to have them visit or stay with you during extreme heat events.


Click here to return to TOC
Climate change and the economy are inexorably linked. Left unabated, the impacts of human-made climate change through the end of this century will cost the United States billions of dollars. According to a 2019 study by two EPA scientists, the difference in economic impact between the mid-range climate model (RPC6) and the high range climate model (RPC8.5) may account for as much as $224 billion in economic impact annually by 2090. According to a 2019 World Bank report on trends in carbon pricing, a carbon price range of $40-$80 per ton is necessary as of 2020 to reach the goals set by the 2015 Paris Agreement, while other studies have placed the full cost of carbon at $200-$400 per ton. Using the calculation outlined in Section 10 of the MN Region 4 Climate Vulnerability Assessment (Projected localized annual economic impacts of climate change as outlined in the Climate Vulnerability Assessment divided by annual community-wide GHG emissions as outlined in the Greenhouse Gas Inventory Report), an estimate minimum localized cost for carbon is $40 per metric ton.
The economy is also directly linked to climate action as well. One common concern is that climate action damages the economy. However, climate action today avoids the future costs associated with unmitigated climate change.
Seizing Opportunities of Global Action for The Region’s Economy
The climate crisis has garnered global attention, with over 400 major companies committing to achieve net zero emissions by 2050. Ambitious targets have also been set by nations, as demonstrated in the recent COP27 global climate meeting. China aims to achieve net zero emissions by 2060, while President Biden has pledged to reduce US emissions by 50-52% by 2030 and reach net zero by 2050, with support from the Infrastructure Investment and Jobs Act (IIJA) and the Inflation Reduction Act (IRA). Building local capacity for climate-forward businesses, jobs, and projects in Minnesota Region 4 is vital to capitalize on opportunities and actively participate in the transformative economic shift.
Contrary to concerns about detrimental effects on the economy, climate action can actually support economic development. Transitioning away from fossil fuels, improving public transit systems, and fostering local food industries involve a shift toward local energy and labor sources. This presents communities with opportunities to create wealth by reducing reliance on imported resources and creating local jobs.
This plan outlines essential strategies and actions to boost investments in the local climate action economy and unlock further growth in related sectors. By embracing these measures, Minnesota Region 4 can position itself as a leader in sustainable development and reap the economic benefits of proactive climate action.
Equity Considerations
Climate action presents considerable job development opportunities as well as pathways for equity and social justice. Historically disadvantaged and marginalized communities often bear the brunt of climate change effects yet reap the least from our economy. Hence, it's critical to intentionally structure these emerging green jobs to include these communities and provide fair access.
Investing in renewable energy, energy efficiency, and public transportation can create local jobs that offer livable wages and foster inclusivity. Cost savings from these climate actions can help reduce living costs, offering financial relief to those struggling. With careful implementation, climate action support equitable economic growth.
Equity Approach Examples:
The following are example approaches to equitable climate economy strategies:
1. Job Training and Education: Equity in climate economy actions can be promoted through targeted job training and education programs, enabling historically disadvantaged communities to gain skills necessary for green jobs.

2. Community-led Renewable Energy Projects: Equity can also be achieved by engaging communities, especially disadvantaged ones, in planning and implementing renewable energy projects, providing local jobs and community-wide benefits.
3. Affordable Green Housing Initiatives: By improving energy efficiency and reducing emissions in housing affordably, these initiatives provide jobs, help residents save money, and promote access to all, regardless of income
Strategies
The strategies on the following pages guide our path in meeting our climate goals for the Transportation and Land Use sector. Each strategy is supported by a series of detailed actions to be explored and undertaken in order to carry out the vision and goals. These supporting actions are outlined in the Implementation section of this plan.
The Climate Economy: Impacts, Resilience, and Jobs
Physical Damage Crop Loss
Rising frequency of extreme weather events heightens the risk of property damage caused by flooding and storms.

Increasing floods, droughts, and extreme cold/heat may reduce crop yields by 15% in Minnesota by 2050.

Supply Chain Community Loss


Extreme weather, floods, droughts, infrastructure damage, and blackouts can damage or halt supply chains.
Climate Change impacts are projected to cost local economies 1% to 4% of annual GDP by the end of the century
Learn Identify Include Partnership


Understand the physical risks to the region, industries, individual businesses and the workforce.

Identify the business and industry trends that will affect local employers, investment, and stability.
Incorporate climate risks and opportunities into economic development strategic plans.
Promote dialogue on climate change's economic impacts, foster partnerships, and inspire action.

Efficiency Clean Energy Mobility Savings
Energy efficiency improvements in buildings stimulate job growth and enable new businesses.


Investing in renewable energy creates more jobs and bolsters local economies


Every dollar spent on public transit generates four dollars and twice as many jobs as car investments.

Savings from energy efficiency, renewable energy, and climate actions are reinvested in the local economy.

Capture local economic potential of sustainability and climate action such as renewable energy, energy efficiency, and shared mobility businesses and jobs.
Addressing climate goals globally requires substantial investment over the next 15 years, essential to prevent lasting economic damage. But this expenditure can also stimulate growth.
Bold climate initiatives could result in a direct economic boost of $26 trillion in the U.S by 2030 compared to a "business-as-usual" scenario, as per the World Resources Institute. Simultaneously, the United Nations reports that for every dollar invested in climate action, communities reap an average of $4 in benefits. Post-COVID-19 research suggests that robust climate action and investments are effective strategies for communities to "build back better" from the pandemic while ensuring long-term economic prosperity. These dynamics offer economic development opportunities for communities, especially those planning strategically to leverage this potential.
Go to Implementation for supporting actions.
Increase equitable workforce and entrepreneur development for the Sustainable Economy.
Local climate actions like distributed solar energy and building weatherization create quality 'green' jobs, keeping investments within communities. The Brookings Institute reports that these jobs, crucial for transitioning to a carbon-free economy, provide higher, more equitable wages than the national average.

With lower formal education entry barriers, 'green' jobs pay higher wages to workers with no more than a high school diploma compared to other industries. Given the scientific knowledge and technical skills these jobs demand, they present opportunities for workers to acquire skills that benefit the local workforce in the long run. This means that tackling climate resilience offers an opportunity to bolster economic opportunities for disadvantaged individuals facing systemic barriers to progress.
Go to Implementation for supporting actions.
Example Jobs Needed in Support of the Sustainable Economy
Electricians
Renewable energy designers + installers

Energy analyst
Energy law
Grid integration engineering
Equipment manufacturers
Sales
Energy efficiency consultants
Energy auditors
Heating and air conditioning installers

Contractors (insulation, windows, roofing, etc)

Appliance and equipment manufacturers and installers
Sales
Infrastructure contractors
Transit drivers
Electric vehicle sales
Electric vehicle equipment installers
Electricians + engineers

Bike/scooter sales + repair
Transportation planners
CE
Strategy
1
Strategy CE 2
Strategy
Support local agriculture and businesses operations in building marketplace climate resilience.
The COVID pandemic has vividly demonstrated how disruptions can trigger a domino effect on businesses, workers, and communities, with substantial economic impacts. In 2020, the global economy contracted by approximately 4.3%, or about $3.5 trillion, according to the World Bank.
The economic impact of climate change could dwarf what we've experienced with COVID, as a study by Swiss Re suggests. Even in the best-case scenario - meeting the Paris Agreement climate targets - the annual GDP impact by 2050 equals COVID's impact. In the worst case, with no significant emission reductions, the annual impact could quadruple that of the pandemic. Many of the world's biggest corporations, including Apple, Nestle, and 3M, have integrated climate risk and resilience into their business planning, with nearly half reporting climate-related financial risks nearing $1 trillion.
Small and local businesses, accounting for 44% of total economic activity and creating two-thirds of net new jobs, are similarly susceptible to economic disruption. Strengthening climate resilience within the business community benefits not just business owners but also employees, households, and the broader community.
Go to Implementation for supporting actions.
Establish sustainable financing for the Region’s Climate Action Plan implementation.
Current state and federal subsidies, along with local taxing powers, may not fully fund initial resilience and adaptation investments. This isn't due to a lack of investment value, but a mismatch with traditional financing models. Many resilience investments have short-term costs but long-term value, while others reduce future climate damage without immediate private capital returns.
Communities are exploring new financing tools like climate bonds and public-private partnerships. Some have also begun establishing Climate Funds and emissions trading programs to meet community climate resilience financing needs creatively.
Go to Implementation for supporting actions.
Potential Economic Impact of Climate Change
The expected impact to global GDP by 2050 under different climate change scenarios compared to a world without climate change:
No mitigating actions are taken (3.2°C increase):
Some mitigating actions are taken (2.6°C increase):
Moderate mitigating actions are taken (2°C increase):
Paris Agreement targets are met (below 2°C increase):
Estimated Global Economic Impact of COVID-19 Pandemic:
CE 3
Strategy CE 4
What You Can Do
You can support the goals of the Climate Economy section of this climate action plan as an individual, household, or a business. Here are just a few things you can do:

1. Shop at small, locally owned businesses.
2. Support businesses that have transparent and sustainable practices.
3. Mentor a young person to support them in their studies and careers.
4. Talk to your children about sustainability and how we can all be more sustainable in our daily lives – including our purchases and businesses we support.
5. Encourage the young people in your life to gain job experience and skills development in line with the climate economy such as in renewable energy.
6. Explore opportunities for a climate solutions career, a job in climate tech, sustainability, social impact, or learn more about sustainable career pathways.
7. Access entrepreneurship resources through the State of Minnesota’s Small Business Assistance Office to learn how to start a small business.
8. Explore opportunities for support through the State of Minnesota’s Small Business Environmental Technical Assistance Program.
9. Access information on sustainable business practices through the State of Minnesota’s Pollution Control Agency
10. Create a Disaster Preparedness Plan for your business.

Click here to return to TOC

Cross-Pollinating Actions
CC 1: Continue to Build Internal Capacity for Support of Climate Action Plan Implementation.
CP 1- 1 Explore opportunities to establish, fund and support a Regional Climate Action Coordinator to:
•Convene the MN Region 4 CAP Implementation Team.
•Support the region's county and municipal governments and staff as they implement CAP actions within their service area or area of expertise.
•Facilitate discussion among large users to reduce emissions through business, agricultural, and industrial strategies.
•Participate in technical resource programs as they are available through County, Regional, State, Federal, and non-profit provider partners.
•Ensure the establishment and maintenance of a West Central Initiative Climate Action webpage supporting CAP resources.
•Coordinate and organize volunteer groups and events.
•Engage county and municipal boards and commissions in the region to support CAP is integration into their work plans.
CP 1- 2 Review Climate Action Plan implementation progress and impacts on a regular basis (1-2 year cycle). Review should include development of an updated region wide GHG inventory. Strategies and actions should be reviewed for implementation progress and for continued appropriateness. Based on the review, adjust, add, and remove detailed CAP actions as appropriate.
CP 1- 3 Ensure the creation and maintenance of a coordinated Region 4 CAP Communication and Education Campaign to support public engagement needed for successful CAP implementation.
CP 2: Facilitate External Support Needed for Climate Action Plan Implementation.
CP 2- 1 Establish a MN Region 4 CAP Implementation Team comprised of staff, volunteer commission, and elected official representatives from Region 4 counties and municipalities. The task of the CAP Team should be to meet regularly to support CAP implementation at the county and municipal level, identify initial and ongoing joint action opportunities, establish annual joint action plans, and coordinate joint action implementation. The Team should also serve as a general supportive resource peer group for participating representatives.
CP 2- 2 Establish a Region 4 Climate Champions and Interns program to help promote, communicate, educate, and coordinate actions. Program to seek strategies to empower experienced regional experts in knowledge sharing while providing mentorship opportunities for youth. Program structure to engage volunteer Climate Champions with market specific in key areas (Agriculture Champion, Recycle and Reuse Champion, Greenspace and Trees Champion, Renewable Energy Champion, etc) to support peer-to-peer knowledge sharing as well as public education. Program to include Climate Champion Interns receiving mentorship opportunities from Champions and other regional resources. Climate Champion Interns to participate paid internships supporting implementation of climate actions or community engagement with WCI, local governments, businesses, and institutions.
CP 2- 3 Establish a roster of MN Region 4 Climate Action spokespeople comprised of regional celebrities and well regarded regional community members to support building regional awareness of climate action, benefits, and the region's plan.
Strategy Action
Cross-Pollinating Actions
CC 2: Facilitate External Support Needed for Climate Action Plan Implementation.
CP 2-4 Establish a coordinated Region 4 CAP Communication and Education Campaign to support public engagement needed for successful CAP implementation. The campaign should support the communication and educational needs of each of the CAP sections through coordinated presentations, community events, newsletters, media, and social media. The campaign should also look to help community members:
•Understand climate change in general and within Region 4 specifically, anticipated impacts, and the function and importance of implementing a Climate Action Plan in a "benefits and need" perspective.
•Understand why change at the individual, farm, community, City, and business level needs to occur,
•The role of individuals, households, and businesses in making change
•How to make those changes correctly, and
•What the benefit/incentive to them might be; for example, articulating that switching to solar energy and or an electric bus fleet might help reduce bills
CP 2-5 Establish a youth engagement and program to empower, motivate, and support the region’s youth in the transition to a resilient future and provide an opportunity for their voices to be heard. Program goals may include a focus on turning apathy/fear/depression into action and hope. Examples of program potentials include Youth Climate Storytelling, Youth Climate Action / Design Thinking Forums, and Climate Champion / Climate Internship to provide support in climate action implementation at the local level.
CP 2-6 Explore creating an annual regionall climate action education, resource and celebration event. The event could promote and support climate action through educational programming, "expo" access to resources, and entertainment. Explore building Alliance Opportunities for regional retailers and service providers to exhibit, stage educational sessions, offer incentives, etc.
CP 2-7 Establish and maintain a West Central Initiative Climate Action webpage supporting CAP resources for residents and businesses in the region as well as a resource hub for the region's county and municipal elected officials and staff leaders. Include communication of the Region's plan as well as incentives, programs, resources, and events that can support taking action.
CP 2-8 Explore opportunities for engagement with broad segments of region to increase awareness/enthusiasm. Approaches may include establishing partnerships with arts foundations and artists to enourage and promote climate action oriented art installations.
CP 3: Maintain appropriate funding to support plan implementation.
CP 3-1 Establish and maintain a database of federal funding, incentives, and grants available to support regional and local government climate action implementation resulting from the Inflation Reduction Act (IRA), Infrastructure Investment and Jobs Act (IIJA) and others. Distribute updated information monthly to Region 4 communities and flag potential strategies and actions which may be supported by available funding mechanisms. Support collaborative Region 4 grant submissions.
CP 3-2 Maintain a budget and identify funding sources for staff dedicated to the implementation of the CAP.
CP 3-3 Identify a budget necessary to support projects on an annual basis as per annual implementation plans.
CP 3-4 Utilize no-cost technical assistance offerings as available.
Strategy Action
TM 1: Decrease community wide VMT by 5% by 2030.
TM 1- 1 Improve safety for pedestrians and alternative modes of transportation such as by restoring two-way traffic to one-way streets.

TM 1- 2 Partner with the region's school districts to create and implement Safe Routes to School Plans and to expand bike safety education for students through public workshops and web content.
TM 1- 3 Collaborate with local partners to identify areas which can benefit from improved bike / walk path connectivity and safety, identify strategies for improved safety (such as protected paths parallel to highways rather than on road shoulders) and establish a Path Connectivity Plan with implementation measures and schedule.
TM 1- 4 Develop a public communications campaign and incentives promoting alternative transportation for mid and long-range travel between communities in the region and from outside the region, such as rideshare, carpool, public transit, shuttle, bike, ebike, walk etc
TM 1- 5 Encourage local governments to change ordinances allow and promote small efficient houses and the construction of accessory dwelling units ("ADU") as well as "Tiny Homes" to increase affordable housing opportunities in established neighborhoods. This will add additional housing options for the region's workforce, seniors, families with changing needs, and others for whom ADUs present an affordable housing option.
TM 1- 6 Encourage development of projects within mixed use districts that promote a combination of neighborhood-scale residential, commercial, and institutional uses with pedestrian-oriented design and multi-modal transportation options. Developments should maximize equity considerations and minimize community wide VMT by creating a more walkable, bikeable, and transit friendly community.
TM 1- 7 Conduct a study to identify underutilized paved areas within the region and incentivize conversion to sustainable green space or infill development. Conversion focus should take into consideration neighborhood's greenspace, heat island mitigation, affordable housing, and bike/walk mobility needs and prioritize site utilization based on addressing the greatest needs at each site as determined through appropriate engagement with the community, particularly people traditionally under represented.
TM 1- 8 Encourage local governments to eliminate parking minimums to reduce surface parking. Explore parking pricing models to maintain 85% utilization (performance-based parking, off-street parking tax, dynamic pricing, etc.).
TM 1- 9 Identify environmental impact assessment tools and approaches for rural infrastructure projects to support infrastructure investment choices that support the goals of this Climate Action Plan and climate resilience.
TM 1- 10 Support increased work from home opportunities throughout the region through expansion of rural broadband, and cultural normalization. Explore establishing incentives such as regional tax breaks for home office spaces or supporting local businesses with improved access to technology to enable an increased work-from-home shift.
TM 1- 11 Solicit existing car share, bike share, and eBike share service provider(s) or establish a new program for the Minnesota Region 4 area. Prioritize car sharing providers or programs that focus on EV utilization. Seek models or examples and create a pilot project neighborhood or apartment/housing development car and/ or bike sharing. Existing car share service providers include Zipcar or Hourcar. Person to person carsharing programs include Turo and Get around.
Strategy Action Transportation and Mobility Click here to return to Section
Transportation and Mobility
TM 2: Increase public transit commuter ridership from approximately 1% to 2% by 2030.
TM 2-1 Develop a region-wide Multimodal Transportation Plan (MTP) to facilitate the expansion of strong multimodal transportation connections (walk, bike, carpool, etc) and transit connections within and between municipalities. MTP to identify prioritized active transportation projects in the region, emphasizing multimodal transportation, access to transit, pedestrian safety, bike racks and lockers, beautification, green infrastructure, and a seamless regional multimodal transportation network that favors no and low emission transportation options.
TM 2-2 Collaborate with partners to establish toolkit resources to support regional event organizers in educating attendees about transportation alternatives to the event (rideshare, carpool, public transit, shuttle, bike, ebike, walk etc). Include concepts for incentivizing low-impact transportation options and identify incentives. Promote the toolkit's use region-wide.
TM 2-3 Explore and advance shared mobility options appropriate for the region:
○ electric golf carts on safe routes for day to day needs and “last mile” transit needs (example Starbuck, MN)
○ established bike / walk routes that are plowed
○ Cart sharing
TM 2-4 Explore establishing partnerships with institutions, government entities, organizations, houses of worship, and others to connect low income people to housing and jobs through the provision of transportation options like shuttles, rideshare, carpooling, etc. Program could leverage idle equipment (school buses in the summer) to provide transportation capacity.
TM 2-5 Establish a region-wide taskforce to support advancement of cross-boundary transit and transportation infrastructure planning and coordination. Coordination should include alternative fuel infrastructure.
TM 2-6 Explore establishing a program providing access to shared transportation (vans or buses) system providing alternative transportation between the larger communities within the region.
TM 2-7 Collaborate with local partners to explore use of Shared Autonomous Vehicles (EV) for improved mobility within the region. Establish a pilot program similar to Grand Rapids' May Mobility.
Strategy Action
Click here to return to Section
Transportation and Mobility
TM 3: Increase electric vehicle (BEV and PHEV) utilization to 15% of community onroad vehicles. (from approximately 1,497 vehicles to 29,400 vehicles region-wide)
TM 3-1 Encourage private businesses to offer charging stations for EV's by educating and promoting available federal, state, utility, and regional incentives. Explore grants to support development of additional incentives.
TM 3-2 Support improved awareness of EV technology, performance, operational cost savings and other benefits through organized "EV Ride and Drive" events throughout the region.
TM 3-3 Explore partnerships to develop pilot projects to identify strategies to advance zero emission technology and economic development for the region such as new EV charging technology (example: parking and road embedded inductive charging, etc)
TM 3-4 Create an Electric Vehicle Action Plan (EVAP). An EV Action Plan should: 1) address increased public access to chargers, 2) identify locations for chargers in commercial areas, 3) identify DC Fast Charging locations 4) explore charging infrastructure technologies including streetlight integration, smart cable technologies, bidirectional charging, inductive charging and others 5) address barriers to charging at homes and rental properties (such as households without garages), 6) identify strategies to increase use of EVs in car sharing programs, and 7) assess the potential to partner with third-party EV charging station providers to lower program and construction costs.
EVAP should also consider EV charging needs for the region’s residents and businesses as well as consider opportunities to support EV charging for travelers in ways which support the community as well as the traveler (such as park / outdoor recreation or shopping experiences at charger locations). Plan should identify funding resources such as those from the 2022 Infrastructure Investment and Jobs Act and federal incentives for Alternative Fuel Corridors.
TM 3-5 Encourage local governments to establish an EV Ready Ordinance requiring new developments to have wiring capacity to charge electric vehicles and reserve a percentage of new parking spots for exclusive EV use
TM 3-6 Educate the public on existing state, federal, and utility incentives for efficient and electric vehicles, including tax incentives and at-home electric vehicle charging outlet incentives. Establish a community information and outreach campaign including regional events like the Detroit Lakes 2023 EV Event.
TM 3-7
Promote awareness of resources that identify EV charging station locations (ie smart phone applications).
TM 3-8 Create a pilot project to explore solar powered EV charging station w/battery storage. Pilot project to highlight the effectiveness of this strategy in rural settings where tapping into established electrical grids is expensive or not possible.
TM 3-9 Encourage local governments to establish incentives promoting low or no emission vehicles. Incentives may include financial incentives based on federal or state grant support, or supportive policies such as dedicated and prominent parking areas for EV's.
Strategy Action
Click here to return to Section
TM 3-10
Transportation and Mobility
Collaborate with local partners and electric utilities to study anticipated demands on the region's electric grid associated with increased electric vehicle utilization and create a grid enhancement plan to address demand need. Study should include inovative grid management approaches like vehicle-to-grid (V2G) systems where electric vehicles can be used as energy storage batteries, saving up energy to send back into the grid at peak times.
TM 3-11
Collaborate with state and local partners to identify incentives and support for auto dealerships within the region offering EV, PHEV, and HEV options. Include consideration for increased accessibility to EV options by the region's low-to-moderate income community members (such as through increased used EV vehicle market).
TM 4: Establish viable renewable diesel and/or biodiesel sources to serve region by 2027. Achieve 20% diesel consumption replacement by 2030.
TM 4-1 Leveraging scientific/technological base in the region (University of Morris, etc) to conduct a "Renewable Fuel Study" to identify viable no/low emission diesel vehicle fuel alternatives, sources, and outlets for increasing no/low emission fuel alternative availability and utilization. Study to include analysis of efficiency chain and impact on land use and other communities. Study may include exploration of existing supply chains as well as potential new sources such as through a locally operated biodiesel plant, renewable diesel produced through renewable energy and electrolysis plant, and plasma gasification plant producing hydrogen or renewable diesel.
TM 4-2 Develop a pilot project based on findings of the Renewable Fuel Study to assess opportunities for region wide adoption or production.
TM 4-3 Identify and engage partners to establish adequate bio and/or renewable diesel supply chain for community.
TM 4-4 Encourage and support local governments in converting all county and municipal operations diesel fuel utilization to bio and/or renewable diesel fuel by 2027.
TM 5: Achieve 20% conversion of gasoline vehicles and equipment within regional government operations’ fleets to EV's by 2030. Achieve 100% conversion by 2050.
TM 5-1 Coordinate and conduct an Electric Vehicle Suitability Assessment (EVSA) for county and municipal fleets in the region. The EVSA should include fleet vehicle use case identification and operational monitoring resulting in determination of viable alternative fuel vehicle options for near, mid, and long term replacement. EVSA should include local government “EV Ready” strategy implementation to support conversion of the region's local government fleets and equipment to EV, establish a charging station implementation plan for government facilities, and identification of group purchase options, funding, and incentive.
TM 5-2 Encourage local governments to establish or update vehicle purchasing policy and budget process to default to no / low emission alternative fuel with traditional internal combustion engine (ICE) as optional requiring proof of need. Policy to take emissions/fuel reductions into account when purchasing vehicles/ equipment. Focus on small vehicles as well as large vehicles for alternative fuels. EV replacement to be prioritized for high mileage vehicles.
TM 5-3 Reach out to cities to ask / promote EV fleet studies as cost reduction and maintenance staff time savings for public fleets.
Strategy Action
Click here to return to Section
Transportation and Mobility
TM 5-4 Assemble a team of content experts to present to and encourage counties and municipalities in the region to adopt strategies transitioning from internal combustion engine (ICE) vehicles to EV vehicles. Establish a process to support and promote a series of presentations and listening sessions with local government leaders.
TM 5-5 Collaborate with the region's school districts to study bus fleet electrification and funding approaches and establish a transition plan.
TM 6: Increase fuel efficiency of remaining regional government operations combustion engine fleets by 5% by 2030.
TM 6-1 Encourage local governments to adopt an anti-idling policy and ensure enforcement. Support policy by compiling an "Eco Driving Guide" and provide to local governments to distribute to all employees and include in new employee training.
TM 6-2 Encourage local governments to work with their vehicle lease partners to identify fuel-efficient ICE vehicle lease options achieving a minimum 10% increase in fuel efficiency by 2030 where EVs are not available/ practical.
Strategy Action
Click here to return to Section
BE 1: Improve total Region wide residential, commercial, educational, institutional, and industrial building energy efficiency by 10% by 2030. (electricity and heating fuel)
BE 1-1 Partner with regional utilities and other established Energy Audit/Energy Efficiency Program(s) to accomplish significant residential energy efficiency improvements and make the program accessible to all Region residents, including reduced participation costs for low income households. The program should offer building envelope tests, infrared thermal scanning, light weatherization projects, LED light bulb replacement. Additionally, offer building operations and behavioral suggestions, as well as track carbon, energy, and financial savings Goal: 500 households annually achieving a 15% efficiency increase per location.
BE 1-2 Work with regional electric and natural gas utilities, Minnesota Chamber of Commerce, local chambers, and other partners to establish commercial / industrial energy efficiency audit and upgrade program. Develop specific energy efficiency programs for hard-to-reach segments of commercial properties (e.g., commercial rental, restaurants, affordable multifamily housing, schools). Program to be similar Minnesota Chamber of Commerce’s EnergySmart commercial energy savings program with enhanced energy efficiency targets meeting CAP Goals. Goal: 15% of commercial/industrial buildings by 2030 achieving a 20% efficiency increase per location.
BE 1-3 Implement a residential energy benchmarking (performance tracking and reporting) and labeling program for homes listed for sale.
BE 1-4 Establish and implement an Energy and Water Benchmarking and annual reporting program for commercial, institutional, industrial, and multi-family buildings by 2026. Support improved access to utility data for building owners and managers seeking to improve energy and water performance.
BE 1-5 Promote and distribute education and information to residents and businesses on advantages of and options for energy efficient appliances.
BE 1-6 Promote incentives for improving energy efficiency (e.g., insulation, energy-efficient windows, electric heat pumps) in new construction and retrofit residential and commercial properties. Coordinate with Inflation Reduction Act, Utility incentives and PACE financing information (currently available to commercial properties only).
BE 1-7 Encourage local governments to require county or city financed projects to meet an energy efficiency standard, like Sustainable Buildings 2030 (SB2030), LEED Gold, Enterprise Green Communities, the 24 National Green Building Standard ICC/ASHRAE 700, or an equivalent certification. Consider requiring projects receiving PUD, CUP or other zoning action to meet the energy efficiency standard.
BE 1-8 Conduct a study to explore potential income qualified renewable energy and energy efficiency incentives. Based on study, identify and implement pilot incentive programs and include an overview of potential funding sources including grants such as those from the Inflation Reduction Act.
BE 1-9 Collaborate with the region's local governments to adopt and promote voluntary energy efficiency stretch codes (IGCC, B3 2030, etc). Advocate for adoption of enhanced energy code by state.
BE 1-10 Collaborate with local partners to establish incentives and support for energy audits and energy efficiency upgrades for the region's schools.
Click here to return to Section
Strategy Action
Buildings and Energy
Buildings and Energy
BE 2: Increase adoption of high performance building construction technology, achieving 1/2% Net Zero households and commercial properties Region wide by 2030.
BE 2-1 Establish a Net Zero Energy Building Guide providing building owners, renters, developers, designers, and contractors with detailed information on strategies to make new construction or significant renovation projects Net Zero Energy or Net Zero Energy ready. Include a project strategy checklist for building owners and teams to use and report sustainable strategies used.
BE 2-2 Establish a program to encourage and educate residents and businesses on the benefits of Net Zero Energy and on-site solar, share best practices, providing training, technical assistance, and promote the Net Zero Energy Building and Solar-Ready Guides. Establish a resource hub and include links to helpful resources and tools supporting site owners in exploration and procurement of on-site solar. Include a list of local installers and contractors with high performance building, sustainable construction, and renewable energy experience. Include promotion of rebates and tax credits available for energy efficiency, high performance buildings, and on-site renewable energy, particularly those included in the Inflation Reduction Act.
BE 2-3
Following the completion of an energy audit overview of all county / city facilities, identify potential sites for Net Zero retrofit/renovation. Once completed, create and provide information on the project to the public as an example.
BE 2-4 Develop competitive Request for Proposal for effective and innovative Net Zero pilot projects. Focus on "Net zero building in every neighborhood" to establish visibility of strategies within the community. RFP should encourage high quality mixed use redevelopment on infill properties and existing surface parking lots along transit oriented development corridors. RFP's should focus on equity, affordability, livability, and compliance/support of Climate Action Plan goals.
BE 2-5 Coordinate and promote a regional residential and small business "Electrification and Energy Efficiency/ Weatherization" group purchase campaign annually to help reduce the costs of energy efficient heating systems such as air source heat pumps and ground source heat pumps through volume purchasing power (goal, 200 households and 20 businesses/institutions annually). Program design to focus on improved equity (residential and commercial) in its implementation and explore strategies to support local small business contractors. NOTE: Action may be implemented in combination with the renewable energy group purchase program action.
Strategy Action
Click here to return to Section
BE 3: Achieve 20% residential and commercial and industrial building "fuel switching" from on-site fossil fuel combustion to electrification by 2030.
BE 3-1 Deploy an incentive program for electrification. Work with regional utilities or other regional partnerships to create financial incentives to electrify new and existing buildings. For example, rebates for panel upgrades, electric appliances, Air Source Heat Pumps, Ground Source Heat Pumps, and solar thermal systems can encourage the transition to non-combustion energy use in homes and businesses. Goal: Target 10% residential market conversion (250 households annually) and 5% commercial/industrial market conversion (an estimated 25 commercial businesses, 10 industrial businesses annually) by 2030
BE 3-2 Establish a communication campaign to educate contractors, installers, and homeowners about benefits of electrification and other on-site fossil fuel combustion reduction strategies, currently available technology such as heat pumps, and manufacturer resources for installation training and support. Include promotion of rebates and tax credits available for electrification upgrades and appliances, particularly those included in the Inflation Reduction Act.
BE 3-3 Coordinate and promote a regional residential and small business "Electrification and Energy Efficiency/ Weatherization" group purchase campaign annually to help reduce the costs of energy efficient heating systems such as air source heat pumps and ground source heat pumps through volume purchasing power (goal, 200 households and 20 businesses/institutions annually). Program design to focus on improved equity (residential and commercial) in its implementation and explore strategies to support local small business contractors. NOTE: Action may be implemented in combination with the renewable energy group purchase program action.
BE 4: Increase renewable energy from 0.8% to 20% of Regionwide residential and commercial electric use by 2030. (distributed solar and purchased renewable through utilities)
BE 4-1 Coordinate and promote a residential Solar Group Purchase Campaign annually to help reduce the costs of solar installation through volume purchasing power (goal, 500 households annually). Program design to explore strategies to support local small business solar installers and strategies to support local workforce development.
BE 4-2 Establish a Solar-Ready Guide providing building owners, renters, developers, designers, and contractors with detailed information on strategies to make new construction or significant renovation projects solar ready. Include a project strategy checklist for building owners and teams to use and report sustainable strategies used.
BE 4-3 Establish a Solar Ready Ordinance to require all commercial, institutional, and multi-family buildings to be solar-ready. Support action with Solar-Ready Guide and checklist. Goal 100% solar ready new home construction by 2028.
BE 4-4 Require on-site solar for all commercial properties receiving county or municipal funding or incentives.
BE 4-5 Coordinate and promote a regional initiative for local governments to achieve a SolSmart designation to help improve solar permitting procedures and illustrate community solar readiness.
Strategy Action
Click here to return to Section
Buildings and Energy
Buildings and Energy
BE 4- 6 Require a Solar PV Site Assessment as a part of all new building and major renovation building permit submissions. Assessment should include estimated installation cost, and projections for both energy generation potential and economic payback potential over a minimum 30 year timeframe. Establish relationships with solar installers willing to support these feasibility assessments free of charge or at discounted rates.
BE 4- 7 Establish a regional renewable energy program(s) which increase utilization of on-site / in-community renewable energy while creating benefit for low-income community members. Example programs include City of Dubuque Low Income Solar Renewable Energy Credit (SREC), Leech Lake Band of Ojibwe Community Solar for Community Action, and Texas Energy Poverty Research Institute Community Solar Program Model. Goal: 50 MW clean energy generating capacity delivered through programs annually by 2030.
BE 4- 8 Identify the "Solar Top 50" commercial/industrial properties within the region and produce detailed solar feasibility assessments for each site. Include a "Top 20 Community Solar" study to identify top potentials to support community solar benefits for low income residents. Include exploration of "carport" array options over large pavement expanses. Assessments to include potential solar generation and economic performance and return on investment estimates, information on financing and ownership models, and next step resources. Provide solar assessment reports to properties and conduct an informational workshop to assist building owners and businesses in understanding the assessments, incentives, and next step potential. "Solar Top 50" assessment effort could be repeated annually.
BE 4- 9 Coordinate and promote a commercial Solar Group Purchase Campaign annually to help reduce the costs of solar installation through volume purchasing power (goal, 1100KW installed annually). Group purchase campaign could include/focus on properties identified in the "Solar Top 50" assessment effort. Program design to explore strategies to support local small business solar installers and strategies to support local workforce development.
BE 4- 10 Promote Agrivoltaics throughout the region which facilitate agricultural process under and around solar garden installations. Examples include native plantings with pollinator habitat, sheep grazing, vegetable production etc.
BE 4- 11 Incentivize local renewable energy projects. Explore leveraging existing incentives to increase renewable energy utilization and generation throughout the region. These incentives should include support for lowincome solar installations and the creation of green jobs.
BE 4- 12 Conduct Solar Ready training to provide technical assistance using the Region's Solar Ready Guidelines and listening sessions with the home builders association, contractors, building designers, developers, and building owners. Include information on benefits of on-site renewable energy generation. Distribute the Solar Ready Guidelines and checklist through region, county and municipal channels.
BE 4- 13 Collaborate with the region's electric utilities to establish an on-bill financing option for renewable energy and energy efficiency upgrades.
BE 4- 14 Join the Department of Energy's National Community Solar Partnership and explore utilizing the program's grant and technical assistance support in advancing solar for the region. Encourage the region's counties and municipalities to join the partnership and participate.
BE 4- 15 Identify opportunities for businesses with significant hot water loads (laundromats and hospitals) to install solar thermal technology.
BE 4- 16 Collaborate with local partners and governments to establish a regional "Clean Energy Independence Plan" to identify renewable energy demand and establish a master plan outlining renewable energy development required to achieve it with an implementation plan. Example: Warren Clean Energy Independence Plan
Strategy Action
Click here to return to Section
BE 5: Improve total regional county and municipal government building energy efficiency by 12% by 2030. (electricity and heating fuel)
BE 5-1 Conduct a Building Energy Audit on all primary county / city owned facilities. Fully implement audit recommendations. Prioritization should be given to the county / city's largest energy consuming sites. Implement recommended improvements by 2028
BE 5-2 Encourage local governments to establish a policy that requires all county / municipal buildings to be benchmarked using ENERGY STAR Portfolio Manager. Each primary building's Energy Score rating, and energy use intensity (kBTU/sqft) shall also be posted on the county / municipality's website. Encourage school districts, and other public agencies located within the region to participate in the energy benchmarking and disclosure effort.
BE 5-3 Encourage local governments to establish a Green Building policy that requires all new county/municipal buildings to meet and maintain energy, resource efficiency, and on-site fossil fuel combustion reduction and elimination goals or building standards (ENERGY STAR, LEED, B3 or other). Encourage school districts, and other public agencies located within the region to establish similar policies.
BE 5-4 Establish a program to encourage and educate county and municipal leaders on the benefits of energy efficiency, Net Zero Energy, fuel switching, and on-site solar, share best practices, and providing training. Establish a resource hub for county and municipal leaders and include links to helpful resources and include promotion of rebates and tax credits available for local governments for energy efficiency, high performance buildings, and on-site renewable energy, particularly those included in the Inflation Reduction Act.
BE 5-5 Collaborate with local partners and governments to establish an LED Streetlight Replacement Masterplan, implementation schedule, and funding plan to achieve 100% LED streetlighting region wide by 2030.
BE 6: Achieve 20% regional county and municipal building thermal “fuel switching" from on-site fossil fuel combustion to electrification by 2030.
BE 6-1 Based on county / city Building Energy Audits , identify county / city facilities to prioritize for electrification and schedule improvements in collaboration with the utility provider.
BE 6-2 Encourage local governments to require all new county / municipal buildings to be 100% electric (or zero onsite fossil fuel combustion) by 2030.
BE 6-3 Encourage local governments to participate in the "Electrification and Energy Efficiency/Weatherization" group purchase campaign to reduce fuel switching costs.
BE 6-4 Communicate and promote financing and incentive options supporting fuel switching, such as those supported by the Inflation Reduction Act of 2022.
Strategy Action
Energy
Buildings and
Click here to return to Section
Buildings and Energy
BE 7: Increase renewable energy to 25% of region county and municipal government operations electricity consumption by 2030. (distributed solar and purchased renewable through utilities)
BE 7-1 Conduct a detailed solar assessment and "Renewable Energy Master Plan" for all primary county/city facilities. Include new and existing buildings, incorporate strategies to address electricity storage, and focus on highlighting any hurdles or solutions that would be applicable to the broader community. Region's largest energy consuming properties should be prioritized for assessment. Provide an overview of funding strategies and incentives including those in the Inflation Reduction Act of 2022, and illustrate potential return on investment and operational savings.
BE 7-2 Support installation of solar on all county/city facilities where feasible, based on implementation established in Renewable Energy Master Plan. Explore creation of a Region 4 Group Solar Purchase program to support cost competitive installations for participating local governments.
BE 7-3 Conduct a study to identify potential renewable energy generation potential at all region solid waste and wastewater treatment facilities including on-site generation of Renewable Natural Gas (RNG) and/or plasma gasification.
Strategy Action
Click here to return to Section
Waste Management
WM 1: Decrease total per capita municipal solid waste handled by 5% by 2030.
WM 1- 1 Encourage local governments to establish a policy to make zero and reduced waste events standard for large community events. Implementation to focus initially on local government events with communitywide events as a second phase.
WM 1- 2 Launch a zero waste comprehensive planning process to identify strategies and actions to move the region's communities toward zero-waste. Include detail for counties and municipalities to incorporate into comprehensive plans.
WM 1- 3 Identify and promote reuse and repair businesses and opportunities which can reduce the disposal of used goods.
WM 1- 4 Eliminate petroleum-based, single-use products through phasing out the use of single-use plastics by 2025. Require food service retailers to use biodegradable, compostable or recyclable packaging. Explore the feasibility of establishing a reusable takeout container service. Explore feasibility of establishing a plastic bag or single-use plastic item fee throughout the region. Explore identifying a "social media influencer" restaurant owner in each county to share why they use compostable takeout containers.
WM 1- 5 Encourage, incentivize, and reward sustainable behaviors (refuse, reduce, reuse) through campaigns and competitions. In addition to general efforts, target high impact times/events such as holidays and weddings. Encourage local businesses to run their own campaigns and competitions for employees.
WM 1- 6 Promote or require the reduction of resource consumption of the waste collection fleet through efforts such as alternative fuel, fuel efficiency, vehicle optimization, and other new technologies.
WM 1- 7 Work with and promote existing organizations such as The Exchange and Habitat ReStore reuse programs for increased diversion. Establish coordinated system to make large item pickup easier and expand partnerships for demolition waste pickup and reuse.
WM 1- 8 Create a comprehensive regional communication campaign to provide standardized information and comunication on waste reduction, reuse, recycling and organics collection option and promote existing resources, services, incentives, and programs. Include identification of regional and county resources. Partner with county and municipal departments, Habitat for Humanity's ReStore and other regional recycling and re-use organizations for promotional content sharing. Example campaigns: City of Portland Be Cart Smart, City of Fayetteville Solid Waste Diversion and Recycling Education Plan.
WM 1- 9 Support and encourage local governments to establish government operations zero waste plans and policy to identify strategies to move the municipal operations toward zero-waste. Achieve the waste reduction and diversion goals of this section within government operations by 2028.
WM 1- 10 Support thrift stores as a waste reduction strategy. Collaborate and coordinate with the region's thrift stores to establish and promote Thrift Store Crawl events.
Strategy Action
Click here to return to Section
Waste Management
WM 2: Achieve 78% organics waste diversion by 2030. (from 12.9% to 18% of total MSW)
WM 2- 1 Collaborate with the region's waste haulers to determine capacity for increased organics collection and handling, barriers to reaching organics diversion goals, identify solutions, and recommend pilot projects to test solutions.
WM 2- 2 Encourage local governments to offer increased and consistent collection for food waste and certified compostable material at businesses. Change the type of compost operation or increase land allocation to handle additional feedstock, as needed.
WM 2- 3 Collaborate with residential and commercial waste haulers to establish organics diversion programs for residential and commercial buildings. Explore options such as trash Integrated Food Scrap Compost Collection
WM 2- 4 Encourage local governments to make county and municipal facilities and worksites a model for organics collection by developing a collection program for government-owned and (where possible) governmentleased buildings. Work with local governments to establish a base of possible large volume organizations.
WM 2- 5 Work with the Planning Department to require adequate Infrastructure in multi-family buildings for organics and recycling to ensure diversion is as convenient as garbage. Establish, distribute, and promote design standards or guidelines.
WM 2- 6 Conduct a phased-in commercial organics waste collection project. Explore possible incentives for food retailers, restaurants, and institutions to participate in food waste reuse and recycling programs
WM 2- 7 Land-Use Code Updates - improve commercial and multifamily recycling requirements by revising Land Use Code to require commercial indoor and outdoor space for recycling and diversion equal to or greater than the space provided for disposal. Explore how a Waste Minimization Grant program may support this and other actions.
WM 2- 8 Study low and no emissions waste-to-energy options utilizing organic waste including anaerobic digester and plasma gasification systems. Implement pilot project based on study findings and recommendations.
WM 2- 9 Increase support for back-yard composting for communities without curbside compost pickup including compost education and improved access to materials like compost bags and composters.
WM 2- 10 Collaborate with local partners and school districts to implement food composting programs at the region's schools.
WM 2- 11 Collaborate with local governments to establish requirements for permitted events to provide organics collection.
WM 3: Achieve 69% recycling waste diversion by 2030. (from 22.4% to 38.5% of total MSW)
WM 3- 1 Encourage local governments to develop and enforce ordinances requiring commercial customers to recycle material streams like cardboard, paper, beverage containers, etc
WM 3- 2 Encourage local governments to add more recycling options and info on recycling outside of municipal system; example: Tetra paks can be recycled for just cost of shipping - closest location VA. Facility in MA that will accept Styrofoam. Sponsor a Terracycle box for hard-to-recycle items and a Greendisk box for eWaste.
WM 3- 3 Coordinate with local partners and governments to increase local recycling center hours, change hours, or change collection process in order to ensure access to the center during operational hours convenient for people who work.
Strategy Action
Click here to return to Section
Waste Management
WM 3- 4 Coordinate with local recycling haulers and processors to increase processing capacity, maintain quality sortation capabilities, and provide space for additional material types to be recycled, including e-waste, mattresses, cartons and household hazardous wastes
WM 3- 5 Collaborate with County, State, and other regional waste audit and diversion service providers to develop and fund a waste audit and diversion assistance program for businesses. Program to support businesses in establishing tracking and reporting waste streams, identify reduction, diversion, beneficial use opportunities, identification of potential financing sources, and connect businesses with energy audit and other resources in support of full CAP goals. Goal: 30 business waste audits completed annually with businesses engaged in measuring and diverting waste.
WM 3- 6 Expand consumer education (e.g. host community forums and provide direct outreach, recycling quiz or activity at community events) on sustainable consumption, materials management, available services, incentives, and facilities as well as proper recycling, composting, source reduction methods and accepted materials.
WM 3- 7 Encourage local governments to adopt a deconstruction/diversion ordinance to require the reuse or recycling of salvageable construction and demolition materials. Policy should require that all real estate developments that receive financial assistance from the local government or special zoning approval adhere to a higher standard of recycling and reuse. Include a phased implementation within ordinance as may be needed based on recycling / reuse capacity within community. Actively seek partnerships with Habitat for Humanity's ReUse store and others in support of establishing capacity following the proposed policy changes.
WM 3- 8
Work with local governments in the region to ensure public recycling bins are as readily available as public waste bins in public facilities and locations.
WM 4: Establish no/low emission waste-to-energy operations producing biodiesel (or other needed energy) from region’s landfill waste.
WM 4-1
Conduct a detailed feasibility study for the development of a plasma gasification system using all of the region's municipal solid waste currently being sent to landfill directly, or as RDF reject materials.* Study should include overall feasibility, projected electrical generation potential, identification of beneficial use end products, long-term return on investment, detailed environmental benefit/impact statements, and an identification of implementation challenges, opportunities, and next steps.
* See Renewable Energy Potentials Study for more information on Plasma Gasification
WM 4-2 Conduct a detailed feasibility study for regional potential of anaerobic digesters including wastewater-toenergy installations at regional wastewater treatment plants and agricultural based systems. Identify and implement pilot projects based on findings of the study.
Strategy Action
Click here to return to Section
W 1: Promote increased water conservation Region Wide with a targeted reduction of 6% by 2030.
W 1-1 Facilitate a collaboration with the region's water utilities to create and promote a program focused on reduction of water use by top 20 water consumers annually for each utility through an opt-in program. Offer free technical resources to large institutions and businesses to identify specific opportunities for employees or customers to conserve water and incorporate water efficiency into internal operations.
W 1-2 Establish and promote a program supporting the installation of low-flow water fixtures in residential homes and commercial businesses. Program may be integrated or coordinated with Energy Audit/Energy Efficiency Program(s) in the Buildings and Energy section of this plan. Goal: achieve 500 households and 20 businesses upgraded annually
W 1-3 Promote agricultural land water management (retention) to address shifting weather patterns (spring snow pack and summer drought).
W 1-4 Develop a technical assistance and incentive program to encourage water conservation behavior and upgrades, such as use of drip irrigation and low-flow toilets.
W 1-5 Expand water conservation outreach, communication, and education programs promoting water conservation for residents and businesses.
W 1-6 Encourage local governments to require rainwater collection systems and Water Sense water efficient fixtures and appliances at all local government facility projects and all projects receiving local government funding.
W 1-7 Encourage local governments to install rainwater collection systems at local government facilities for greywater uses, and reuse at existing and new local government facilities and properties.
W 2: Mitigate the projected increased flood hazards and impacts due to climate change.
W 2-1 Encourage local governments to enhance stormwater systems to handle an increase in severe weather events.
W 2-2 Encourage local governments to prioritize managing stormwater before it enters the sewer system through a combination of overland flow, detention, and infiltration strategies.
W 2-3 Collaborate with regional patners to establish an outreach, communication, and education program to promote native landscaping, restore and conserve habitat; encourage rain gardens on private property, avoid turf grass, and convert City-owned space to include stormwater absorption features. Tree selection should consider those on the “Adaptive Planting List” which will thrive in our future local climate.
W 2-4 Identify, encourage, and incentivize programs promoting increased on-site storm water management such as rain gardens, water storage in natural landscapes or in ditches, and impervious surfaces as well as commercial, institutional, and residential sites.
Strategy Action
Click here to return to Section
Water and Wastewater
Water and Wastewater
W 2-5 Collaborate with partners to prepare a flash flood risk map to identify areas within the region that are particularly vulnerable to the impacts of flooding, including details such as tree canopy, impervious surface, heat islands, critical community infrastructure (water wells, wastewater treatment and pump houses, emergency response, power generation, fresh water supply, hospitals, etc.), and vulnerable populations. Based on risk mapping and assessments, create and implement a risk reduction and response plan. Share and promote the information developed by the flash flood risk map, particularly among vulnerable populations and neighborhoods.
W 2-6 Promote, share and create "Actions you can take" fact sheets for businesses, homeowners, rental property owners, and renters. Establish an accessible outreach and engagement plan to reach at-risk properties during infrastructure projects. Incorporate other resources such as "landscaping for absorption" practices (like native plantings, rain gardens, and bioswales) and MyRain Ready.
W 2-7 Encourage local governments to identify lead pipes within region's water distribution network and establish a plan and timeline for replacement.
W 2-8 Coordinate with local governments to ensure region's Stormwater Master Plans incorporate projected increases in precipitation and extreme weather events and address the development/redevelopment of properties currently exempted from stormwater management requirements.
W 3: Protect the region’s aquifers and natural waterways and lakes.
W 3-1 Collaborate with federal, tribal, state county, and Soil and Water Conservation District partners to establish increased water quality testing to increase data availability and support ongoing refinement of water quality actions in the region.
W 3-2 Collaborate with regional resources and partners to explore potential for Phytoremediation (reduction of soil toxicity through plant utilization) and identify pilot projects to implement.
W 3-3 Promote reduced home fertilizer usage, farming practices, and upgrades to wastewater treatment facilities to reduce and eliminate water runoff capable of causing water quality impacts on the region's surface water (such as algae blooms and hypoxia, low oxygen levels, which harm fish)
W 3-4 Contribute to zero occurrences of combined sewer overflows (CSOs) which can result in the opening of the wastewater locks to release untreated wastewater into the region's surface water bodies.
W 3-5 Support and encourage local governments to monitor chemical snow and ice management treatments and update regulations as needed to respond to changing ice, freeze/thaw, and rain events in a way that supports a healthy watershed while maintaining an appropriate level of service and snow clearing; within local government owned properties.
W 3-6 Protecting natural waterways and lakes through addressing invasive species, pollution, recreation, fishing, wild rice etc. Support education and awareness that "explains the why" and supports understanding and "buy in."
W 3-7 Support collaboration in watersheds that cross county and municipal lines. Work with partners to create accessible and useful environmental impact statements (EIS) for residents and businesses. EISs to include a climate change impact, and the options for development available within them need to be widely accessible and easy to adopt.
W 3-8 Public educational gaps need to be bridged on environmental (needs to be tied to $ and health) impacts of particular land-water stewardship practices
Strategy Action
Click here to return to Section
Local Food and Agriculture
FA 1: Reduce food waste and hunger, achieve a 50% reduction in food insecurity Region-wide by 2030.
FA 1-1 Conduct a detailed Food Security Assessment to determine food insecurity conditions within the region and areas with limited access to full service grocery stores and markets (particularly within communities of higher vulnerable populations). Identify areas within the region for improvement, and establish detailed strategies to increase food security within region.
Example: Stevens County Food Resilience Plan
FA 1-2 Work collaboratively with regional partners to establish a region-wide integrated food network to expand partnerships, increase reach, resources, and impact while supporting a credible decision-making body to guide resilient food policy. Support network by establishing a Local Food Coordinator position.
FA 1-3 Explore potential of collaborating with low cost produce providers, convenience stores, and food pantries to increase the distribution and availability of affordable, fresh foods within local food markets serving low income, vulnerable, and food insecure communities while addressing retail and commercial food waste.
FA 1-4 Create Food Forest / "edible walk to school" routes by planting edible trees, shrubs, and planting regionally native vegetables to existing public landscaping (apple, pears, plums, blueberries, strawberries, service berries, etc.) that eventually will allow students walking to school and other community members to pick fresh local food. Select an existing property for a pilot project.
FA 1-5 Establish a communication system, phone app, or social media group whereby local gardeners could donate or trade food (i.e. if one person has too many tomatoes, could offer them to trade or for free pick up).
FA 1-6 Develop an emergency food plan that includes a food needs assessment, scenarios for provisioning necessary food supplies during a range of anticipated emergencies, and a distribution and public communication plan that takes into account those most at risk for food insecurity. Work with local retailers, producers, and warehouses to implement food provisioning scenarios.
Example: Stevens County Food Resilience Plan
FA 1-7 Improve the availability of culturally appropriate food accessible to the region's populations of color, religiously diverse, and limited English speakers. Explore opportunities to expand local development of these goods through engagement with local food producers and promote information on locations and price ranges of uncommon culturally important produce and food products.
FA 1-8 Expand Farmers Markets (particularly year-round market opportunities), local food hubs and marketing of locally produced and organic foods. Efforts to focus on increased community equity and food security among at-risk populations.
Strategy Action
Click here to return to Section
Local Food and Agriculture
FA 2: Increase production of and access to local food, particularly serving food insecure and low income individuals.
FA 2-1 Encourage and partner with local governments to establish community gardens at local government and other publicly-owned spaces, especially those which can serve food insecure or low income community members.
FA 2-2 Explore the development of a region-wide community supported agriculture (CSA) program focused on increasing affordable access to fresh fruits and vegetables for food insecure and low income community members. CSA program to prioritize and incentivize local farmers using or transitioning to regenerative agriculture practices.
FA 2-3 Create a regional mobile fresh food market to bring locally-produced fresh produce and perishable items to communities within the region without farmer's markets or without a grocery store year-round, particularly during winter months.
FA 2-4 Encourage local governments to establish clear urban agriculture ordinances clearly defining the allowability of in-town agriculture including crops, front-yard food gardens, community gardens, urban farms, local food markets, apiaries, and livestock such as chickens, sheep, and goats. Establish an example ordinance toolkit and promote within the region.
FA 2-5 Collaborate with local governments to establish a communication / education effort to clarify the allowances of local food production activities within local ordinances (front yard vegetable gardening, community gardens, urban farming, beekeeping, poultry keeping, etc.) .
FA 2-6 Encourage local governments to pass county / municipal policies to procure locally grown foods from farms that have adopted regenerative management and organic practices for events and other organized food catering requirements. Coordinate with the region's school districts, colleges and universities, and local hospitals to establish similar locally sourced foods procurement policies. Explore development of group purchasing and logistics agreements to increase efficiency of local farm-to-agency process.
FA 2-7 Encourage local governments to establish policies and ordinances or provide incentives for multi-unit buildings and commercial properties to preserve topsoil and provide space for backyard or community gardens.
FA 2-8 Establish "Grow Region Four" community gardens central to target communities within the region. Collaborate with partners to create a support structure (WCI, County, City, school districts, Career Academy, etc) to train community residents and youth how to grow, process, and market local foods
FA 2-9 Support efforts to identify and increase utilization of shared food system assets such as shared food storage space, community commercial kitchens, group purchasing of growing equipment such as backyard greenhouses or hoop houses, and public-private partnerships. Focus resources on support adoption of regenerative management by farmers and increased equality among farmers.
Strategy Action
Click here to return to Section
FA 3: Protect and preserve agricultural land while increasing its resilience to climate shocks
FA 3-1 Conduct a survey of the region's agricultural land and establish a benchmark of regional agricultural resilience practices, establish a benchmark, and practice adoption goals.
FA 3-2 Develop business management capacity to ensure financial viability of farms that adopt regenerative management by creating a Regenerative Farm Vitality Planning Grant Program to support farmers planning long -term financial viability and succession. Provide grants to farmers for advanced management and succession training and consulting to create and implement regenerative farm plans, ensuring that underrepresented farmers have equitable access to these opportunities and support for plan implementation.
FA 3-3 Supplement and coordinate ongoing efforts to ensure that financial assistance for regenerative systems planning and implementation is available and accessible. Explore innovative models that combine training with funding for transitions to regenerative production, including incentives, creative lease agreements, subsidized crop insurance, loan rebates, partial credit, patient or philanthropic capital, or take-off agreements. Analyze and work to overcome barriers to funding identified by underrepresented farmers.
FA 3-4 Engage with regional partners to explore the potential of establishing a West Central Minnesota Ecosystem Service Market to incentivize farmers and who improve the environment through regenerative agriculture practices. Assess how best to capture the variety of ecosystem services provided by small and mid-sized farms. Create recommendations for how those farms can be equitably compensated for outcomes aligning with CAP goals. Evaluate the effectiveness of ecosystem services payment efforts to provide opportunities for farms of all sizes to transition to regenerative production, with particular attention to opportunities for underrepresented farmers.
FA 3-5
Collaborate with partners to establish and promote incentives to encourage smart solar to minimize displacement of agriculture on the state’s best farmland and ensure common sense protections and mitigation measures for the most productive farmland. Survey farmers to identify desired dual use systems and potential policy recommendations and communicate results with key partners. Develop a region-wide smart solar siting report and guidebook for farmers to help navigate a broad and diverse range of solar questions and scenarios. Where possible and appropriate, encourage the wider adoption of thoughtful, farmer-first, right-sized agrivoltaics systems for various production systems.
FA 4: Increase share of farms using low emissions animal management practices achieving 75% adoption by 2030. (high feed efficiency and low emission manure management)
FA 4-1
Collaborate to advocate for and seek additional financial incentives and technical assistance to livestock farmers to implement new or expanded high feed efficiency practices Climate Feed Management (CFM) programs, including both feed amendments (e.g. seaweed, biochar) and improved feed quality (e.g. forage quality). Seek partnerships and to direct additional funding through existing regional farm assistance programs.
FA 4-2 Establish a educational and communications campaign to advance low emission entric fermentation feed management practices including: increased feed quality/digestibility; increased high-quality grazing; feed amendments such as seaweed; and agricultural waste treatment amendments.
Strategy Action
Click here to return to Section
Local Food and Agriculture
FA 4-3
Local Food and Agriculture
Collaborate to advocate for and seek new or additional financial incentives and technical assistance, to improve management of manure to reduce methane and nitrous oxide losses including:
i. Cover manure stockpiles and storage facilities,
ii. Optimize timing and direct incorporation of manure application to soil,
iii. Increase use of fertilizer and manure stabilization products (N-serve, MTM, etc.) to reduce gaseous losses
FA 4-4 Implement a Manure Pit Roof and Cover pilot project to illustrate effective strategies (cost and emission reduction potential) for their implementation. Establish an educational and communications campaign to advance their adoption by farmers community wide. Encourage an National Resource Conservation Service (NRCS) CIG project (Conservation Innovation Grant) to demonstrate benefits and then get NRCS to provide incentive funding
FA 4-5 Establish a educational and communications campaign to promote low emissions manure management practices.
FA 5: Increase adoption of carbon positive soil and crop management practices, achieving 25% adoption by 2030.
FA 5-1 Strengthening the farmer-to-farmer learning and social networks to increase knowledge, skills, and access to resources to implement regenerative practices and business management. Hire, train, and coordinate Champion Farmers across region to serve as mentors focused on adopting and sustaining regenerative systems and supporting business plans. Where appropriate, have these farmers train and mentor service providers, host on-farm demonstrations and research trials, and speak at events. Prioritize support and networks for farmers of all production types and facilitate peer-to-peer guidance for innovative production systems.
FA 5-2 Establish a Regenerative Agriculture Coordinator position to coordinate Champion Farmer activities and support regenerative agriculture projects and practices within this plan as well as others such as composting, perennial cropping, silvopasture, tree intercropping, multi-strata agroforestry, alley cropping, and biochar utilization.
FA 5-3 Collaborate with partners to establish a farm equipment rental or cooperative ownership program for machinery. Focus should be on equipment to improve regenerative farming practices and reduce dependency on chemicals.
FA 5-4 Collaborate with partners to improve data on existing regenerative practices within the region. Identify existing agricultural practices using a combination of currently available data from state and federal agencies and strategic surveys to local farmers. This action should focus on establishing a baseline as well as identify farmers who can serve as Champion Farmers supporting farmer-to-farmer network mentorship.
FA 5-5 Collaborate with partners to develop or expand on a list of emissions, sequestration, and ecosystemservice beneficial practices that can be used in the region and the area's range of cropping contexts (e.g., for corn, soybean, vegetables, etc.). These can be ranked in terms of potential impact, cost, and feasibility. Practices include cover cropping, reduced tillage, nurse cropping, alley cropping, multi-story cropping, stripcropping, conservation cover and crop rotation, low/no chemical practices, and forage and biomass planting.
Strategy Action
Click here to return to Section
Local Food and Agriculture
FA 5-6 Collaborate with partners to establish an educational and communications campaign to strategically trial, measure, then expand use of the practices identified within this plan. Costs can also be tracked to understand incentives that may be required. Adoption should be tracked to assess progress. Consumers and the broader community can also be made aware of these positive practices through events, messaging at grocery stores, etc.
FA 5-7 Collaborate with partners to work with local farmers to promote the use of regenerative agriculture systems (e.g., no-till practices, perennial groundcover, alley cropping, silvopasture, succession planting, rotational grazing practices, etc) through incentives, workshops, and demonstration projects in order to increase carbon sequestration on farmland while also improving soil health and increasing resilience to climate impacts such as drought and flooding.
FA 5-8 Collaborate with partners to advocate for new and additional funding and technical assistance resources to support the practices identified within this plan.
FA 5-9 Collaborate with partners to establish a Region 4 Continuous Cover Program to expand perennial native plantings and promote regenerative agriculture practices including continuous cover, prairie strips, and riparian buffers.
FA 5-10 Collaborate with local governments to promote West Central Initiative’s Agricultural Land Gift program focused on converting land to regenerative practices. Encourage local governments to convert any and all local government-owned farmland to regenerative agriculture systems also.
FA 6: Increase use of anaerobic digestion, achieving 15% adoption by 2030
FA 6-1 Conduct an Anaerobic Digester Master Plan study to identify the current manure volume community wide available for use in new Anaerobic Digesters (single farm or shared facilities), identify financially viable Anaerobic Digester installations to serve the unmet need while maximizing manure volume handled, identify financing mechanisms and ownership scenarios, and establish an implementation plan
FA 6-2 Collaborate with partners to commission a feasibility study of the potential costs, benefits, barriers, and opportunities associated with a biomass “upcycling” facility to convert marginal biomass streams into value -added biomass products. The upcycling facility could include a regional manure composting operation, a mixed substrate composting operation, and a processing operation for biomass harvested from nutrient catch strips and agricultural buffer strips.
FA 6-3 Collaborate with partners to support and catalyze the development of anaerobic digesters in the region through incentives and an educational and communications campaign.
FA 6-4 Collaborate with regional partners to explore the development of a large scale regional, or network of subregional anaerobic digesters.
Strategy Action
Click here to return to Section
GT 1: Increase tree cover, particularly in areas of increased vulnerable population shares 5% by 2040. (an increase of 40,000 acres total)
GT 1-2 Support local governments in creating comprehensive community tree plans. Tree plan should focus on increasing urban canopy cover and include elements such as 1) conducting an inventory of street trees and community-wide canopy cover, 2) determining canopy goals, 3) developing a planting guide that prioritizes carbon sequestration, climate change resilience, and other equitably-distributed co-benefits including reduction of micro-heat islands and increased resilience for areas of highest population vulnerabilities, and 4) devising a plan for retiring trees and addressing unintended consequences such as sidewalk uplifts. The plan should also include potential ways to support trees on private property. Plan should anticipate and account for tree loss.
GT 1-3 Conduct a study to identify public properties throughout the region that could be converted to forest instead of lawns; collaborate with local partners to establish pilot educational "Climate Action Forest Projects" by planting fast-growing, zone-appropriate, high carbon-storing trees.
GT 1-4 Collaborate with regional partners to establish incentive programs and tools to help reduce or share the cost of tree planting and maintenance for residents and businesses, particularly for portions of the region with high micro-heat island risk and vulnerable population shares.
GT 1-5 Educate local elected officials and key government staff on Tree City USA program, benefits of participation, highlight regional Tree City role-models (Fergus Falls, Detroit Lakes), and steps to receive this designation. Include support of public awareness of program.
GT 1-6 Collaborate with regional partners to preserve existing forested areas through practices that re-purpose already developed areas, such as establishing codes that retain minimum canopy cover on new developments and minimize removal of native soil, ground cover, and shrubs.
GT 1-7 Encourage local governments, other regional partners, and private land owners to use a diverse selection of native tree and plant species in new plantings, particularly those that will be most resistant to the stresses of climate change.
GT 1-8 Encourage local governments, other regional partners, and private land owners to manage forests to retain biodiversity, resilience, and ecosystem function and services in the face of climate change. Use best available science to inform fire management and planning to manage ecosystem health, community safety, and carbon storage.
GT 1-8 Support and encourage local governments to establish landscape ordinances including a minimum tree coverage per lawn area or per impervious surface coverage for all new construction or expansion projects. Explore options for decrease of turf grass/lawn coverage and increase of wildflower/prairie grass coverage requirements.
GT 1-10 Encourage local governments to require soil profile rebuilding (by contractor) at all building project sites or compacted soil conditions to reduce erosion and runoff contaminated with fertilizers, increase soil carbon stores, support long-term soil building, and improve new tree survival and growth rates.
GT 1-11
Collaborate with local partners and governments to establish a "free" or reduced cost tree program to support increased tree planting by residents, farms, and businesses throughout the region.
Strategy Action Greenspace and Trees Click here to return to Section
Greenspace and Trees
GT 2: Increase pollinator supportiveness of lawns and grasslands in Region and achieve a 2.5% turf replacement with native grasses and wildflowers Region-wide by 2030. (an decrease of 22,000 acres total)
GT 2-1 Transition maintenance of all local government owned properties to Carbon Gardening practices including elimination of synthetic fertilizer and pesticide use, high mow deck settings, use of biochar amendments, and native pollinator restorations or polyculture lawn mixture.
GT 2-2 Encourage and support local governments in establishing a policy to require the use of native plants in landscaping at local government owned properties. Develop a region park and government facility turf analysis and conversion study to identify lesser maintenance turf and ground cover types, to determine native plant, pollinator restoration, and low / no mow cover opportunities, and help communities establish a conversion master plan.
GT 2-3 Collaborate with regional partners to establish incentives for residents and businesses supporting native prairie grass conversion.
GT 2-4 Complete regional private land conversion opportunity study. Analyze private property for unused turf and impervious areas and implement an education and outreach campaign. and establish incentives for native prairie grass conversion.
GT 2-5 Support and encourage local governments to remove or ease lawn requirements in ordinances in favor of increased priarie grass, wildflower, tree canopy, or garden utilization. Establish a communication/education effort to clarify the allowances of lawn alternatives including native grasses, wild flowers, vegetable gardens, etc.
GT 2-6 Support and encourage region farmers to increase use of native prairie grass and wildflowers. Strategies include contour buffers, wind breaks, edge-of-field buffers, and native grass pastures.
GT 2-7 Collaborate with local partners to develop educational and informational resources on benefits of and strategies for reduced and repurposed lawn space including: native plantings, "carbon gardening" strategies for ornamental gardens, and produce gardens, tree profile rebuilding, elimination of synthetic fertilizer and pesticide use, high mow deck settings, use of biochar amendments, polyculture lawn mixture and other beneficial greenspace practices included in this CAP. Include information on incentives including the State of Minnesota's "Lawns to Legumes" grant.
GT 2-8 Support and encourage local governments to use pollinator-friendly, salt tolerant and filtering plant materials on roads.
GT 2-9 Identify and promote available programs to support local governments and communities in the removal and maintenance of invasive and non-native species.
GT 2-10 Educate public and promote use of compost and local and regional sources, including back-yard compost strategies.
Strategy Action
Click here to return to Section
Greenspace and Trees
GT 3: Reduce heat island effect through Region-wide “dark” impervious surface coverage particularly in areas of increased vulnerable population shares, by 5% from 77,400 acres to 73,500 acres by 2030.
GT 3-1 Support and encourage municipalities to conduct a micro-heat island impact study to identify areas of high heat island contribution and impact, overlapped with vulnerable population mapping from the Region's Climate Vulnerability Assessment. Study to establish specific goals, by census tract, for reduction of impervious surfaces (particularly dark), improvement of tree canopy and greenspace coverage, and target "Heat Island Coefficient". Study to identify priority areas for heat island mitigation based on need, potential, and impact on equity and vulnerable populations.
GT 3-2 Collaborate with regional partners to establish incentives for residents and businesses supporting microheat island mitigation measures including impervious surface reduction, green roof installations, and cool pavement strategies.
GT 3-3 Collaborate with regional partners to develop a "Green Roof" pilot project to educate on and exhibit heat island mitigation strategies and measure potential for effectiveness. Identify a regional building with low solar PV prioritization/feasibility for inclusion as pilot project location. Alternatively, pilot program could be advertised for submission by Region 4 residents, businesses and neighborhoods for potential sites to be considered for pilot project selection. Preference should be given to sites serving low income or at risk communities with high heat island impact potential.
GT 3-4 Collaborate with regional partners to develop "Cool Roof" / "Cool pavement" pilot project to educate on and exhibit heat island mitigation strategies and measure potential for effectiveness. Identify a regional building with low solar PV prioritization/feasibility for inclusion as pilot project location. Alternatively, pilot program could be advertised for submission by Region 4 residents, businesses and neighborhoods for potential sites to be considered for pilot project selection. Preference should be given to sites serving low income or at risk communities with high heat island impact potential.
GT 3-5 Support and encourage local governments to establish or update parking lot guidelines to require planting islands, with a mix of shade canopy trees, shrubs, and groundcovers appropriate to the lot and its surroundings.
GT 3-6 Promote the expansion of tree canopy in urban heat islands or areas that need air conditioning such as schools.
GT 3-7 Collaborate with regional partners to establish an extension service helping communities increase effective greenspaces in every community.
Strategy Action
Click here to return to Section
HS 1 : Assist the Region’s climate vulnerable populations in preparing for and mitigating climate change impacts. (see the Minnesota Region 4 Climate Vulnerability Assessment: https://cutt.ly/o7sR764 )
HS 1-1 Collaborate with local governments and regional partners to establish cooling and extreme weather centers and provide information to communities to ensure vulnerable residents are aware of these services, including direct messaging at community facilities and through health providers, translated to the region’s top non-English languages. Cooling center locations should be located to maximize accessibility by vulnerable populations, particularly those with limited mobility access.
HS 1-2 Collaborate with local governments and regional partners public safety staff is properly trained to recognize and respond to physical and behavioral signs of heat related illness. Conduct climate change impacts and adaptation training for law enforcement, fire, first responders, and utilities. Promote equity in hazard mitigation, and emergency response and recovery activities, and consider populations most vulnerable to weather-related emergencies in all plans and exercises, including evacuation routes, transportation for vulnerable population groups, shelter in place locations, back-up power operations, extended access to fuel/ power sources and drinking water, etc.
HS 1-3 Encourage local governments to incorporate climate change and CAP goals into the Community Health Improvement Plan and Health Impact Assessments.
HS 1-4 Encourage and support local governments in considering populations most vulnerable to weather-related emergencies in emergency response and recovery planning efforts. Considerations include evacuation routes, transportation, shelter in place locations, back-up power operations, extended access to fuel/ power sources, drinking water, and ensuring that there are specific plans for populations requiring mobility assistance. Plans should include steps to identify and help populations disproportionately affected by extended power outages/flooding/etc.
HS 1-5 Collaborate with local governments and partners to ensure emergency communications are available in multiple languages and interpreters are available. Explore use of language specific mobile phone apps or other technologies to support effective translation and communication.
HS 1-6 Assist residents in signing up for state utility and heating bill assistance programs and home weatherization programs.
HS 1-7 Promote local governments to include identification of climate vulnerable populations in the development of public health programs and leverage existing resources to address those vulnerabilities.
HS 1-8 Collaborate with State of Minnesota Pollution Control Agency, regional partners including counties and cities to establish a knowledge network to promote up-to-date science and recommendations for mitigating, reducing, and eliminating PFAS contamination.
Strategy Action Health and Safety Click here to return to Section
HS 2: Educate, engage, and empower the public on health and safety risks of climate change impacts.
HS 2-1 Provide guidance through resource material to social service providers so they are aware of best practices in treating client needs during an extreme heat event.
HS 2-2 Collaborate with local governments and regional partners to establish a communication plan to increase awareness of national, state, regional, and other alert systems. Communication plan to include pathways for when community power and communication systems are non-functional.
HS 2-3 In alignment with the American Public Health Association Policy Number: 201711, collaborate with regional and national industry trade associations, nonprofit groups, and environmental organizations in support of a coordinated communication campaign on hazards of air pollution. Support and encourage local governments to expand outreach to community populations to better educate the public about the hazards including indoor air quality, and the steps individuals can take and available resources to reduce their exposure.
HS 2-4
In alignment with the American Public Health Association Policy Number: 201711, collaborate with educators at local k-12 and colleges to ensure that air quality learning objectives, particularly those related to current and projected climate change impacts, are included in their curricula (e.g., fundamentals of air pollution assessment and control, health risk assessment, environmental justice). Collaboration should include education and training programs for health professionals, including public health, medical, and nursing programs, and science education programs for postsecondary and K–12 science students. All health professionals and students should be informed about steps individuals and communities can take to reduce air pollution, and they should be made aware of services such as the Air Quality Index that can help individuals take appropriate actions to reduce exposures on days when air quality is poor.
HS 2-5
Develop and distribute educational content (brochures, k-12 curricula content, infographics, media announcements, etc) which outlines and actively promotes the clean air and health benefits of strategies included in this CAP plan. Strategies to be actively promoted include use of renewable energy, conservation of energy, use of electric vehicles, public transit, ride share, and walking and biking for transportation. Engagement may include collaborating with public schools on curricula content, visiting local schools to talk about environmental conservation, sponsoring science fairs and asthma awareness days, disseminating information about the Air Quality Index and the UV index, supporting smart growth and green community programs, and working with local government leaders to establish clean air policies and initiatives.
HS 2-6 Explore communication and education strategies to reach different audiences. Consider developing robust climate education app such as a “choose your own adventure” activity/app or other existing tools like the NIH Preparedness app
HS 2-7 Collaborate with state and regional partners to establish a communication and education campaign to inform residents and busiensses within the region on how to protect against PFAS pollution.
-
Strategy Action Health and Safety Click here to return to Section
Health and Safety
HS 3: Ensure that the Region’s mission critical, emergency services, health care facilities, and infrastructure are prepared for impacts of climate change.
HS 3-1 Encourage and support local governments to expand involvement of key community partners such as hospitals in emergency preparedness planning and management. Include the impacts of climate change as emerging threats in future response planning.
HS 3-2 Support local governments in updating emergency plans with specific climate change-related emergency materials. These could include press release templates, information on cooling/heating centers, specific plans for populations requiring mobility assistance, and steps to identify and help populations affected by extended power outages, flooding, etc.
HS 3-3 Coordinate with local governments to develop a debris management plan to support regional response and mutual aid support to severe storm events and flooding.
HS 3-4 Develop a transparent and inclusive decision-making framework designed to achieve climate, equity, safety, health and prosperity goals. Support and encourage local governments to use it when making major infrastructure, transportation, land use, community development and project development plan and investment decisions. Consider existing systems, like STARS and MOSAIC, as models
HS 4: Strengthen community response capacity and social support networks.
HS 4-1 Enhance and support the coordination between local natural resource agencies and vector control programs to ensure populations of mosquitos, ticks, rodents, and other potential disease vectors are managed in a way that protects human health and ensures ecological integrity and vitality
HS 4-2 Support local governments in the creation of "call trees," reverse 911, and block networks to check on neighbors during/after extreme weather events, particularly when they involve grid disruption.
HS 4-3 Support capacity of neighborhood and community groups to implement climate mitigation and adaptation initiatives.
HS 4-4 Support and encourage local governments in ensuring safe and welcoming community spaces for all, including parks, community and youth centers, and city streets and rights of way, located in all areas of the region's communities. Identify areas within region not served by park space within 10 minute walk and develop a master plan to establish effective park spaces to support social connectedness in areas with greatest need, with a priority on equity.
Click here to return to Section Strategy Action
Climate Economy
CE 1: Capture local economic potential of sustainability and climate action such as renewable energy, energy efficiency, and shared mobility businesses and jobs.
CE 1- 1 Conduct a Climate Economy Economic Development Assessment to identify economic opportunities possible through the successful implementation of the Climate Action Plan and achievement of its goals, especially those which can provide opportunity for the region's vulnerable populations. Establish a campaign to communicate findings, job creation potential of the strategies included in the CAP, and promote action.
CE 1- 2 Develop workforce training capacity to assess, train, and place laborers that can take on energy efficiency and renewable energy projects. Structure program to increase participation of under-resourced communities and increase opportunities for equity.
CE 1- 3 Promote alternatives to traditional building demolition such as relocation, deconstruction and salvage. Establish a jobs training program focused on building workforce with deconstruction skills and capacities. Job training program should focus on establishing job skills and placement for low income individuals.
CE 1- 4 Collaborate with regional partners including local governments and school districts to conduct a "Climate Immigration and Migration Response and Opportunity" study. Study to identify potential school district service, affordable housing, and other needs which may be required to support potential and likely migration into the region. Study should include identification of potential benefits of promotion of climate migration into the region and identify actions to maximize workforce and economic development potential of climate migration.
CE 1- 5 Collaborate with partners to establish a Green Jobs apprenticeship and internship program. Promote and subsidize internship placement with local employers.
CE 1- 6 Work with local partners to develop a community green jobs electronic bulletin board, or LinkedIn group, promoting local green job opportunities.
CE 1- 7 Collaborate with local partners to explore opportunities for solar panel and battery recycling business development for region and establish a pilot project.
CE 1- 8 Collaborate with local partners to establish a communication campaign informing the public on current and future job and economic development opportunities of represented by the strategies in the CAP for the region (such as local job creation from renewable energy, etc.)
CE 2: Increase equitable workforce and entrepreneur development for the Sustainable Economy
CE 2- 1 Establish a regional business incubator to support the establishment of innovative energy efficiency and renewable energy and sustainability business models within the community. Structure incubator to increase participation of under-resourced communities and increase opportunities for equity.
CE 2- 2 Encourage local governments to prioritize local businesses when contracting for government-financed energy efficiency and renewable energy projects, with special consideration given to businesses owned by women and minorities.
CE 2- 3
Fund and organize the establishment of a ReStore Facility for reusable furnishings and salvage including construction/demolition.

Strategy Action
Click here to return to Section
CE 2-4
CE 2-5
Climate Economy
Work with local unions and businesses to ensure that apprenticeship program includes solar training.
Collaborate with local partners to identify underutilized or unused buildings within the region's town centers and identify potential uses, especially those which will promote and foster sustainable business development and entrepreneurship while increasing appropriate community density and decreasing community sprawl. Establish and promote a re-use master plan and implement a promotional campaign to encourage opportunities. Explore issuing a Request For Proposals for redevelopment pilot projects.
CE 2-6
Collaborate with local partners to explore opportunities to support new businesses utilizing recycled materials through the expansion of the Fergus Falls Precious Plastics Lab.
CE 3: Support local agriculture and businesses operations in building marketplace climate resilience.
CE 3-1
Strengthen public-private economic communications in support of climate resilience, climate economic opportunities, and the goals of this plan. Effort should focus particularly on communications with disadvantaged group businesses (minority-owned, veteran-owned, economically-disadvantaged, etc.) and small businesses.
CE 3-2
Collaborate regional Chamber of Commerce, West Central Minnesota Ag Producers, economic development directors, and local businesses to identify industry specific economic impacts to Minnesota Region 4 businesses (particularly farmers, small businesses and disadvantaged group businesses) face based on the climate change based on risks and hazards identified in this report, the Climate and Vulnerability Assessment, and emergency management plans in the region. Collaborate with businesses to Identify economic resilience strategies in response to those economic vulnerabilities and conduct outreach to industry groups and public-private partnerships to promote private sector investment addressing them.
CE 3-3
CE 3-4
Collaborate with partners to ensure redundancy in telecommunications and broadband networks to protect jobs, commerce and public safety in the event of natural or manmade disasters.
Collaborate with the regional partners to explore the need, value, and potential of an online assessment of business’ vulnerability/resiliency. Assessment tool could include topics such as:
Available incentives or tax breaks
Zero waste improvements
Water conservation
Flood and flash flood mitigation
Extreme heat and weather preparedness of workforce and facilities
Energy resilience
Climate resiliency
Energy: efficiency and renewables
Emergency response
CE 3-5 Work with community businesses to explore the creation of an incentivized “buy local” campaign to enhance resilience of small local businesses.
CE 3-6 Collaborate with local partners and governments to establish a campaign to communicate and promote the efforts of local businesses to increase sustainability and implement climate action within their business models.
Strategy Action
Click here to return to Section
Climate Economy
CE 4: Establish sustainable financing for the Region’s Climate Action Plan implementation.
CE 4- 1 Utilize state and federal funding, incentives, and grants available to support local government climate action implementation resulting from the Inflation Reduction Act (IRA), Infrastructure Investment and Jobs Act (IIJA) and others.
CE 4- 2 Explore the potential of collaborations with donors, philanthropists, and non-profit foundations to develop a Climate Action and Equity Fund for Minnesota Region 4, or within each county of Region 4.
CE 4- 3 Support and encourage local governments to establish a policy that accounts for all energy efficiency and renewable energy operational cost savings of government buildings and fleets. All savings to be invested into a Climate Action Fund as one source of financing for the local government's climate action efforts.
CE 4- 4 Conduct a study to establish an Urban Forestry Product program to sell wood products, and dedicate funds to climate action plan strategy implementation. Revenue sources could include: sale of Ash tree logs removed as a part of the region's EAB management plan, selling tree storm debris and tree trimming waste to waste-to-energy plant or pelletizer, selling sugar taping rights to Maple, Birch, and Walnut trees located on public property and right of way responsibility, etc.
CE 4- 5 Explore creation of a Region 4 Carbon Fund carbon offset program which enables investing in local or regional project carbon offsets.
CE 4- 6 Explore creation of a Minnesota Region 4 Forest Credit program to fund local tree canopy increases, urban and rural tree maintenance, and provide carbon offset credits.
Strategy Action
Click here to return to Section
Climate Action Baseline Study
To support the Minnesota Region 4 Climate Action Plan planning team members, the paleBLUEdot team assembled the Climate Action Baseline Study. This document provided a review of a wide range of community-wide metrics, data, and comparisons against regional peer communities for each of the climate action plan sectors included in this report. The document also included preliminary sector specific draft strategic goal recommendations for the Climate Action Plan planning team to consider, discuss, and revise at the beginning of the planning team effort.
Click on the link below to access the document:
https://view.publitas.com/palebluedot/mn-region-4-climate-aciton-baselineand-reduction-recommendations/
Climate Vulnerability Assessment
At the beginning of the Climate Action Planning effort, the paleBLUEdot team developed a Climate Vulnerability Assessment for Minnesota Region 4. The assessment included the identification of vulnerable populations within the community and possible impacts and risks associated with projected climate change for the region. paleBLUEdot mapped the vulnerable populations within the Region as well as existing infrastructure and resources which may be capable of supporting climate adaptation strategies. These assessments provided a basis for understanding vulnerabilities and resources which supported the decision making process needed for identifying and prioritizing climate adaptation measures to be included in the final Climate Action Plan. The Assessment focused on Region-Wide vulnerabilities with a particular focus on climate vulnerable populations to ensure all populations benefit from proposed implementation measures.
Click on the link below to access the document:
https://view.publitas.com/palebluedot/mn-region-4-climate-vulnerability-assessment -102622-jbmd6qj8kvrb/

Click here to return to TOC
Community-Wide GHG Inventory
The paleBLUEdot team compiled a region-wide Greenhouse Gas Inventory. The assessment included collection of raw data and calculation of greenhouse gas emissions for each of the primary emissions sectors included in this Climate Action Plan. The inventory included both community-wide emissions as well as municipal operations. The report included communitywide emissions comparisons against communities within the State and region.
Click on the link below to access the document: https://view.publitas.com/palebluedot/region-4-ghginventory/
Region-Wide Ground Cover, Tree Canopy and Carbon Sequestration Study
paleBLUEdot conducted a baseline assessment of RegionWide ground cover and tree canopy extent. The study identified ground cover conditions (grass, water, wetland, tree canopy) Region-wide as well as by census tract. Based on the groundcover data, calculations were made for annual carbon sequestration rates, carbon stock, tree canopy/green space economic value, and pollution absorption rates (CO, O3, NO2, SO2, particulate pollution).
Included in this assessment was an assessment of RegionWide heat island characteristics and conditions. The study identified impervious surface conditions and coverage (sidewalks, roadway, parking, and building) and compiled data in subcategories of light reflective and light absorbent conditions. Baseline calculations were made for overall heat island contribution coefficient by neighborhood (expressed as summer night time degrees F above natural conditions, calculations based on research and formulas compiled by the University of Minnesota and Minnesota State University).
Click on the link below to access the document: https://view.publitas.com/palebluedot/mn-region-4-groundcover-heat-island-and-carbon-sequestration-study/
Community-Wide Renewable Energy Potentials Study
In support of development of effective renewable energy goalsetting and to establish strategies addressing renewable energy development, paleBLUEdot conducted a Region-Wide solar pv potentials study including economic and environmental benefits. This effort included:
1) Collect community-wide satellite data (NREL, NOAA, and NASA data).
2) Determine building roof stock characteristics and solar suitable buildings, calculate total suitable areas by roof configuration/orientation.
3) Calculate total rooftop solar capacity and annual energy generation by roof configuration/orientation.
4) Identify cost efficient annual energy generation potential.
5) Research solar market at national, State and regional levels. Identify low, medium, and high solar market absorption rates and community-wide solar pv goals.
6) Identify environmental and economic benefit of solar including economic development and job creation potential. (NREL JEDI model)
7) Develop community-wide Renewable Solar Energy Potentials report.
Click on the link below to access the document: https://view.publitas.com/palebluedot/mn-region-4-renewable -potentials-study/
The following is a glossary of climate action, resilience, and sustainability terms used in this Climate Action Plan
to
to TOC
Click here
return
Climate and Sustainability Glossary of Terms
Abbreviations
BAU Business as usual
BEV Battery electric vehicle
BIPOC Black, Indigenous, People of Color
C&D Construction and demolition
CAP Climate Action Plan
CE Carbon Equivalent
CDP Carbon Disclosure Project
CFC Chlorofluorocarbons
CH4 Methane
CHP Combined Heat and Power
CO2 Carbon dioxide
CO2e Carbon dioxide equivalent
CSG Community Solar Garden
DOE U.S. Department of Energy
EMS Emergency medical services
EPA U.S. Environmental Protection Agency
EV Electric vehicle
EVSE Electric vehicle supply equipment
FEMA Federal Emergency Management Agency
FTE Full-time equivalent
GCoM Global Covenant of Mayors
GDP Gross Domestic Product
GHG Greenhouse gas
GWP Global warming potential
HFC Hydrofluorocarbons
IPCC Intergovernmental Panel on Climate Change
kWh Kilowatt-hour
LEV Low emission vehicle
MWH Megawatt hour – 1,000 Kilowatt-hours
MSW Municipal Solid Waste
MT Metric ton equivalent to 1,000 kg (also known as Metric Tonne)
MMT Million Metric tons
MTCO2e Metric tons of carbon dioxide equivalent
N2O Nitrous Oxide
NOx Nitrogen Oxides
NZE Net-Zero Emissions
O3 Ozone
ODS Ozone Depleting Substances
PACE Property Assessed Clean Energy
PFC Perfluorocarbons
PHEV Plug-in hybrid electric vehicle
PM2.5 Particulate matter of 2.5 micrometer diameter or less
POC People of Color
PPA Power Purchase Agreement
PUB Public Utilities Board
REC Renewable Energy Credit
SO2 Sulfur Dioxide
SF6 Sulfur Hexafluoride
SULEV Super ultra-low emission vehicle
t Ton equivalent to 2,000 lbs (United States)
TOG Total Organic Gasses
USGS U.S. Geological Survey
VMT Vehicle miles traveled
VHT Vehicle hours traveled
ZEV Zero emission vehicle
https://palebluedot.llc/
1
A Action
Actions are detailed items that should be completed to carry out the vision and strategies identified in the plan.
Activity Data
Data on the magnitude of a human activity resulting in emissions or removals taking place during a given period of time. Data on energy use, metal production, land areas, management systems, lime and fertilizer use and waste arisings are examples of activity data. (IPCC)
Adaptation
See “Climate Adaptation or Resilience”
Adaptive Capacity
The social, technical skills, and financial capacities of individuals and groups to implement and maintain climate actions.
Aerosols
A collection of airborne solid or liquid particles, with a typical size between 0.01 and 10 micrometer that reside in the atmosphere for at least several hours. Aerosols may be of either natural or anthropogenic origin. Aerosols may influence climate in several ways: directly through scattering and absorbing radiation, and indirectly by acting as cloud condensation nuclei or modifying the optical properties and lifetime of clouds. (IPCC2)
Afforestation
Planting of new forests on lands that historically have not contained forests. (IPCC2)
Air Pollutant
Any man-made and/or natural substance occurring in the atmosphere that may result in adverse effects to humans, animals, vegetation, and/or materials.
(CARB)
Anthropogenic
The term "anthropogenic", in the context of greenhouse gas inventories, refers to greenhouse gas emissions and removals that are a direct result of human activities or are the result of natural processes that have been affected by human activities. (USEPA2)
Climate and Sustainability Glossary of Terms
Atmosphere
The gaseous envelope surrounding the Earth. The dry atmosphere consists almost entirely of nitrogen (78.1% volume mixing ratio) and oxygen (20.9% volume mixing ratio), together with a number of trace gases, such as argon (0.93% volume mixing ratio), helium and radiatively active greenhouse gases such as carbon dioxide (0.035% volume mixing ratio) and ozone. In addition, the atmosphere contains the greenhouse gas water vapor, whose amounts are highly variable but typically around 1% volume mixing ratio. The atmosphere also contains clouds and aerosols. (IPCC2)
B
Baseline Emissions
A baseline is a measurement, calculation, or time used as a basis for comparison. Baseline emissions are the level of emissions that would occur without policy intervention or without implementation of a project. Baseline estimates are needed to determine the effectiveness of emission reduction programs (also called mitigation strategies).
Base Year
The starting year for the inventory. Targets for reducing GHG emissions are often defined in relation to the base year.
BAU
See “Business As Usual Forecast”
Biogenic
Produced by the biological processes of living organisms. Note that we use the term "biogenic" to refer only to recently produced (that is non-fossil) material of biological origin. IPCC guidelines recommend that peat be treated as a fossil carbon because it takes a long time to replace harvested peat.
Biogeochemical Cycle
Movements through the Earth system of key chemical constituents essential to life, such as carbon, nitrogen, oxygen, and phosphorus. (NASA)
Biomass
Either (1) the total mass of living organisms in a given area or of a given species usually expressed as dry weight; or (2) Organic matter consisting of or recently derived from living organisms (especially
2
regarded as fuel) excluding peat. Includes products, by-products and waste derived from such material. (IPCC1)
Biomass Waste
Organic non-fossil material of biological origin that is a byproduct or a discarded product. "Biomass waste" includes municipal solid waste from biogenic sources, landfill gas, sludge waste, agricultural crop byproducts, straw, and other biomass solids, liquids, and gases; but excludes wood and wood-derived fuels (including black liquor), biofuels feedstock, biodiesel, and fuel ethanol. Note: EIA "biomass waste" data also include energy crops grown specifically for energy production, which would not normally constitute waste. (EIA)
BIPOC
“Black, Indigenous, and People of Color” this is a term specific to the United States, intended to center the experiences of Black and Indigenous groups as representative of or shaping the socioeconomic dynamics experienced by all people of color.
Black Carbon
Operationally defined aerosol species based on measurement of light absorption and chemical reactivity and/or thermal stability; consists of soot, charcoal and/or possible light absorbing refractory organic matter (Charlson and Heintzenberg, 1995, p. 401). (IPCC2)
Blue Carbon
Carbon sequestered and stored by wetlands and other coastal ecosystems helping to mitigate the effectsof climate change.
Business As Usual Forecast
The Intergovernmental Panel on Climate Change (IPCC) defines a “business-as-usual” forecast as the level of emissions that would result if future development trends follow those of the past and no changes in policies take place. A BAU forecast assumes that no emission-reduction actions will be undertaken beyond those already in place, mandated by State or Federal policy, or committed to in the base year.
Carbon Cycle
All parts (reservoirs) and fluxes of carbon. The cycle is usually thought of as four main reservoirs of carbon interconnected by pathways of exchange. The reservoirs are the atmosphere, terrestrial biosphere (usually includes freshwater systems), oceans, and sediments (includes fossil fuels). The annual movements of carbon, the carbon exchanges between reservoirs, occur because of various chemical, physical, geological, and biological processes. The ocean contains the largest pool of carbon near the surface of the Earth, but most of that pool is not involved with rapid exchange with the atmosphere. (NASA)
Carbon Dioxide (CO2)
A naturally occurring gas, and also a by-product of burning fossil fuels and biomass, as well as land-use changes and other industrial processes. It is the principal anthropogenic greenhouse gas that affects the Earth's radiative balance. It is the reference gas against which other greenhouse gases are measured and therefore has a Global Warming Potential of 1. (IPCC2)
Carbon Dioxide Equivalent (CO2e)
A metric used to compare emissions of various greenhouse gases. It is the mass of carbon dioxide that would produce the same estimated radiative forcing as a given mass of another greenhouse gas. Carbon dioxide equivalents are computed by multiplying the mass of the gas emitted by its global warming potential.
Carbon Disclosure Project (CDP)
An international organization that administers a platform for organizations and cities to publicly disclose their environmental impacts, such as climate risk. CDP is one of the approved disclosure platforms utilized by GCoM.
Carbon Emissions
The release of carbon dioxide into the atmosphere. Primary human sources of the release of carbon dioxide occur from burning oil, coal, and gas for energy use
Carbon Equivalent (CE)
A metric measure used to compare the emissions of the different greenhouse gases based upon their global warming potential. Carbon equivalents can be
of Terms 3
Climate and Sustainability Glossary
C
calculated from to carbon dioxide equivalents by multiplying the carbon dioxide equivalents by 12/44 (the ratio of the molecular weight of carbon to that of carbon dioxide). The use of carbon equivalent is declining in GHG inventories.
Carbon Intensity
The amount of carbon by weight emitted per unit of energy consumed. A common measure of carbon intensity is weight of carbon per British thermal unit (Btu) of energy. When there is only one fossil fuel under consideration, the carbon intensity and the emissions coefficient are identical. When there are several fuels, carbon intensity is based on their combined emissions coefficients weighted by their energy consumption levels. (EIA)
Carbon Neutrality
“Carbon neutrality” means annual zero net anthropogenic (human caused or influenced) CO2 emissions by a certain date. By definition, carbon neutrality means every ton of anthropogenic CO2 emitted is compensated with an equivalent amount of CO2 removed (e.g. via carbon sequestration).
Carbon Offsets
A carbon offset is a reduction or removal of emissions of carbon dioxide or other greenhouse gases made to compensate for emissions made elsewhere. Offsets are measured in metric tonnes of carbon dioxide-equivalent. Offsets are bought and sold to address direct and indirect emissions associated with an organization’s operations.
Carbon Sinks
A forest, ocean, or other natural environment viewed in terms of its ability to absorb carbon dioxide from the atmosphere.
Carbon Sequestration
This refers to the capture of CO2 from the atmosphere and its long term storage in oceans (oceanic carbon sequestration), in biomass and soils (terrestrial carbon sequestration) or in underground reservoirs (geologic carbon sequestration).
Chlorofluorocarbons (CFCs)
Greenhouse gases covered under the 1987 Montreal Protocol and used for refrigeration, air conditioning, packaging, insulation, solvents, or aerosol propellants. Because they are not destroyed in the
lower atmosphere, CFCs drift into the upper atmosphere where, given suitable conditions, they break down ozone. These gases are being replaced by other compounds, including hydrochlorofluorocarbons and hydrofluorocarbons, which are greenhouse gases covered under the Kyoto Protocol. (IPCC3)
Circular Economy
An alternative to a traditional linear economy (make, use, dispose) in which an economy is a regenerative system where resource input and waste are minimized. This is achieved through long-lasting product design, repair, reuse, remanufacturing, and recycling. Circular economy strategies are often cited as systems level approaches to reducing waste generation through product and system design.
Climate
Climate in a narrow sense is usually defined as the "average weather" or more rigorously as the statistical description in terms of the mean and variability of relevant quantities over a period of time ranging from months to thousands or millions of years. The classical period is 30 years, as defined by the World Meteorological Organization (WMO). These relevant quantities are most often surface variables such as temperature, precipitation, and wind. Climate in a wider sense is the state, including a statistical description, of the climate system.
(IPCC2)
Climate Adaptation or Resilience
The capacity of a natural environment to prevent, withstand, respond to, and recover from a disruption. The process of adjusting to new climate conditions to reduce risks to valued assets. Adaptation is achieved through actions taken to increase resilience to climate change impacts by reducing vulnerability.
Climate Change
Climate change refers to a statistically significant variation in either the mean state of the climate or in its variability, persisting for an extended period (typically decades or longer). Climate change may be due to natural internal processes or external forcings, or to persistent anthropogenic changes in the composition of the atmosphere or in land use.
(IPCC2)
4
Climate and Sustainability Glossary of Terms
Climate and Sustainability Glossary of Terms
Climate Hazard
An extreme climate event or condition that can harm human health, livelihoods, or natural resources. It can include abrupt changes to the climate system such as extreme precipitation, storms, droughts, and heat waves.
Climate Migration
Movement of people due to the impacts of climate change on their livelihoods or erosion of quality of life, such as shifts in water availability and crop productivity, or to factors such as sea level rise or storm surge
Climate Model
A quantitative method to simulate interactions of the important drivers of climate including atmosphere, oceans, land, and ice to develop projections of future climate.
Climate Scenario
A coherent, internally consistent, plausible description of possible climatic conditions
Climate Risk
The potential for consequences where something of value is at stake and where the outcome is uncertain, recognizing the diversity of values. Risk is often represented as probability of occurrence of hazardous events or trends multiplied by the impacts if these events or trends occur. Risk results from the interaction of vulnerability and hazard (IPCC):
Climate Vulnerability
Is the degree to which a system is susceptible to, and unable to cope with, adverse effects of climate change, including climate variability and extremes. Vulnerability is a function of the character, magnitude and rate of climate change and variation to which a system is exposed, its sensitivity, and its capacity to adapt.
Vulnerability = potential impact (sensitivity x exposure) – adaptive capacity (IPCC):
Climate Vulnerability Assessment
A report used to identify and define the risks posed by climate change and inform adaptation measures needed to combat climate change. Reports can be about a wide range of fields including food security, poverty analysis, and extreme weather events.
Co-Benefit
Indirect benefits to the community (e.g., public health, economic, equity) caused by climate adaptation and mitigation strategies, actions, and policies.
Co-generation
Co-generation is an industrial structure, installation, plant, building, or self-generating facility that has sequential or simultaneous generation of multiple forms of useful energy (usually mechanical and thermal) in a single, integrated system. (CARB)
Community Choice Aggregation (CCA)
CCA programs, also known as “Municipal Power Aggregation” or “Community Power Aggregation”, allow local governments to procure power on behalf of their residents, businesses, and municipal accounts from an alternative supplier while still receiving transmission and distribution service from their existing utility provider. Typically, enabling legislation at the State level is required in order to assemble a CCA program for a community. See EPA’s CCA webpage for more: https://www.epa.gov/green-powermarkets/community-choice-aggregation
Combined Heat and Power (CHP)
Combined heat and power is the simultaneous production of both electricity and useful heat for application by the producer or to be sold to other users with the aim of better utilization of the energy used. Public utilities may utilize part of the heat produced in power plants and sell it for public heating purposes. Industries as auto-producers may sell part of the excess electricity produced to other industries or to electric utilities. (IPCC)
Community Power Aggregation
See “Community Choice Aggregation”
Community Solar / Community Solar Garden (CSG)
Solar facilities shared by multiple community subscribers who receive credit on their electricity bills for their share of the power produced.
Community solar allows members of a community to share the benefits of solar power on their property without installing it on their own property. Electricity generated by the community solar farm typically costs less than the price from utility companies.
5
Complete Streets
A “complete street” is a design approach that requires streets to be designed to support safe, convenient and comfortable travel and access for users of all ages and abilities regardless of their mode of transportation.
Consistency
Consistency means that an inventory should be internally consistent in all its elements over a period of years. An inventory is consistent if the same methodologies are used for the base and all subsequent years and if consistent data sets are used to estimate emissions or removals from sources or sinks. (IPCC)
Continuous Emission Monitor (CEM)
A type of air emission monitoring system installed to operate continuously inside of a smokestack or other emission source. (CARB)
Cool Roof
Roof surfaces designed to reflect radiation from the sun, reducing heat transfer into the building or the building’s surrounding area.
Cool Pavement
Pavement surfaces designed to reflect radiation from the sun, reducing heat transfer into the road’s surrounding area.
Criteria Air Pollutant
An air pollutant for which acceptable levels of exposure can be determined and for which an ambient air quality standard has been set. Examples include: ozone, carbon monoxide, nitrogen dioxide, sulfur dioxide, and PM10 and PM2.5. The term "criteria air pollutants" derives from the requirement that the U.S. EPA must describe the characteristics and potential health and welfare effects of these pollutants. The U.S. EPA and CARB periodically review new scientific data and may propose revisions to the standards as a result.
(CARB)
D Deforestation
Those practices or processes that result in the change of forested lands to non-forest uses. This is often cited as one of the major causes of the
enhanced greenhouse effect for two reasons: 1) the burning or decomposition of the wood releases carbon dioxide; and 2) trees that once removed carbon dioxide from the atmosphere in the process of photosynthesis are no longer present and contributing to carbon storage. (UNFCC)
Distillate Fuel Oil
A general classification for one of the petroleum fractions produced in conventional distillation operations. It includes diesel fuels and fuel oils. Products known as No. 1, No. 2, and No. 4 diesel fuel are used in on-highway diesel engines, such as those in trucks and automobiles, as well as off-highway engines, such as those in railroad locomotives and agricultural machinery. Products known as No. 1, No. 2, and No. 4 fuel oils are used primarily for space heating and electric power generation. (EIA)
District Heating
District heating is a system for distributing heat generated in a centralized location through a system of pipes for residential and/and commercial heating within a district of a community.
E Eco-System Services
Contributions of ecosystems to human well-being. For example, ecosystems produce resources used by humans such as clean air, water, food, open space, flood control, climate mitigation, and other benefits.
Emissions
The release of a substance (usually a gas when referring to the subject of climate change) into the atmosphere. (USEPA1)
Emission Factor
A coefficient that quantifies the emissions or removals of a gas per unit activity. Emission factors are often based on a sample of measurement data, averaged to develop a representative rate of emission for a given activity level under a given set of operating conditions. (IPCC)
Emission Inventory
An estimate of the amount of pollutants emitted into the atmosphere from major mobile, stationary, area-wide, and natural source categories over a specific period of time such as a day or a year.
(CARB)
Climate
Sustainability Glossary of Terms 6
and
Emission Rate
The weight of a pollutant emitted per unit of time (e.g., tons / year). (CARB)
Energy Tariff
An Energy Tariff, or utility tariff, governs how an energy provider (electric or natural gas) charges the customer for their energy and natural gas usage. Electric and natural gas vendors must submit their tariffs to the government for approval.
Environmental Justice
The fair treatment and meaningful involvement of all people regardless of race, color, national origin, or income with respect to the development, implementation and enforcement of environmental laws, regulations and policies
Equity
The state or quality of being just and fair in the way people are treated. Equity recognizes that each person has different circumstances and allocates the exact resources and opportunities needed to reach an equal outcome. According to the World Health Organization, Equity is “the absence of avoidable or remediable differences among groups of people, whether those groups are defined socially, economically, demographically or geographically” while the US Center for Disease Control defines Equity as “when everyone has the opportunity to be as healthy as possible.” Within the context of climate change, climate equity means both protection from climate change and environmental hazards as well as access to climate resilience and environmental benefits for all, regardless of income, race, and other characteristics
Estimation
Estimation is the assessment of the value of an unmeasurable quantity using available data and knowledge within stated computational formulas or mathematical models.
F Fluorocarbons
Carbon-fluorine compounds that often contain other elements such as hydrogen, chlorine, or bromine. Common fluorocarbons include chlorofluorocarbons (CFCs), hydrochlorofluorocarbons (HCFCs),
Climate and Sustainability Glossary of Terms
hydrofluorocarbons (HFCs), and perfluorocarbons (PFCs). (UNFCC)
Flux
Either (1) Raw materials, such as limestone, dolomite, lime, and silica sand, which are used to reduce the heat or other energy requirements of thermal processing of minerals (such as the smelting of metals). Fluxes also may serve a dual function as a slagging agent. (2) The rate of flow of any liquid or gas, across a given area; the amount of this crossing a given area in a given time. (e.g., "Flux of CO2 absorbed by forests"). (IPCC)
Fossil Fuel
Geologic deposits of hydrocarbons from ancient biological origin, such as coal, petroleum and natural gas.
Fuel Combustion
Fuel combustion is the intentional oxidation of materials within an apparatus that is designed to provide heat or mechanical work to a process, or for use away from the apparatus. (IPCC)
Fugitive Emissions
Fugitive emissions are unintentional leaks emitted from sealed surfaces, such as packings and gaskets, or leaks from underground pipelines resulting from corrosion or faulty connections
G
Geologic Carbon Sequestration
It is the process of injecting CO2 from a source, such as coal-fired electric generating power plant, through a well into the deep subsurface. With proper site selection and management, geologic sequestration could play a major role in reducing emissions of CO2. Research efforts to evaluate the technical aspects of CO2 geologic sequestration are underway. (USEPA4)
GHG
See “Greenhouse Gas”
Global Environmental Change
Pervasive, accelerating changes and disruptions of Earth’s natural systems including climate change, biodiversity loss, changes in land use and land cover, resource scarcity, global pollution, and altered
7
biogeochemical cycles. (source: Planetary Health Alliance)
Global Warming
Global warming is an average increase in the temperature of the atmosphere near the Earth's surface and in the troposphere, which can contribute to changes in global climate patterns. Global warming can occur from a variety of causes, both natural and human induced. In common usage, "global warming" often refers to the warming that can occur as a result of increased emissions of greenhouse gases from human activities. Also see Climate Change (USEPA1)
Global Warming Potential (GWP)
An index, based upon radiative properties of wellmixed greenhouse gases, measuring the radiative forcing of a unit mass of a given well-mixed greenhouse gas in the present-day atmosphere integrated over a chosen time horizon, relative to that of carbon dioxide. The GWP represents the combined effect of the differing times these gases remain in the atmosphere and their relative effectiveness in absorbing outgoing thermal infrared radiation. The Kyoto Protocol is based on GWPs from pulse emissions over a 100-year time frame. (IPCC2)
GCoM Global Covenant of Mayors: GCoM is the largest global alliance for city climate leadership, built upon the commitment of over 10,000 cities and local governments. The alliance’s mission is to mobilize and support climate and energy action in communities across the world.
Green Streets
A “green street” is a stormwater management approach that incorporates vegetation, soil, and engineered systems to slow, filter, and cleanse stormwater runoff from impervious surfaces.
Greenhouse Effect
Trapping and build-up of heat in the atmosphere (troposphere) near the earth's surface. Some of the heat flowing back toward space from the earth's surface is absorbed by water vapor, carbon dioxide, ozone, and several other gases in the atmosphere and then reradiated back toward the earth's surface. If the atmospheric concentrations of these greenhouse gases rise, the average temperature of
the lower atmosphere will gradually increase. (UNFCC)
Global Protocol for Community-Scale Greenhouse Gas Emissions Inventories:
A robust, transparent and globally-accepted framework that cities and local governments can use to consistently identify, calculate and report on city greenhouse gas emissions.
Greenhouse Gas
Greenhouse Gas (GHG) is any gas that absorbs infrared radiation in the atmosphere. Greenhouse gases include, but are not limited to, water vapor, carbon dioxide (CO2), methane (CH4), nitrous oxide (N2O), hydrochlorofluorocarbons (HCFCs), ozone (O3), hydrofluorocarbons (HFCs), perfluorocarbons (PFCs), and sulfur hexafluoride (SF6). (UNFCC)
Greenhouse Gas Reduction
Actions taken to reduce the number and severity of potential future climate impacts compared to unchecked greenhouse gas emissions.
Green Infrastructure
An approach to managing precipitation by reducing and treating stormwater at its source while delivering environmental, social, and economic benefits. Stormwater runoff can carry trash, bacteria, and other pollutants and is a major cause of water pollution in urban areas.
Green Roof
A green roof is a layer of vegetation planted over a waterproofing system that is installed on top of a flat or slightly–sloped roof. Green roofs are also known as vegetative or eco–roofs. They fall into three main categories extensive, intensive, and semi–intensive. Green roofs have been shown to decrease heat island contributions of buildings and decrease stormwater runoff while increasing overall vegetative land coverage.
Green wall
A green wall is similar to a green roof but applied to exterior wall surfaces.
Gross Domestic Product (GDP)
The sum of gross value added, at purchasers' prices, by all resident and non-resident producers in the economy, plus any taxes and minus any subsidies
Sustainability Glossary of Terms 8
Climate and
not included in the value of the products in a country or a geographic region for a given period, normally one year. It is calculated without deducting for depreciation of fabricated assets or depletion and degradation of natural resources. (IPCC3)
Groundwater
Water that occurs beneath the water table in soils and geologic formations that are fully saturated.
H Halocarbons
A collective term for the group of partially halogenated organic species, including the chlorofluorocarbons (CFCs), hydrochlorofluorocarbons (HCFCs), hydrofluorocarbons (HFCs), halons, methyl chloride, methyl bromide, etc. Many of the halocarbons have large Global Warming Potentials. The chlorine and bromine-containing halocarbons are also involved in the depletion of the ozone layer. (IPCC2)
Hazard
The potential occurrence of a natural or humaninduced physical event that may cause loss of life, injury,or other health impacts, as well as damage and loss to property, infrastructure, livelihoods, service provision, and environmental resources.
Heat Island
A heat island is an urban or large-scale area characterized by temperatures higher than those of the surrounding due to human activities. The difference in temperature between urban and lessdeveloped rural areas has to do with how well the surfaces in each environment absorb and hold heat. See also “Micro Heat Island”
Hydrocarbons
Strictly defined as molecules containing only hydrogen and carbon. The term is often used more broadly to include any molecules in petroleum which also contains molecules with S, N, or O An unsaturated hydrocarbon is any hydrocarbon containing olefinic or aromatic structures. (IPCC)
Hydrofluorocarbons (HFCs)
Compounds containing only hydrogen, fluorine, and carbon atoms. They were introduced as alternatives to ozone depleting substances in serving many industrial, commercial, and personal needs. HFCs are
emitted as by-products of industrial processes and are also used in manufacturing. They do not significantly deplete the stratospheric ozone layer, but they are powerful greenhouse gases with global warming potentials ranging from 140 (HFC-152a) to 11,700 (HFC-23). (USEPA1)
I ICLEI Local Governments for Sustainability:
A membership organization for local governments to pursue reductions in carbon pollution and improvements in advancing sustainable urban development. ICLEI’s members and team of experts work together through peer exchange, partnerships and capacity building to create systemic change for urban sustainability.
Impact
An effect of climate change on the structure or function of a system: for example, environmental consequences of climate change, such as extreme heat waves, rising sea levels, or changes in precipitation resulting in flooding and droughts.
Indicator: A quantitative measure of one aspect of climate-change vulnerability. Examples include projected change in mean annual temperature or number of at-risk species
Intergovernmental Panel on Climate Change
The IPCC was established jointly by the United Nations Environment Programme and the World Meteorological Organization in 1988. The purpose of the IPCC is to assess information in the scientific and technical literature related to all significant components of the issue of climate change. The IPCC draws upon hundreds of the world's expert scientists as authors and thousands as expert reviewers. Leading experts on climate change and environmental, social, and economic sciences from some 60 nations have helped the IPCC to prepare periodic assessments of the scientific underpinnings for understanding global climate change and its consequences. With its capacity for reporting on climate change, its consequences, and the viability of adaptation and mitigation measures, the IPCC is also looked to as the official advisory body to the world's governments on the state of the science of the climate change issue. For example, the IPCC organized the development of internationally
Climate and Sustainability Glossary of Terms 9
accepted methods for conducting national greenhouse gas emission inventories. (USEPA1)
K
Kilowatt Hour (kWh):
A measure of electrical energy equivalent to a power consumption of 1,000 watts for one hour.
Kyoto Protocol
The Kyoto Protocol to the United Nations Framework Convention on Climate Change (UNFCCC) was adopted in 1997 in Kyoto, Japan, at the Third Session of the Conference of the Parties (COP) to the UNFCCC. It contains legally binding commitments, in addition to those included in the UNFCCC. Countries included in Annex B of the Protocol (most Organisation for Economic Cooperation and Development countries and countries with economies in transition) agreed to reduce their anthropogenic greenhouse gas emissions (carbon dioxide, methane, nitrous oxide, hydrofluorocarbons, perfluorocarbons, and sulphur hexafluoride) by at least 5% below 1990 levels in the commitment period 2008 to 2012. The Kyoto Protocol entered into force on 16 February 2005. (IPCC2)
L Land Use and Land Use Change
Land use refers to the total of arrangements, activities and inputs undertaken in a certain land cover type (a set of human actions). The term land use is also used in the sense of the social and economic purposes for which land is managed (e.g., grazing, timber extraction and conservation). Land use change refers to a change in the use or management of land by humans, which may lead to a change in land cover. Land cover and land use change may have an impact on the surface albedo, evapotranspiration, sources and sinks of greenhouse gases, or other properties of the climate system and may thus have a radiative forcing and/or other impacts on climate, locally or globally. (IPCC2)
Living Streets
A “living street” combines the concepts of complete streets and green streets while putting additional focus on quality of life aspects for City residents.
LULUCF
Acronym for "Land Use, Land Use Change and Forestry", a category of activities in GHG inventories.
M
Megawatt Hour (MWH):
A measure of electrical energy equivalent to a power consumption of 1,000,000 watts for one hour.
Methane (CH4)
A hydrocarbon that is a greenhouse gas with a global warming potential most recently estimated at 25 times that of carbon dioxide (CO2). Methane is produced through anaerobic (without oxygen) decomposition of waste in landfills, flooded rice fields, animal digestion, decomposition of animal wastes, production and distribution of natural gas and petroleum, coal production, and incomplete fossil fuel combustion. The GWP is from the IPCC's Fourth Assessment Report (AR4).
Metric Ton
The tonne (t) or metric ton (MT), sometimes referred to as a metric tonne, is an international unit of mass. A metric ton is equal to a Megagram (Mg), 1000 kilograms, 2204.6 pounds, or 1.1023 short tons.
Micro Heat Island
Micro heat islands are smaller scale hot spots within developed areas which experience higher temperatures than surrounding areas due to how well the surfaces in the location absorb, reflect, and hold heat. These occur in areas such as poorly vegetated parking lots, non-reflective roofs and asphalt roads. Micro urban heat islands are strongly affected by micro climate factors and localized conditions of the built environment. See also “Heat Island”
Million Metric Tons (MMT)
Common measurement used in GHG inventories. It is equal to a Teragram (Tg).
Mitigation:
Actions taken to limit the magnitude or rate of longterm global warming and its related effects. Climate change mitigation generally involves reductions in human emissions of greenhouse gases.
10
Climate and Sustainability Glossary of Terms
Mobile Sources
Sources of air pollution such as automobiles, motorcycles, trucks, off-road vehicles, boats, and airplanes. (CARB)
Mode Share
The percentage of travelers using a particular type of transportation. Modal share is an important component in developing sustainable transport within a city or region because it reveals the level of utilization of various transportation methods. The percentage reflects how well infrastructure, policies, investments, and land-use patterns support different types of travel.
Model
A model is a quantitatively-based abstraction of a real-world situation which may simplify or neglect certain features to better focus on its more important elements. (IPCC)
Municipal Power Aggregation
See “Community Choice Aggregation”
Municipal Solid Waste (MSW)
Residential solid waste and some non-hazardous commercial, institutional, and industrial wastes. This material is generally sent to municipal landfills for disposal. (USEPA1)
N
Natural Sources
Non-manmade emission sources, including biological and geological sources, wildfires, and windblown dust. (CARB)
Net Energy Metering, (NEM)
Net Energy Metering (NEM), also known as Net Metering, allows residential and commercial customers who generate their own electricity from solar power to sell the electricity they aren't using back into the grid. The NEM rate schedule (energy tariff) determines how much you are paid for the electricity you sold to the grid. Many states have passed net metering laws. In other states, utilities may offer net metering programs voluntarily or as a result of regulatory decisions. Differences between state legislation, regulatory decisions and implementation policies mean that the mechanism for compensating solar customers varies widely across the country.
Net Zero Emissions (NZE)
Refers to a community, business, institution, or building for which, on an annual basis, all greenhouse gas emissions resulting from operations are offset by carbon-free energy production An NZE building or property is one which generates or offsets all energy consumed. If a City develops a NZE building code, this definition will have to be refined to provide additional guidance on calculating emissions and offsets to achieve net-zero emissions.
Nitrogen Fixation
Conversion of atmospheric nitrogen gas into forms useful to plants and other organisms by lightning, bacteria, and blue-green algae; it is part of the nitrogen cycle. (UNFCC)
Nitrogen Oxides (NOx)
Gases consisting of one molecule of nitrogen and varying numbers of oxygen molecules. Nitrogen oxides are produced in the emissions of vehicle exhausts and from power stations. In the atmosphere, nitrogen oxides can contribute to formation of photochemical ozone (smog), can impair visibility, and have health consequences; they are thus considered pollutants. (NASA)
Nitrous Oxide (N2O)
A powerful greenhouse gas with a global warming potential of 298 times that of carbon dioxide (CO2). Major sources of nitrous oxide include soil cultivation practices, especially the use of commercial and organic fertilizers, manure management, fossil fuel combustion, nitric acid production, and biomass burning. The GWP is from the IPCC's Fourth Assessment Report (AR4).
Ozone (O3)
Ozone, the triatomic form of oxygen (O3), is a gaseous atmospheric constituent. In the troposphere, it is created both naturally and by photochemical reactions involving gases resulting from human activities (smog). Tropospheric ozone acts as a greenhouse gas. In the stratosphere, it is created by the interaction between solar ultraviolet radiation and molecular oxygen (O2). Stratospheric ozone plays a dominant role in the stratospheric radiative balance. Its concentration is highest in the ozone layer. (IPCC2)
Climate and Sustainability Glossary of Terms 11
O
Ozone Depleting Substances (ODS)
A compound that contributes to stratospheric ozone depletion. Ozone-depleting substances (ODS) include CFCs, HCFCs, halons, methyl bromide, carbon tetrachloride, and methyl chloroform. ODS are generally very stable in the troposphere and only degrade under intense ultraviolet light in the stratosphere. When they break down, they release chlorine or bromine atoms, which then deplete ozone. (IPCC)
P
Perfluorocarbons (PFCs)
A group of human-made chemicals composed of carbon and fluorine only. These chemicals (predominantly CF4 and C2F6) were introduced as alternatives, along with hydrofluorocarbons, to the ozone depleting substances. In addition, PFCs are emitted as by-products of industrial processes and are also used in manufacturing. PFCs do not harm the stratospheric ozone layer, but they are powerful greenhouse gases: CF4 has a global warming potential (GWP) of 7,390 and C2F6 has a GWP of 12,200. The GWP is from the IPCC's Fourth Assessment Report (AR4).
Phantom Load
Phantom load refers to the energy used by any appliance or electronic device (such as televisions, DVD players, microwaves and personal computers) that still uses electricity or “standby power” when turned off. An appliances that draws “phantom loads” means it is constantly drawing electricity.
Photosynthesis
The process by which plants take carbon dioxide from the air (or bicarbonate in water) to build carbohydrates, releasing oxygen in the process. There are several pathways of photosynthesis with different responses to atmospheric carbon dioxide concentrations. (IPCC2)
Plug Load
Plug loads refer to energy used by equipment that is plugged into an outlet. In an office, key plug loads include computer and monitors, printers, and copiers. Plug loads as a share of overall building energy use is higher in energy efficient buildings.
POC
“People of Color” or “Person of Color” is a general umbrella term that collectively refers to all nonwhite demographic groups.
Point Sources
Specific points of origin where pollutants are emitted into the atmosphere such as factory smokestacks. (CARB)
Power Purchase Agreement (PPA)
A power purchase agreement (PPA), or electricity power agreement, is a contract between two parties; one party generates electricity (the seller) and the other party looks to purchase electricity (the buyer). Individual customers and organizations may enter into PPAs with individual developers or may join together to seek better prices as a group. PPAs can allow longer term commitments to renewable energy as well as a form of “direct” investing in new renewable energy generation.
Property-Assessed Clean Energy (PACE)
A program created for financing energy efficiency and renewable improvements on private property. Private property can include residential, commercial or industrial properties. Improvements can include energy efficiency, renewable energy and water conservation upgrades to a building.
Process Emissions
Emissions from industrial processes involving chemical transformations other than combustion. (IPCC)
R
Radiative Forcing
A change in the balance between incoming solar radiation and outgoing infrared (i.e., thermal) radiation. Without any radiative forcing, solar radiation coming to the Earth would continue to be approximately equal to the infrared radiation emitted from the Earth. The addition of greenhouse gases to the atmosphere traps an increased fraction of the infrared radiation, reradiating it back toward the surface of the Earth and thereby creates a warming influence. (UNFCC)
Reforestation
Planting of forests on lands that have previously
Climate and Sustainability Glossary of Terms 12
contained forests but that have been converted to some other use. (IPCC2)
Regeneration
The act of renewing tree cover by establishing young trees, naturally or artificially - note regeneration usually maintains the same forest type and is done promptly after the previous stand or forest was removed. (CSU)
Renewable Energy
Energy resources that are naturally replenishing such as solar, wind, hydro and geothermal energy.
Renewable Energy Credits (RECs)
A market-based instrument that represents the property rights to the environmental, social and other non-power attributes of renewable electricity generation. RECs are issued when one megawatthour (MWh) of electricity is generated and delivered to the electricity grid from a renewable energy resource. The single largest category of reductions in Evanston’s emissions has been through the purchase of RECs.
Residence Time
Average time spent in a reservoir by an individual atom or molecule. Also, this term is used to define the age of a molecule when it leaves the reservoir. With respect to greenhouse gases, residence time usually refers to how long a particular molecule remains in the atmosphere. (UNFCC)
Resilience
The ability to anticipate, prepare for, respond to, and recover quickly from climate change hazards with minimum damage to social well-being, the economy, and the environment.
Reservoir
Either (1) a component or components of the climate system where a greenhouse gas or a precursor of a greenhouse gas is stored; or (2) Water bodies regulated for human activities (energy production, irrigation, navigation, recreation etc.) where substantial changes in water area due to water level regulation may occur. (IPCC)
Respiration
The process whereby living organisms convert
organic matter to carbon dioxide, releasing energy and consuming molecular oxygen. (IPCC2)
Retro-commissioning
The systematic process to improve an existing building’s performance ensuring the building controls are running efficiently and balancing the designed use and the actual use of the building.
Ride-share
The practice of sharing transportation in the form of carpooling or vanpooling. It is typically an arrangement made through a ride-matching service that connects drivers with riders.
S
Scope 1:
Scope 1 includes emissions being released within the city limits resulting from combustion of fossil fuels and from waste decomposition in the landfill and wastewater treatment plant.
Scope 2:
Scope 2 includes emissions produced outside the city that are induced by consumption of electrical energy within the city limits.
Scope 3:
Scope 3 includes emissions of potential policy relevance to local government operations that can be measured and reported but do not qualify as Scope 1 or 2. This includes, but is not limited to, outsourced operations and employee commute.
Short Ton
Common measurement for a ton in the United States. A short ton is equal to 2,000 lbs or 0.907 metric tons. (USEPA1)
Sink
Any process, activity or mechanism that removes a greenhouse gas, an aerosol or a precursor of a greenhouse gas or aerosol from the atmosphere. (IPCC2)
Social Cost of Carbon
The social cost of carbon is a measure of the economic harm from climate change impacts, expressed as the dollar value of the total damages from emitting one ton of carbon dioxide into the atmosphere.
Sustainability Glossary of Terms 13
Climate and
Solar Radiation
Electromagnetic radiation emitted by the Sun. It is also referred to as shortwave radiation. Solar radiation has a distinctive range of wavelengths (spectrum) determined by the temperature of the Sun, peaking in visible wavelengths. (IPCC2)
Source
Any process, activity or mechanism that releases a greenhouse gas, an aerosol or a precursor of a greenhouse gas or aerosol into the atmosphere. (IPCC2)
Stationary Sources
Non-mobile sources such as power plants, refineries, and manufacturing facilities which emit air pollutants. (CARB)
Strategy / Strategic Goal
Specific statements of direction that expand on the sustainability vision and GHG reduction goals and guide decisions about future public policy, community investment, and actions.
Sulfur Dioxide (SO2)
A compound composed of one sulfur and two oxygen molecules. Sulfur dioxide emitted into the atmosphere through natural and anthropogenic processes is changed in a complex series of chemical reactions in the atmosphere to sulfate aerosols. These aerosols are believed to result in negative radiative forcing (i.e., tending to cool the Earth's surface) and do result in acid deposition (e.g., acid rain). (UNFCC)
Sulfur Hexafluoride (SF6)
A colorless gas soluble in alcohol and ether, slightly soluble in water. A very powerful greenhouse gas with a global warming potential most recently estimated at 22,800 times that of carbon dioxide (CO2). SF6 is used primarily in electrical transmission and distribution systems and as a dielectric in electronics. This GWP is from the IPCC's Fourth Assessment Report (AR4).
T Terrestrial Carbon Sequestration
It is the process through which carbon dioxide (CO2) from the atmosphere is absorbed by trees, plants
and crops through photosynthesis, and stored as carbon in biomass (tree trunks, branches, foliage and roots) and soils. The term "sinks" is also used to refer to forests, croplands, and grazing lands, and their ability to sequester carbon. Agriculture and forestry activities can also release CO2 to the atmosphere. Therefore, a carbon sink occurs when carbon sequestration is greater than carbon releases over some time period. (USEPA3)
Therm:
A unit of measure for energy that is equivalent to 100,000 British Thermal units, or roughly the energy in 100 cubic feet of natural gas. Often used for measuring natural gas usage for billing purposes.
Total Organic Gases (TOG)
Gaseous organic compounds, including reactive organic gases and the relatively unreactive organic gases such as methane. (CARB)
Transparency
Transparency means that the assumptions and methodologies used for an inventory should be clearly explained to facilitate replication and assessment of the inventory by users of the reported information. The transparency of inventories is fundamental to the success of the process for the communication and consideration of information. (IPCC)
Trend
The trend of a quantity measures its change over a time period, with a positive trend value indicating growth in the quantity, and a negative value indicating a decrease. It is defined as the ratio of the change in the quantity over the time period, divided by the initial value of the quantity, and is usually expressed either as a percentage or a fraction. (IPCC)
U Urban Tree Canopy
Describes the makeup and characteristics of trees within the urban environment.
V
VMT Vehicle Miles Traveled:
A unit used to measure vehicle travel made by private vehicles, including passenger vehicles, truck, vans and motorcycles. Each mile traveled is counted
Climate and Sustainability Glossary of Terms 14
as one vehicle mile regardless of the number of persons in the vehicle.
Vision Zero:
Vision Zero is a strategy to eliminate all traffic fatalities and severe injuries, while increasing safe, healthy, equitable mobility for all.
https://visionzeronetwork.org/
Vulnerability
The degree to which a system is susceptible to or unable to cope with, adverse effects of climate change. Vulnerability consists of the following:
• Exposure: The presence of people, ecosystems, or assets in places and settings that could be adversely affected by climate change impacts
• Sensitivity: The degree to which people, ecosystems, or assets are affected by climate change
• Adaptive capacity: The ability of assets, systems or people to adjust to an adverse impact
W Water Vapor
The most abundant greenhouse gas; it is the water present in the atmosphere in gaseous form. Water vapor is an important part of the natural greenhouse effect. While humans are not significantly increasing its concentration, it contributes to the enhanced greenhouse effect because the warming influence of greenhouse gases leads to a positive water vapor feedback. In addition to its role as a natural greenhouse gas, water vapor plays an important role in regulating the temperature of the planet because clouds form when excess water vapor in the atmosphere condenses to form ice and water droplets and precipitation. (UNFCC)
Weather
Atmospheric condition at any given time or place. It is measured in terms of such things as wind, temperature, humidity, atmospheric pressure, cloudiness, and precipitation. In most places, weather can change from hour-to-hour, day-to-day, and season-to-season. Climate in a narrow sense is usually defined as the "average weather", or more rigorously, as the statistical description in terms of the mean and variability of relevant quantities over a period of time ranging from months to thousands or millions of years. The classical period is 30 years, as defined by the World Meteorological Organization
(WMO). These quantities are most often surface variables such as temperature, precipitation, and wind. Climate in a wider sense is the state, including a statistical description, of the climate system. A simple way of remembering the difference is that climate is what you expect (e.g. cold winters) and 'weather' is what you get (e.g. a blizzard). (USEPA1)
Z
Zero Emission Vehicles (ZEV)
A vehicle that does not emit harmful emissions during operation. Harmful emissions can have a negative impact on human health and the environment. Electric (battery-powered) cars, electric trains, hydrogen-fueled vehicles, bicycles, and carriages are considered to produce zero emissions.
Zero Waste
The conservation of all resources by means of responsible production, consumption, reuse, and recovery of products, packaging, and materials without burning and with no discharges to land, water, or air that threaten the environment or human health.
Climate and Sustainability Glossary of Terms 15
This memo is intended to provide a starting point for the communities of Minnesota Region 4 in identifying funding solutions for implementation of the Climate Action Plan initiatives. The optimal funding approach appropriate will fit well within each local government’s existing revenue structure, resources, political opportunities, and limitations.
The following is an overview of a range of funding strategies including bonding, tax, municipal fee structures, federal grants, and strategies supporting the private sector.
Click here to return to TOC
Type of Explanation Example Projects
Green Bonds Specifically targeted for funding environmentally and socially responsible projects in areas such as renewable energy, energy efficiency, clean transportation or responsible waste management.
Climate Bonds
Use-of-proceeds bonds where the issuer promise to the investors that all the raised funds will only go to specified climate-related adaptation or mitigation programs and assets.7
Resiliency Bonds
Rebate structure that funds risk reduction by linking insurance premiums to resilience projects. These bonds create incentives for cities to invest in resilience, reducing human and financial costs of catastrophes as a result.
Where: District of Columbia Water and Sewer Authority along with institutional investors Goldman Sachs Urban Investment Group and Calvert Foundation,
When: 2014
What: Issued a tax-exempt Environmental Impact Bond that utilizes a performancebased contract between a public entity and the private sector where payment is based on performance of Green Infrastructure projects funded. The success of this program led to an expansion of their green bonds
Where: City of Hampton, VA along with Quantified Ventures in partnership with the Chesapeake Bay Foundation
When: 2020
What: Provided the City with a $12 million bond to mitigate chronic flooding in the city. The bond is attached to three projects that will add storage capacity to alleviate the volume of stormwater in low- to moderate income communities.
Where: Various cities including the City of Norfolk, VA
Links
https://www.worldbank.org/en/ news/feature/2021/12/08/what-youneed-to-know-about-ifc-s-greenbonds
https://www.dcwater.com/whatsgoing-on/news/dc-water-announcessuccessful-sale-350-million-greencentury-bonds
When: 2015
What: The RE.invest initiative has partnered with a number of cities on a range of infrastructure projects to provide flood protection, using catastrophe modeling to
https://www.climatebonds.net/files/ files/Green%20City%20Playbook.pdf
https://hampton.gov/CivicAlerts.aspx? AID=4714&ARC=9297
https://gca.org/what-are-resiliencebonds-and-how-can-they-protect-usagainst-climate-crises/
https://www.refocuspartners.com/wp -content/uploads/pdf/ RE.invest_Norfolk-City-Report.pdf
Type of Funding
General Taxing and Fee Powers
Explanation Example Projects Links
Levy additional costs on undesired activities or consumption then reinvest funds in policy objectives
Excise Tax on Fuel
In lieu of a carbon tax, if not politically feasible, a fuel tax can also help raise funds for climate actions with the right support. This tax can be levied on energy providers which will likely pass onto consumers, providing additional incentive to reduce energy use and enhance energy savings potential of projects.
Where: City of Portland, OR
https://www.portland.gov/ revenue/ces
When: 2019 https://www.portland.gov/ revenue/ces
What: Created specific retail tax on larger retailers https://www.portland.gov/ revenue/ces
Where: Montgomery County, MD
When: 2022 https:// www.montgomerycountymd.gov/ finance/taxes/excise.html
What: Raised a fuel tax on any person or entity transmitting or distributing energy into the County, including delivered fuels and electricity. While the County currently uses this funding for the General Fund (accounts for over 4% of revenue annually), a pending bill would use a small but significant portion of it towards climate actions.
Carbon Tax Add a cost through the City’s own utility to gas delivery and consumption, and allocate those costs to a fund for climate action. Such a tax could also be applicable across other Municipality energy consumption (buildings and transportation) for similar purposes, or extended to a subsect of private consumers such as industry or other high uses.
Where: British Columbia, CA https://www2.gov.bc.ca/assets/ gov/taxes/sales-taxes/ publications/mft-ct-005-tax-ratesfuels.pdf
When: 2008 https://www2.gov.bc.ca/assets/ gov/taxes/sales-taxes/ publications/mft-ct-005-tax-ratesfuels.pdf
What: Carbon tax applies to the purchase and use of fossil fuels and covers approximately 70% of provincial greenhouse gas emissions.
https://www2.gov.bc.ca/assets/ gov/taxes/sales-taxes/ publications/mft-ct-005-tax-ratesfuels.pdf
Type of Funding
Energy Improveme nt District
Explanation
The EID is operated under a Board with bonding authority, providing a revenue option for specified public purpose projects. Such a district and bonding authority could be created for specific climate action activities, particularly those projects that align with bonded capital, i.e., infrastructure or revenue-generating projects. EIDs may be used to enter into contracts, to buy or lease energy facilities, to increase energy efficiency, and to make it easier and cheaper for energy efficiency and renewable energy businesses to operate in the
Existing Tax Increment Funds
Establish a policy to apply all future funds generated from Tax Increment Funds to initiatives aligned with the sustainability or climate plan. For municipalities with existing Tax Increment Funds set to sunset the funds generated by as they terminate may be used for initiatives aligning with the municipality’s plan decreasing the need to increase rates elsewhere.
Example Projects Links
Where: Bridgeport: CT
https://www.bridgeportct.gov/ content/341307/347097/347109. aspx
Where: 2020
https://www.bridgeportct.gov/ content/341307/347097/347109. aspx
What: Established an Energy Improvement District (EID) to promote the planning, development, and funding of energy-related development.
https://www.bridgeportct.gov/ content/341307/347097/347109. aspx
Where: Miami Beach, FL
https://www.miamibeachfl.gov/wpcontent/uploads/2019/12/SFY2020-24-Adopted-Capital-BudgetBook-Online-Version.pdf
Where: 2022
https://www.miamibeachfl.gov/wpcontent/uploads/2019/12/SFY2020-24-Adopted-Capital-BudgetBook-Online-Version.pdf
What: Establish policy to use $100 million generated by a Tax Increment Financing (TIF) district that is set to sunset in 2022 for underground stormwater projects.
https://www.miamibeachfl.gov/wpcontent/uploads/2019/12/SFY2020-24-Adopted-Capital-BudgetBook-Online-Version.pdf
Type of Funding
"Resilience Penny" Tax
Explanation Example Projects Links
Adopt a property tax increase of $.01 per $100 assessed value dedicated for sustainability and resilience efforts – a “resilience penny” increase. The revenue can be used to directly fund initiatives, or as a repayment source for bond issues. This strategy may be particularly well suited for communities which have not increased property tax rates in many years as it reflects the increased costs and demands placed on municipalities due to
Where: Norfolk, VA
When: 2015
What: City adopted a $0.01 increase in property tax that generates about $1.8 million a year applied to City sustainability and resilience initiatives.
shorturl.at/hoBRU
shorturl.at/hoBRU
shorturl.at/hoBRU
The City’s revenue profile, like all municipalities, is diverse. Meanwhile, a number of the City’s planned projects such as road and side walk improvement projects, building mechanical system replacements, vehicle purchases inherently include aspects related to the initiatives and goals of the Climate Action Plan.
To the extent possible, starting with the largest expenditures, all investments should be evaluated and re-oriented to ensure they serve the City’s climate action policy goals. Future budgeting policy should incorporate a mechanism or review within the budgeting process to support the alignment of new capital budgets with the City’s climate action initiatives.
Additionally, many municipal fee structures may be redesigned to support enhanced revenue potential for the City while also encouraging community choices which align with the plan’s goals. These “progressive” fee structures may serve as a revenue-neutral approach to incentivizing residential and commercial investments that will result in reduced GHG emissions or improved resilience.
Type of Funding Explanation
Depending on tax powers of the Municipality, a separate tax or fee could be levied on specific uses such as stormwater fees. The level of fees could be adjusted, or a temporary fee added, to fund additional climate actions - such as providing stormwater credits for installation of green infrastructure, green roofs, etc. This may involve a more aggressive application for state stormwater permits and fee collection capability.
Example Projects Links
Where: City of Minneapolis, MN
https://www.minneapolismn.gov/ resident-services/utility-services/ stormwater/
https://www.minneapolismn.gov/ resident-services/utility-services/ stormwater/residential-stormwatercredits/
When: 2005
https://www.minneapolismn.gov/ resident-services/utility-services/ stormwater/
https://www.minneapolismn.gov/ resident-services/utility-services/ stormwater/residential-stormwatercredits/
What: Created stormwater utility fee and stormwater credit system.
https://www.minneapolismn.gov/ resident-services/utility-services/ stormwater/
Enhanced Stormwater Fees and Program Expansion
Type of Funding
Carbon Fund
Ordinance
Explanation
A Carbon Fund Ordinance establishes a Carbon Fee to be charged to all development projects. A municipality may make exceptions to the fund as appropriate for the community (for example, exemptions for single family residential alterations, new Accessory Dwelling Units, temporary buildings, and/or building area that is not used as conditioned space). The municipality may also establish the fund on a "sliding scale" providing for discounts and credits for projects meeting the community's energy goals. The goal of a Carbon Fund Ordinance is to encourage the implementation of renewable energy and/or energy efficiency in development projects. The money collected from the Carbon Fund Fee can then be used for community-wide greenhouse gas reduction projects.
Example Projects Links
Where: City of Watsonvill, CA https:// www.cityofwatsonville.org/1765/ Carbon-Fund-Ordinance
When: 2014
https:// www.cityofwatsonville.org/1765/ Carbon-Fund-Ordinance
What: Carbon Fee charged to all development projects with proceeds used to support communit-wide actions.
https:// www.cityofwatsonville.org/1765/ Carbon-Fund-Ordinance Utility
Establish a policy to expend franchise fee revenue on projects and initiatives associated with the municipality's sustainability or climate plan. Policy may also include an incremental increase in the franchise fee in support of the increased renewable energy and energy efficiency initiatives of the municipality. Alternatively, some municipalities are able to use the franchise fee negotiation to directly leverage increased renewable energy service from the electric utility provider (see City of Ann Arbor example: shorturl.at/myHK1 )
Where: City of Minneapolis, MN
https:// energynews.us/2017/09/12/utility
-fee-increase-in-minneapoliscould-help-fund-efficiencyoutreach/
When: 2017
https:// energynews.us/2017/09/12/utility
-fee-increase-in-minneapoliscould-help-fund-efficiencyoutreach/
What: Increased its existing franchise fee on utility customers, directing the fee revenue toward initiatives to reduce energy bills and GHG emissions.
https:// energynews.us/2017/09/12/utility
-fee-increase-in-minneapoliscould-help-fund-efficiencyoutreach/
Franchise Fee Allocation
There are a number of state and federal funding opportunities that support sustainability, resilience, and climate initiatives for local governments. Many of the grant opportunities seek to directly fund relative strategies like improved energy efficiency, renewable energy, low/no emission vehicle adoption and infrastructure, and climate resilience. In addition, a number of long-standing grants like those from the US Department of Transportation, or the US EPA Brownfields Grant do not fund sustainability and climate initiatives directly but can indirectly support these projects as the grant’s goals are well aligned.

Grant funding can often be used to support the establishment of a municipal program, resource, or even staffing position. Unlike municipal tax or fee structure strategies, however, grants do not provide a long-term or permanent funding solution. Consequently, grants may best be viewed as a project-specific funding source, or in conjunction with other funding strategies when supporting long-term initiatives.
This review is intended to illustrate a few high profile and important recent funding laws that have or will be resulting in significant grant opportunities of which municipalities with sustainability and climate plans can take advantage. The grant examples illustrated here are far from exhaustive. We recommend the municipality subscribe to new grant opportunities through Grants.gov and review availability on a regular basis:
https://www.grants.gov/help/html/help/Connect/ SubscribeToAllNewOpportunities.htm
Federal Government Justice40 Initiative
In January 2021, President Biden signed Executive Order 14008 – Tackling the Climate Crisis at Home and Abroad. The executive order established Justice40 as a whole-ofgovernment approach to grant funding. Through this initiative, grants from the federal government are guided to ensure 40% of benefits flow to disadvantaged communities. For communities with one or more area designated as qualifying for Justice40 consideration are likely to have improved competitiveness for grant awards.
According to the Climate and Economic Justice Screening Tool, MN Region 4 may have portions of the community qualifying for Justice40 consideration. The tool, created by the White House Council on Environmental Quality, uses publicly-available, nationally-consistent datasets to identify disadvantaged communities. For a detailed description of the methodology used go here: https://screeningtool.geoplatform.gov/en/ methodology#4.22/42.84/-88.95
The Inflation Reduction Act (IRA) was signed into law by President Joe Biden on August 16, 2022. The law, as passed, authorizes $391 billion in spending on energy and climate change. The funding priorities include investment in climate change mitigation and adaptation, incentives for renewable energy installations and manufacturing, electric vehicle infrastructure, and home energy efficiency. The law represents the largest investment into addressing climate change in United States history. According to
several independent analyses, the law is projected to reduce 2030 U.S. greenhouse gas emissions to 40% below 2005 levels. The chart below shows the breakdown of the IRA spending budget (in $ billions):
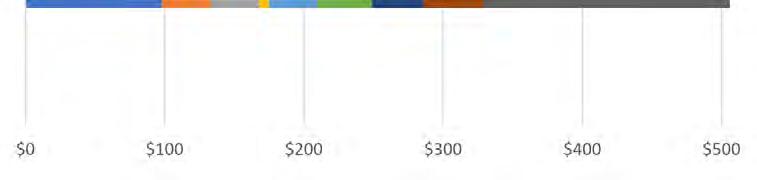

IRA Funding For Municipalities
IRA funds that will support municipal sustainability and climate action includes:
• $27 billion to fund the Greenhouse Gas Reduction Fund, a national green bank to fund GHG reduction projects and to help municipalities start their own green banks.
• $250 million in grants and technical assistance to support municipalities in implementing their sustainable procurement initiatives.
• $5 billion for greenhouse gas air pollution reduction planning and implementation grants.
• $4.75 billion in competitive implementation grants awarded to states, air pollution control agencies, municipalities, or tribes to reduce overall air pollution .
• $3 billion in environmental and climate justice block grants for community-led air pollution remediation initiatives such as health risks from urban heat islands, extreme heat, wood heating system emissions, wildfire, and other climate resiliency and adaptation initiatives.
• $330 million in grants to assist states and municipalities to support the adoption of latest building energy codes.
• $1.8 billion in grants for construction projects to improve walkability, safety, and affordable transportation access.
• $1 billion in rural energy grants supporting infrastructure and providing technical assistance.
• $500 million in biofuel infrastructure and agriculture product market expansion grants.
Health Care Conservation Climate Transportation Air Pollution Clean Fuels and Vehicles Clean Energy Incentives Manufacturing Clean Energy
Federal Grants
The Infrastructure Investment and Jobs Act (IIJA), aka Bipartisan Infrastructure Law (BIL), was signed into law by President Biden on November 15, 2021. The law authorizes $1.2 trillion for transportation and infrastructure spending with $550 billion of that figure going toward “new” investments and programs. Funding from the IIJA is expansive in its reach, addressing energy and power infrastructure, all modes of transportation, water, environmental remediation, public lands,
broadband and resilience. Some of the new programs funded by the bill could provide the resources needed to address a variety of infrastructure needs at the local level. The chart below shows the breakdown of the $550 billion budgeted in the IIJA for new investments (in $billions):

Current Federal Grant Programs Supporting Municipal Action (partial list)
US Department of Energy Energy Efficiency & Conservation Block Grant Program
Cities, towns and villages with a population of at least 35,000 are eligible to apply to and receive grants directly from the U.S. Department of Energy (DOE). Funding is also available from this grant through state managed programs. Municipal efforts this grant can support include:
• Developing and implementing an energy efficiency and conservation strategy
• Conducting residential and commercial building energy audits
• Establishing financial incentive programs for energy efficiency improvements
• Developing and implementing energy efficiency and conservation programs for buildings and facilities
• Developing and implementing programs to conserve energy used in transportation (e.g. flex time for employees; satellite work centers; zoning guidelines or requirements that promote energy efficient development; infrastructure, such as bike lanes, pathways and pedestrian walkways; and synchronized of traffic signals)
• Developing and implementing building codes and inspection services to promote building energy efficiency
• Developing, implementing and installing on or in any government building onsite renewable energy technology that generates electricity from renewable resources, such as solar and wind energy, fuel cells and biomass
US Department of Transportation Raise Discretionary Grants
The Rebuilding American Infrastructure with Sustainability and Equity, or RAISE Discretionary Grant program, is one of several ways communities can secure funding for projects under the Bipartisan Infrastructure Law’s competitive grant programs. The grant is available for planning and capital investments that support roads, bridges, transit, rail, ports, or intermodal transportation.
Strengthening Mobility and Revolutionizing Transportation (SMART) grant program
The SMART Grants Program funds purpose-driven innovation to build data and technology capacity and expertise for state, local, and tribal governments. The focus of the grant is to support demonstration projects focused on advanced smart community technologies and systems in order to improve transportation efficiency and safety. Eligible projects fall into a broad range of categories including Safety and reliability; equity and access; climate and resiliency; and technology integration. The grant has $100 million appropriated annually for fiscal years (FY) 2022-2026.
example grant uses: https://www.transportation.gov/grants/smart/smartillustrative-use-cases
Surface Transportation Block Grant
The Surface Transportation Block Grant program (STBG) provides flexible funding that may be used by States and localities for projects to preserve and improve the conditions and performance on any federal-aid highway, bridge and tunnel projects on any public road, pedestrian and bicycle infrastructure, and transit capital projects, including intercity bus terminals.
Charging and Refueling Infrastructure Grant Program
The IIJA provides $2.5 billion for competitive grants. The U.S. Department of Transportation will administer the competitive grants for installation of electric vehicle charging infrastructure, hydrogen fueling infrastructure, propane fueling infrastructure, or natural gas fueling infrastructure that is directly related to the charging or fueling of a vehicle. The competitive grants are divided into two categories, Community Charging and Corridor Charging. Eligible entities include state or political subdivision of a state, metropolitan planning organization, local government, special purpose district or public authority with a transportation function, Indian tribe, and territory. Grants available under this program include:
Community Grants providing $1.25 billion to install electric vehicle charging and alternative fuel in locations on public roads, schools, parks, and in publicly accessible parking facilities. These grants will prioritize rural areas, low-and moderate-income
neighborhoods, and communities with low ratios of private parking, or high ratios of multiunit dwellings.
Corridor Charging
Corridor Grants providing $1.25 billion to deploy publicly available electric vehicle charging and hydrogen/propane/natural gas fueling infrastructure along designated alternative fuel corridors.
In MN Region 4, I-94 is a designated corridor.
Alternative Fuel Corridors
To be eligible for funding, EV infrastructure under the NEVI Program and the competitive Corridor Charging Grant Program must be located on a designated Alternative Fuel Corridor.
In MN Region 4, I-94 is a designated corridor.
Strategies focusing on support of sustainability and climate action within the private sector increase the depth of action within a community by leveraging public and private investments.
Type of Funding Explanation
Facilitating Private Investment in Community Projects
Property Assessed Clean Energy (PACE) programs allow a municipality to lend its tax collection enforcement power to a public funder, giving them additional assurance when lending for a specified purpose or investment. PACE has been used for energy upgrades in buildings, transportation upgrades, and resiliency investments. PACE for Commercial entities is a more straightforward program. Residential programs come with additional challenges due to lien priority and secondary mortgage market.
Revolving Loan Fund
Supports energy project needs with projected cost savings, such as energy efficiency projects or where other fuel costs can be reduced. The fund will be replenished and used for additional projects over time, ideally, under an energy performance contract (working with a third party to manage energy use for savings). Funding will consider future reduced operations and maintenance, energy savings, insurance savings, and even certain non-energy benefits in the cost-savings analysis to determine project eligibility. However, tangible financial savings are required to replenish the fund.
Example Projects Links
Where: Columbus, OH
https://www.columbus.gov/ sustainable/cap
When: 2020 https://www.columbus.gov/ sustainable/cap
What: The latest draft of the City of Columbus Climate Action Plan proclaims the City will receive $250 million in average annual PACE investments to support its plan’s goals, and to establish a green bank by 2025.21
https://www.columbus.gov/ sustainable/cap
Where: Montpelier, VT
When: 2018 https:// www.vtenergydashboard.org/ stories/montpelier-launchesrevolving-loan-fund-for-energysaving-projects
What: Provided $20,000 from its Reserve Fund as initial seed money for their Net Zero Revolving Loan Fund, with a $10,000 match from their partners with Efficiency
Vermont. The City tracks savings from sustainability projects and reinvests part of those savings for subsequent projects and pays marginal costs of energy improvements within larger capital projects.
Type of Funding Explanation
Green Bank Green banks help fund improvements in buildings and transportation, as well as other resiliency measures such as flood prevention, essentially anything that could be categorized as a public benefit in the legislation. Green banks can come in various forms from a department within the state or municipality, or a separate nonprofit.24
Example Projects Links
Where: Ann Arbor, MI
https://www.a2gov.org/ departments/sustainability/ Documents/A2Zero% 20Climate%20Action%20Plan% 20_3.0.pdf
When: 2021
What: The City’s Climate Action Plan intends to create a $1 million loan loss reserve fund to provide credit enhancements for residents with lower credit scores and expand capacities to undertake energy efficiency and renewable energy improvements to low-income residents.
https:// coalitionforgreencapital.com/
We are deeply grateful for the community collaboration and input that went into this plan. Below are some of the main contributors that made Minnesota Region 4’s first Climate Action Plan possible:
Minnesota Region 4 Climate Action Plan Project Lead
Mark Kaelke Assistant Community Planner, West Central Initiative
Climate Action Planning Team
Kristie Taffe Citizen
Christopher Taffe Citizen, Auto Body Business onwer
Corey Kratcha
WCI Board, CEO biocomposite manuf. Renewables
Crystal Rayamajhi City of Moorhead Sustainability Coordinator
Spencer McGrew
Otter Tail Cty. Aquatic Invasive Species Specialist
Krehl Stringer Pastor, environmentalist
Paula Ramirez Concordia student, Sustainability intern
Sandy Gunderson Becker Cty. Waste Mgmt.-recycling
Griffin Peck Sustainability Coord. City of Morris
Bill Henke Friends of Tamarack, Issac Walton League
Polly Andersen Sharing team role with Bill Henke
Elizabeth Pihlaja WCI Board, Tribal menber
Brock Berglund
Julie Anderson
Steve Lindaas
Monica Hedstrom
Matt Smith
Ed Snetsinger
Amy Moore
Anna Wasescha
Jill Amundson
Benjamin Velani
Sarah Casey
Co-Owner Ida Graves Organic Distillery
Douglas Cty. Emergency Management Director
Moorhead City Council, Physics Professor
White Earth Nation, Natural Resource Director
White Earth Nation, Public Works Director
White Earth Nation, Emergency Manager
White Earth Nation, Gap Coordinator
Executive Director, West Central Initiative
Innovation Strategist, West Central Initiative
Lead for America Climate Fellow, West Central Initiative
Director of Strategic Communications, West Central Initiative
Click here to return to TOC
Prepared By:
2515 White Bear Ave, A8
Suite 177
Maplewood, MN 55109

Contact: Ted Redmond
tredmond@paleBLUEdot.llc