per school year. Follow-up surveying, with help from WCI, will be done so that local, state and national officials can monitor trends over time in the travel habits of students traveling to and from school.
KEY FINDINGS – PARENT SURVEY Below are the more significant highlights gleaned from the 2014 parent survey for students grades Kindergarten (K) through Fifth. The results provide valuable information about parental attitudes and opinions relevant to SRTS at the Glyndon-Felton Elementary School and create a benchmarking baseline, which future analysis can be compared against.
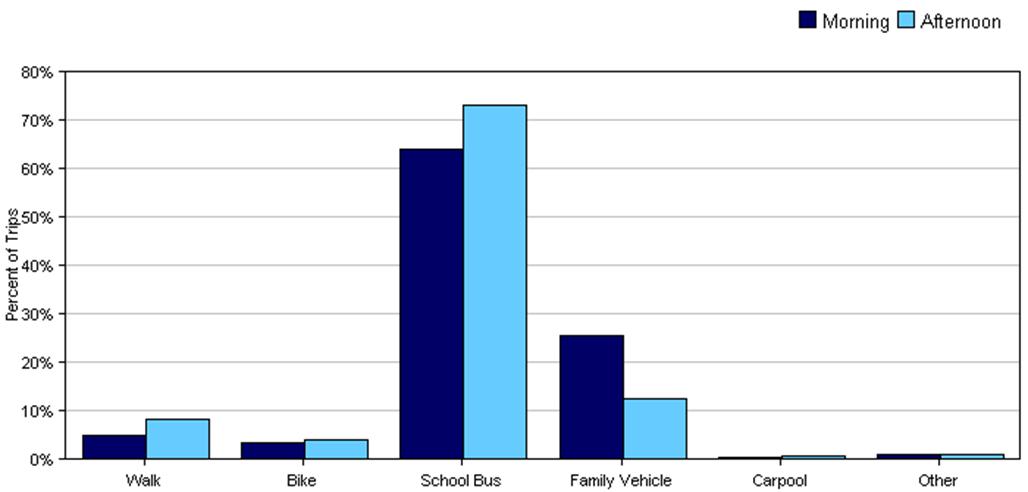
The 2014 Parent Survey of students at the Glyndon-Felton Elementary School found that a total of 2.8 percent of children walked or biked to school and a total of 7.8 percent walked or biked from school. These results aligned fairly well with the results from the 2014 teacher-administered student travel tally, which had slightly higher combined walk and bike mode share numbers of eight percent of children walking or biking to school in the morning and 12 percent walking or biking from school in the afternoon. When compared to the 2013 national SRTS combined walk and bike mode share numbers of 17.4 percent in the morning and 20.2 percent in the afternoon, the percentages of students walking and bicycling to the Glyndon-Felton Elementary School are below average.
19
Further WCI staff analysis investigated the travel habits of students who live within a distance that the MnDOT SRTS office considers walkable and / or bikeable. For children in grades PreK-5 (Glyndon-Felton Elementary serves students K-5), a distance of one-half mile from the school is believed to be an appropriate “Walk/Bike Zone.” Using the parent survey data of children who live within one-half mile of the school revealed that 9.6 percent students walk and/or bike to school and that 16.1 percent walk and/or bike from school. This is not in keeping with the Walk/Bike Zone concept as defined and promoted by MnDOT. Clearly there is room for improvement. One-half mile is a 10-minute walk for an adult and no more than a 20-minute walk for a child of the ages served at the Glyndon-Felton Elementary School. Other results included:
Across all grades that attend the Glyndon-Felton Elementary School, the school bus was the most frequently used mode of travel to and from school followed by the family vehicle.
Of parents who currently do not allow their children to walk or bicycle, distance was the main reason parents do not allow their children to walk or bicycle to/from school.
19
The National Center for Safe Routes to School. Trends in Walking and Bicycling to School from 2007 to 2013. March, 2015. Available at http://saferoutesinfo.org/sites/default/files/SurveyTrends_2007-13_final1.pdf. Accessed on April 1, 2016.
P a g e 70 | Chapter 8: Standardized SRTS Survey Analysis