13 minute read
Pare nt Surve y – Se le ct Q uestions


Safety factors, such as traffic speed and volume, were chosen more frequently by parents as barriers to their children walking or biking to school, more so than crime or violence. A vast majority of parents (88 percent) believe that the Glyndon-Felton Elementary School neither supports nor actively encourages children to walk and bike to and from school. A vast majority of parents (80 percent) believe that walking and biking to and from school is, in some degree, healthy for their child. 46 percent believe it to be healthy and 34 percent very healthy.
PARENT SURVEY – SELECT QUESTIONS
For the complete Parent Survey results see Appendix A.
The Glyndon-Felton Elementary School serves grades K-5. In September 2014, 400 Parent Surveys were distributed which corresponds with the total school enrollment of 398 students at that time. Of that 400, 121 surveys were returned, met the criteria to be entered in the National Centers’ database, and are included in this report.
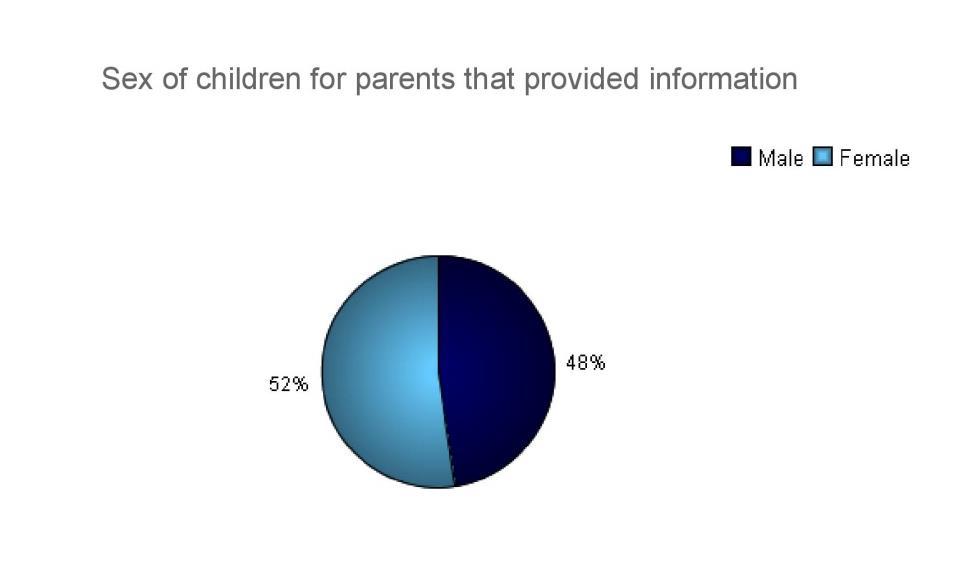
Question – Is the child who brought home this survey male or female? Approximately 48 percent of questionnaires were completed for male and 52 percent for female students.
Figure 26: Breakdown of male/female student representation in the parent survey.
Chapter 8: Standardized SRTS Survey Analysis | P a g e 71
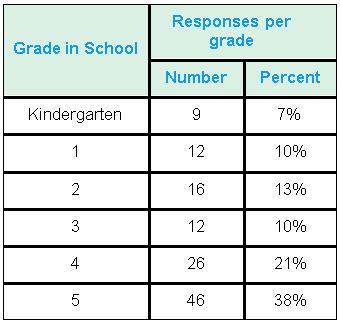
Question – What is the grade of the child who brought home this survey? Fifth grade followed by Fourth and Second grade had the highest number of responses, followed by the other three grades (see Table 7). The percentages listed in the right column are not the percent of survey returns versus the total number of students in each grade. It is simply the percentage of surveys returned from that grade as part of the total 121 returned from the entire school. This is also what “percent” represents in all following survey questions.
Table 7: Glyndon-Felton Elementary School grade levels of children represented in parent survey (Fall 2014).
Grade levels of children represented in survey
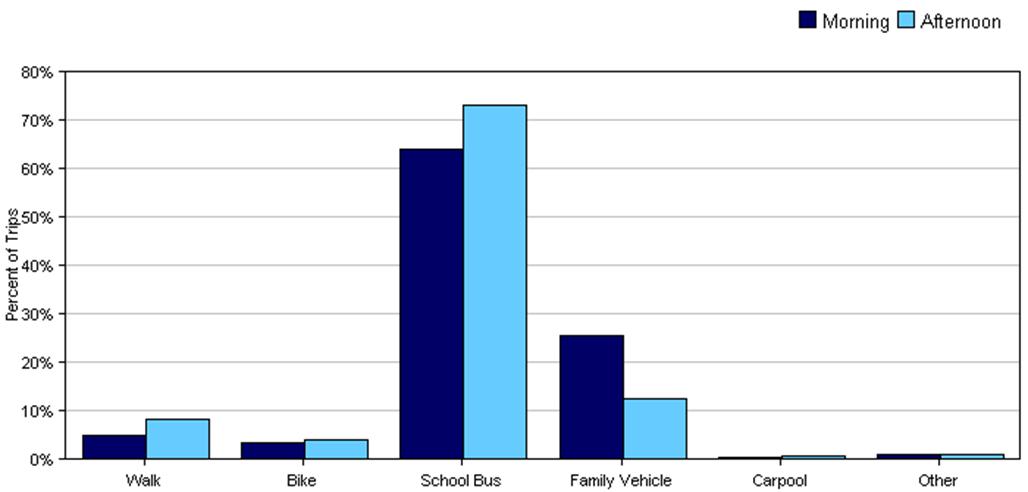
Question – On most days, how does your child arrive and leave for school? A comparison of a child’s typical travel mode of arrival at and departure from school, as reported by parents, is shown in Figure 27 and Table 8. The survey is structured so that parents can give an answer for both how their child arrives at school and then leaves from school. Based on the parent responses, the school bus was the most common mode of travel both to and from school representing 68 percent and 79 percent of all trips, respectively. The second most frequently chosen mode for travel to and from school was the family vehicle at 28 percent and 13 percent, followed by walking at two and seven percent.
The modes of travel chosen for school departure were notably different than during arrival. There appears to be a switch from the family vehicle to the school bus and walking in the afternoon which likely corresponds to the ease of parents driving children to school as they are headed to work.
P a g e 72 | Chapter 8: Standardized SRTS Survey Analysis

Figure 27: Typical mode of arrival at and departure from school (Fall 2014)
Table 8 Typical mode of arrival at and departure from school (Fall 2014)

No Response Morning: 0 No Response Afternoon: 1 Percentages may not total 100% due to rounding.
Chapter 8: Standardized SRTS Survey Analysis | P a g e 73
Question – How far does your child live from school? Parents were asked to give the distance from their home to the school. This question is asked in a way so that parents likely estimate that distance. These results are shown in Table 9. This is recorded because what parents estimate will have an effect on their mode choice for their child. Often parents will overestimate that distance and drive their child to school when walking and/or biking is a viable, safe and timely alternative.
Table 9: Parent estimate of distance from the child’s home to school.
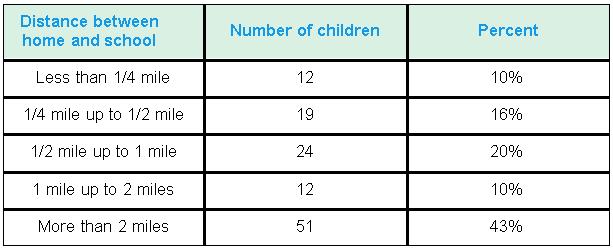
Don't know or No response: 3 Percentages may not total 100% due to rounding.
P a g e 74 | Chapter 8: Standardized SRTS Survey Analysis
Cross-reference – Distance, by arrival and departure modes These estimated distances are then cross-referenced with actual arrival and departure mode choice (Tables 10 and 11).
Table 10: Parent estimate of the distance from child’s home to school and mode choice to school (Fall 2014).
School Arrival

Table 11: Parent estimate of the distance from child’s home to school and mode choice from school (Fall 2014).
School Departure
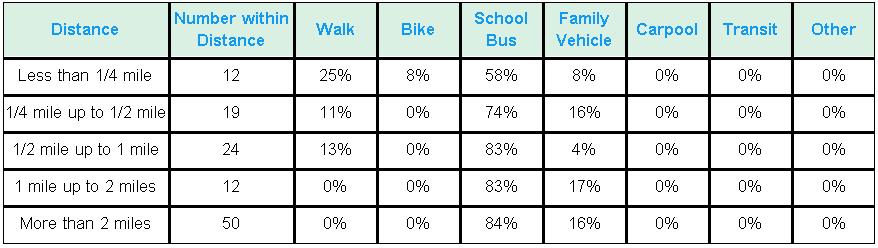
According to the MnDOT Walk / Bike Zone concept, one-half mile is considered an appropriate distance for students in grades PreK through Fifth to walk and/or bike to and from school. Further, WCI staff analysis of the take-home survey data shows that 9.6 percent of children surveyed who live within one-half mile of the school walk and/or bike to school in the morning (Table 12). In the afternoon however, that number does increase but only to 16.1 (Table 13). For students living within one-half mile of the school, use of the school bus and family vehicle to travel to and from school is likely due to habit and convenience posed by both modes, the perceived and/or real dangers posed by automobile traffic on the streets of Glyndon particularly Parke Ave, and/or the heavy amount of rail freight traffic on the BNSF railway.
Chapter 8: Standardized SRTS Survey Analysis | P a g e 75
Table 12: School arrival modes for K-5 students (raw numbers and percent) living within ½ mile of the Glyndon-Felton Elementary School. A half mile is considered the appropriate maximum walking / biking distance for the K-5 students that attend the Glyndon-Felton Elementary School.
Table 13: School departure modes for K-5 students (raw numbers and percent) living within ½ mile of the Glyndon-Felton Elementary School. A half-mile is considered the appropriate maximum walking / biking distance for the K-5 students that attend the Glyndon-Felton School.


P a g e 76 | Chapter 8: Standardized SRTS Survey Analysis
Question – What of the following issues affected your decision to allow, or not allow, your child to walk or bike to/from school? Parents were asked to identify issues affecting their decision to allow, or not allow, their child to walk or bike to and from school. Parents were given a list of options to choose from, with the ability to select as many reasons they felt applied. The results from this question were then split by whether parents did allow their child to walk or bike to and from school, or did not.
For this question, 102 parents said their “Child does not walk/bike to school,” six parents said their “Child walks/bikes to school,” and 13 parents did not answer.
Figure 28 illustrates the issues affecting parents’ decision to not allow their child to walk or bike both to and from school. For the 102 parents of children who do not walk or bike to/from school, the top four issues affecting their decision are “distance” (79 percent), “speed of traffic along route” (69 percent), “amount of traffic along route” (68 percent), and tied for fourth “sidewalks or pathways” (64 percent and “weather or climate” (64 percent). The four least frequently cited issues are the “convenience of driving” (42 percent), a lack of “crossing guards” (39 percent), “child’s participation in after school programs” (37 percent), and the lack of “adults to bike/walk with” (36 percent).
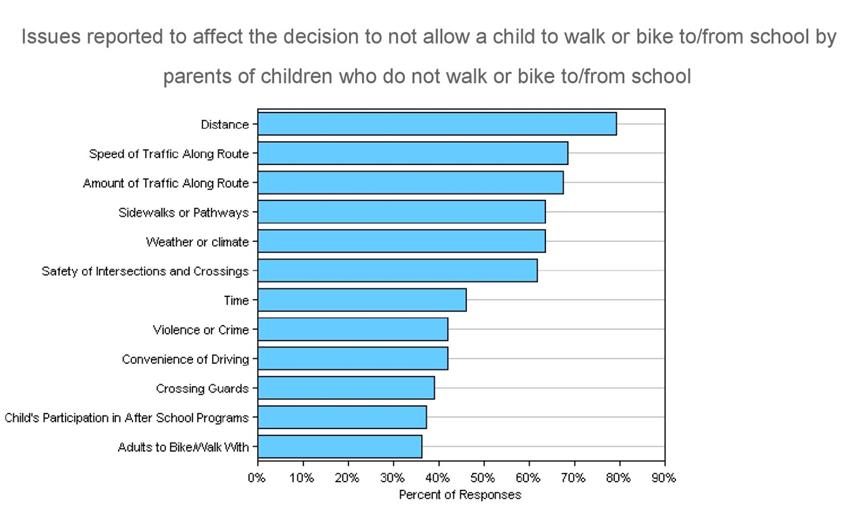
Figure 28: Issues reported to affect the decision to not allow a child to walk or bike to/from school by parents of children who do not walk or bike to/from school (Fall 2014).
Chapter 8: Standardized SRTS Survey Analysis | P a g e 77
Figure 29 illustrates the results for the six parent respondents who allow their children to walk or bicycle to/from school. The top four issues affecting their decision are “distance” (83 percent), “amount of traffic along route” (83 percent), and tied for third “speed of traffic along route” (67 percent) and ”time” (67 percent). The four least frequently cited issues, all tied at 17 percent are “convenience of driving,” “crossing guards,” “violence or crime,” and “adults to bike/walk with.”
Note: Because of the low response rate from parents that do allow their children to walk and bike to school (six), the results from this question are likely not statistically significant and likely cannot be compared to the general population or parents that do allow their children to walk and bike to school.

Figure 29: Issues reported to affect the decision to allow a child to walk or bike to/from school by parents of children who already walk or bike to/from school (Fall 2014).
P a g e 78 | Chapter 8: Standardized SRTS Survey Analysis
Question – In your opinion, how much does your child’s school encourage or discourage walking and biking to/from school? Figure 30 shows the results of parents’ opinions about how much their child’s school encourages or discourages walking and biking to and from school. A vast majority (85 percent) feel that the GlyndonFelton Elementary School neither encourages nor discourages walking and biking. However, of the parents that had an opinion, over four times as many parents felt that the school encourages the activity to some degree (13 percent - combined encourages 11 percent and strongly discourages two percent) versus those parents that believe the school discourages it (three percent combined – discourages two percent and strongly discourages one percent). Again, only 13 percent of parents believe that the Glyndon-Felton Elementary School encourages walking and biking to school to some degree. A vast majority of parents (88 percent) believe that the Glyndon-Felton Elementary School neither supports nor even discourages children from walking and biking to and from school which indicates that the message about SRTS is not getting out to the community.

Figure 30: Parents’ opinions about how much their child’s school encourages or discourages walking and biking to/from school.
Chapter 8: Standardized SRTS Survey Analysis | P a g e 79
Question – In your opinion, how much fun is walking or biking to/from school for your child? Figure 31 shows the results of parents’ opinions about how much fun walking and biking to and from school is for their child. While a majority (54 percent) have a neutral opinion, a combined 41 percent of parents believe it to be fun to some degree (32 percent fun and, nine percent very fun), and only five percent believe it to be boring to some degree (four percent believe it to be boring, one percent very boring). Of those that did have an opinion, over eight times as many parents thought walking or biking to and from school to be fun or very fun compared to those that thought it to be boring or very boring.

Figure 31: Parents’ opinions about how much fun walking and biking to/from school is for their child.
P a g e 80 | Chapter 8: Standardized SRTS Survey Analysis
Question – In your opinion, how healthy is walking or biking to/from school for your child? Figure 32 shows the results of parents’ opinions about how healthy walking and biking to and from school is for their child. A vast majority of 80 percent of parents believe it to be healthy to some degree for their child (46 percent healthy and 34 percent very healthy). 19 percent had a neutral opinion and zero percent believed it to be unhealthy and one percent believes it to be very unhealthy. Of those parents that had an opinion, 80 times as many parents felt that walking or biking to and from school was healthy for their child.
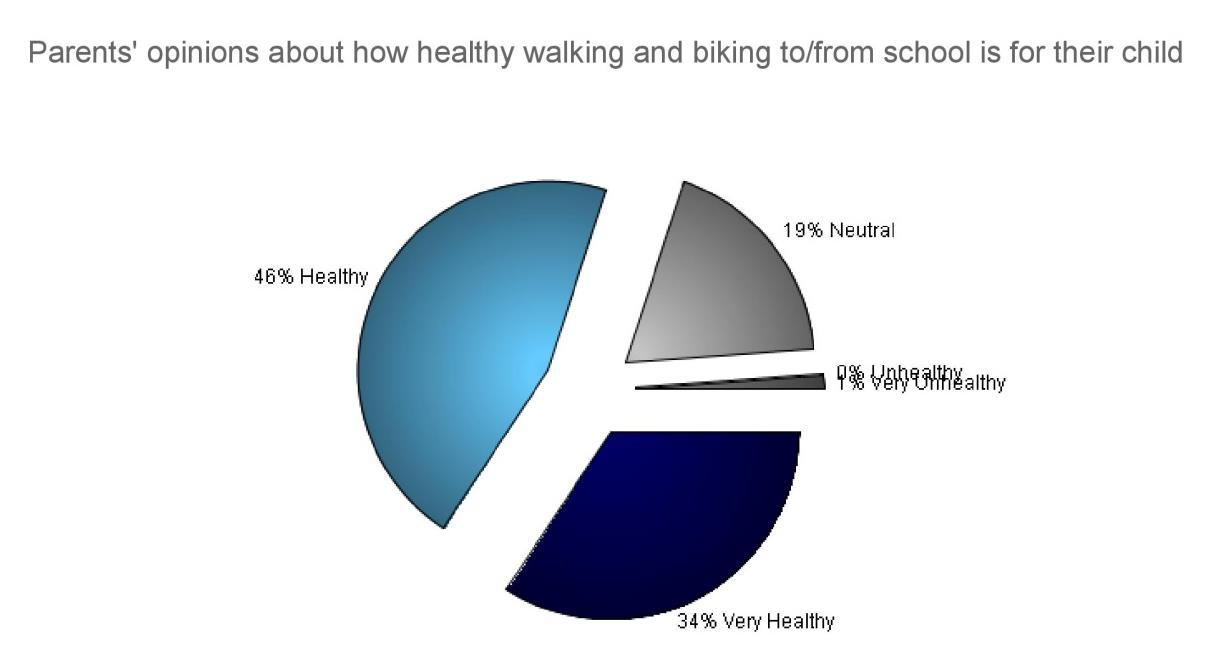
Figure 32: Parents’ opinions about how healthy walking and biking to and from school is for their child.
Chapter 8: Standardized SRTS Survey Analysis | P a g e 81
Parent Comments
Survey ID Comment
1247355 With no crossing guards, the haphazard pull-up area for drop off, no sidewalks, high school drivers and no teachers or school person monitoring outside after school, I feel a lot could be done to provide safe walking and biking for students. It looks now like an accident waiting to happen. 1247366 We would let her walk with friends but the road is too narrow and traffic isn't always slowing down. Worrisome! Also has to carry a saxophone. 1248007 Weather plays a huge amount - No rain in morning and afternoon yes and parents work - can not take off to bring home in bad weather. Hard to carry an instrument (band) and ride a bike - nearly impossible if she plays the trombone. 1248010 Two of my children are attending school in Dilworth so walking to school is unacceptable for them, however, my youngest may walk to school in a few years. 1248075 My kids do ride bike, but I have taught them to be extremely careful, due to the very busy street. 1248115 Parke Ave is very dangerous. There needs to be sidewalks put in. I fear that one day a child will be killed because of the narrow road with no sidewalks. 1248158 If there were sidewalks there would be a lot more kids walking to and from school. 1248662 For children who live rural, we would be happy to bring her bike to school September through October and April through May for PE Classes or before school/after school bike hike/ride around town if there was a program started. 1248903 Kids live in Dilworth and go to school in Glyndon site. 1248053 No walking or riding bikes to or from school during snow season. Too dangerous. 1248119 I would love to have my son ride bike to school but the road is unsafe. It's narrow, busy and there are no sidewalks.
1248138
Railroads are my biggest issue with walking and biking. 1248152 If we had sidewalks in our town, I would allow my children to walk to school. 1248227 The bus stops 2-3 blocks from out house and our house is not visible to the kids when they get off. This makes me nervous in the winter with our extreme temperatures when I will not be at home to make sure they safely get inside. 1248902 I would 100% support my child walking or biking to school but too much traffic on the only road to get to the school and there are no sidewalks or alternative streets my child could take to get there. 1248002 I have two children in both Dilworth and Glyndon Schools, this is just really filled out for my Glyndon school. 1248088 If I could be sure they would pay attention to their surroundings and not be distracted and go somewhere without telling someone, I may let them try by themselves. They still trust people too much and may trust the wrong type of person which scares me. I don't like the idea of them crossing RR tracks alone.
1248091 Don't want her to get in a car with a stranger.
1248177
We live too far away to consider walking or riding bike. 1248900 We live too far from school for walking and biking to be an option. 1247363 No sidewalks in Glyndon to walk - very dangerous. Students and adult drive too fast on Parke Ave, they text and are on cell phones as well. 1248079 My child has to be responsible enough to walk/ride to school before I would allow it. However, I am concerned about the high school kids driving along his route.
P a g e 82 | Chapter 8: Standardized SRTS Survey Analysis