
WatershedHappinessReport
AQuantitativeStudyofHappiness
WatershedSchool8thGradeClass,2024-2025
ProjectHappiness&TransformationsofThinkingandSelfExpeditions
IncollaborationwiththeUniversityofColoradoBoulder’sCenterforHealthy MindandMood
January30,2025
4.

Introduction
EllaCarden&HarrySherman
Happinessisastateofbeing:energized,active,motivated,healthy,safe,content, connectedtootherpeople,resilient,livinginthemoment,believinginthefuture,and believinginmyself.
—WatershedSchool8thGradeClass,2024-2025
ExecutiveSummary
Happinessisapowerfulandcomplexideathathasmanydifferentmeaningstodifferent people.Peoplecanfindhappinessinnature,socializing,trust,andeverydaylife.Researchers worldwidecontinuetosearchformoreaboutwhat,how,andwhypeoplearehappy.Lookingat happinesswithincommunitiestounderstandwhereit'scomingfromisbeneficial.Datafrom Chicagohighschoolsshowthatstudentsurveyscanhelpconveyinformationaboutschool qualityandschoolclimate,whichcanhelpaffectstudentachievement(Jackson,2020).Research showsthataddingmorehappinessintolifeisfarmoreimportantthanmerelyfeelinggood (Mead,2019).
TheWatershed8thgradeclassco-designedahappinesssurveywithresearchersAlicia Sepulveda,Ph.D.andRoselindeKaiser,Ph.D.oftheUniversityofColoradoBoulder’sCenter forHealthyMindandMood.Themainpurposeofthissurveywastobetterunderstandoverall happinesswithintheWatershedcommunity.Westartedtheprocessofcreatingthesurveyby brainstormingquestionsandcategoriesthatwouldbebeneficialtoimplementinoursurvey.The threemainthemesthatwecameupwithwereactivities(beinginnature,playandhobbies,etc.), socialworld(trust,safety,support,etc.),andmentalhealth.Thesethemesresultedinthe developmentofabrandnewscaleformeasuringhappiness:theWatershedHappinessSurvey.
Thepurposeofthesurveywastodigdeeperintotheresultsandlookforcorrelationsas wellasfindingsthatwouldhelpusprovehypotheses.Ourmainfindingswereseparatedinto eightcategories:theWatershedScale,theSubjectiveHappinessScaletovalidatemeasures,the agesofhappinessintheschool,happinessbetweenteachersandstudents,negativestressvs. happiness,trust,socialization,andactivities.
SummaryofFindings
Thesurveywassentouttoeveryoneintheschoolincludingstaff.Thetotalpopulationis 145,with117studentsand28staffmembers.101peopletookthesurveywhichisenough respondentstohaveagoodrangeofdata.Themajorityofrespondentswerestudentsages10to 18,althoughtheagesofrespondentsrangedupto60yearsold.
Thesurveyresultswerescoredoutofthemaxpossiblescoreof112.Mostpeopleranked inthe70to95rangeforhappiness.However,someoutlierswereobserved,whorankedinthe rangeof30-50whichmaysuggestlowerlevelsofhappinessforthoseindividuals.Thisindicates thatWatershedSchoolranksrelativelyhighforhappiness.
Themainfocusthatwehadafterlookingatthedatawastocreatehypothesesbasedon eachsectioninthesurveysandtestthemusingourgraphs.Someexamplesofcorrelationsthat werefoundwereactivitiesandhappiness,sociallifeandhappiness,andhappinessbetween teachersandstudents.
Methods
ThisstudyexploredthehappinessofstudentsandstaffintheWatershedcommunity.This surveywasco-createdbythe8th-gradeclassatWatershedandAliciaSepulveda,Ph.D.,and RoselindeKaiser,Ph.D.Tocreatethesurveywehadmultiplebrainstormingsessions; our partnersatCUBoulderdraftedasurveybasedontheoutputfromourcollaborativemeetings.We workedasaclasstoprovidefeedbackandrequestrevisionsforthefinalsurveyproduct.A finalizeddraftwascreatedandadministeredtotheWatershedcommunityoverfourdaysfrom January14-17,2025.
Thissurveyhasfiveparts,threeofwhichwerecreatedbyWatershedstudents:the WatershedHappinessSurvey,ActivitiesMeasure,andSocialMeasure.Inadditiontoourscales, weincludedvalidatedscalestoensurethatoursurveywasavalidmeasureofhappiness.Our validatedscalesincludedtheShortDepressionScale,SubjectiveHappinessScale,andLife EventsScale.Thequestionsweregivenascoresothattheresultscouldthenbetransferredinto data.Thesurveywasadministeredusing REDCap andkeptentirelyanonymous.
Afteradministeringthesurvey,Drs.SepulvedaandKaisertooktheresultsandgavethem toaresearchteamatCUBoulder,whotestedavarietyofcollaborativelycreatedhypotheses.
Thestatisticalprogram“R”wasusedtoanalyzethedata,andtheCUresearchteam“cleaned” thedata,removingincompleteresults,andthen“scored”it,makingitmucheasiertoworkwith andunderstand.Finally,Watershedstudentsperformedfurtheranalysisoftheresults,creating thisreport.
Analysis
Fig. 0a: Overall Happiness

Thisanalysisfocusesontworesults: respondentdemographicsandoverall happiness.
Figure 0a showsthefrequencyofindividual happinessscores.Thisgraphshowsthe distributionofhappiness;asyoucansee,the averagelevelofhappinesssitsbetween75-87.
Tocalculatetheexactaverageofhappinesswe performthissimpleoperation: 7668 112 = 68 5
Thetopvalueistheaverageusingthemeanof thescores,andthebottomvalueisthe maximumpossiblehappinessscorefortheWatershedHappinessScale.Theaverage “score”whenadjustedis68.5,butthisvaluecouldbeskewedbecauseofthelowoutliers whicharealmosthalfoftheaverageandthehighoutliersarealmostdoubletheaverage. Tomeasuretheaveragemoreaccurately,wecancalculateusingthemedianof79. Adjustingthemedianscoregivesus:70.53.Thereasonforperformingthisoperationisto comparetoarecent(2023)nationalaverageofself-reportedlifesatisfactionintheUnited States,whichis6.72/10,or67.2,asseeninthegraphiconthenextpage.

(Ortiz-Ospina&Roser,2024)
Thisdataandcomparisonessentiallyshowtwothings:
1. TherearemorehappypeoplethanunhappypeopleintheWatershedcommunity.
Ofcourse,thisisn'tthecaseforeverymemberoftheWatershedcommunity; certainmembersareexperiencingmuchlowerhappiness.
2. TheWatershedcommunityishappierthanthenationalaverage.

Mostpeoplewhofilledoutthesurveywere betweentheagesof10and20.Staff membersrangedfromages25-60.The averageageofthepeoplewhotookthe surveywas20.Thisinformationcouldbe highlyskewedbecauseofthefewolder people.Themode,themostcommonageof respondents,is16yearsold.
Figure 0b shows the age distribution of respondents.

Discussion
Figure 0c, the final graph, represents the Respondent's gender identity
Mostrespondentsidentified asBoyorMaleandGirlor Femalewithfew identifyingasNon-binary andFluidorDynamic.
Whatwasthepointofthissurvey?Thissurveyrevealedalotofimportantinformationas explainedaboveandintherestofthisreport.But why doasurveylikethis?Firstoff, metacognition(thinkingaboutthinking)isavaluableprocess;itisbeingawareorunderstanding yourthoughtprocesses.Metacognitionisalsoimpactfulforacademicperformance: “Metacognitionisoneofthemosteffectivewaystoimprovestudents’academicperformance andtohelpstudentsachievetheiracademicpotential”(Lucero&Morell,N.D). Bycompleting thissurvey,wearedoingtheactofmetacognitionbylookingataresultofthegeneraltrendin ourcommunityandtryingtounderstandandarticulatethat.
Secondly,accordingtoCollinsetal.,“CommunityBasedParticipatoryResearch(CBPR) isassociatedwithimprovedoutcomesforcommunitymembersinvolvedintheresearchprocess aswellasincreasedcapacityatthecommunitylevel”.ThemainideaofCommunity-Based ParticipatoryResearchis“toequitablyengagecommunitiesintheresearchprocessandthereby ensuretheirbenefitfromresearch.”Thisisexactlywhatthissurveydid.
Recommendations
Ineachsectionofthereportthatfollows,youwillfindrecommendationsforour communityaboutthevariousthemeswehaveexploredthroughoutourclassesandsurvey process.Theoverallsurvey,though,couldbenefitfrombeingcondensedandsimplifiedinthe futuretocollectmoreresponsiveness.ABMCmedicalresearchmethodologystudyin2011 assessedwhetherornotshortersurveysgetmorerespondents(Sahlqvistetal.,2011).Theygave participantsalongerversionofasurveyaswellasacondensedversion.Thestudyfoundthat participantswhotooktheshortversionofthesurveyweremorelikelytocompleteit. Anothermethodthatcouldbeincludedinfuturesurveyswouldbemakingresponses required.Requiredsurveyquestionscanalsoincreasecompletionrates.A benefitofrequired responsesisthattheyhelptopreventoverlookedquestionsandallowrespondentstoseemissed questionsandanswerthem(Sauro,2016).Althoughtherearesomeconslikeresponsebias, whichmeanslyingorrandomlyansweringquestionsthatcanincreasewithrequiredresponses,it wouldoverallbeagoodthingtoconsider.Datacleaningisalsoanothertoolthathelpswiththis. Editingandimprovingthesurveyinthefuturewillhelpwiththeresultsandincrease responses,whichwillgivemorevaryingresults.Thisinturnleadstomoreinformationand findingsthatwillmakeforabettersurvey.
Acknowledgements:
WewouldliketothankandgreatlyappreciateDrs.SepulvedaandKaiserforco-creating andleadingusthroughtheprocessofthissurvey.Theydidanamazingjobhelpingusgenerate thesurveyquestionsandhelpinginformusaboutvalidatedscales,goodquestions,andgraphs. WealsoappreciateShayCastle,Editor-in-Chiefof Boulder Weekly,whohelpedusbrainstorm themesandareasofstudyforoursurvey.Abigthankstotheresearchteamwho‘cleaned,’ scoredthedata,andturnedthemintographs.Acknowledgmentsgotooureducators,Amy RobbinsandLockeHassett,aswell,forfacilitatingthisprocessandhelpingtomakeeverything happen.Lastly,wewouldliketothankalloftherespondentswhotookthetimetotakeour survey
References
Collins,S.E.,etal.(2018).“Community-basedparticipatoryresearch(CBPR):Towards equitableinvolvementofcommunityinpsychologyresearch.” The American psychologist, 73(7),884–898.https://doi.org/10.1037/amp0000167
Jackson,K.(2020).“LinkingSocial-EmotionalLearningtoLong-TermSuccess.” Education Next, 21(10), https://www.educationnext.org/linking-social-emotional-learning-long-term-success-stud ent-survey-responses-effects-high-school/.
Lucero,R.,Morrell,S.(N.D).“Metacognition’sRoleinLearning.”ColoradoStateUniversity: TheInstituteforLearningandTeaching.
https://tilt.colostate.edu/metacognitions-role-in-learning/#:~:text=Metacognitio n%20refers%20to%20thinking%20about,(Wilson%20and%20Conyers%20110).
Mead,E.(7November2024).“6BenefitsofHappinessAccordingtotheResearch.” PositivePsychology https://positivepsychology.com/benefits-of-happiness/.
Sahlqvist,S.,Song,Y.,Bull,F.etal.“Effectofquestionnairelength,personalisationand remindertypeonresponseratetoacomplexpostalsurvey:randomisedcontrolledtrial.” BMC Med Res Methodol 11,62(2011).https://doi.org/10.1186/1471-2288-11-62
Sauro,J.(2016).“ProsandConsofRequiringSurveyResponses.” MeasuringU. https://measuringu.com/requiring-responses/.

Introduction
ValidatingtheWatershedHappinessScale
EmersonBeckhamandJamesVanHorn
Thissectionexploresthehypothesisthatpeoplewhoreporthighhappinessonthe WatershedHappinessScalewillscorethesameorhaveahigherscoreontheSubjective HappinessScale.TheSubjectiveHappinessScaleisaninternationallyrecognizedvalidated scale,usedtomeasurehappinessandoverallwell-being(Lyubomirsky&Lepper,1999).Weaim toseeifpeoplewhoreporthighhappinesslevelsontheWatershedHappinessScalewillreport similaranswersontheSubjectiveHappinessScaleinordertoaddvaliditytotheWatershed Scale.
SummaryofFindings
TheresultsshowedthatpeoplewhotooktheWatershedsurveyreportedthesameorclose amountofhappinesscomparedtothevalidatedsurvey,demonstratingthatourhypothesiswas correct.OneofthekeytrendsthatwasshownwasthatthehigherupontheWatershedScale,the higherpeoplewereonthevalidatedscale.Theyhadnearperfectcorrelation,almosthavingan equivalentrelativescoreoneachsurvey.Afteranalyzingthedata,itindicatesthattheWatershed Scalecanworkintherealworldjustthesameasthevalidatedscale.
Methods
ThehypothesisstatesthatpeoplewhoreporthigherhappinessontheWatershed HappinessScalealsoreporthigherhappinessonthevalidatedscale.Thevalidatedmeasure (SubjectiveHappinessScale)wasdevelopedbytheresearchersSonjaLyubomirskyandHeidi Leper,andhasbeenusedfordecades.
Thehypothesiswasmeasuredbygivingtwodifferenthappinesssurveystothemembers oftheWatershedcommunity,andcomparingscores.Watershedstudentsworkedwithtwo representativesfromCUBoulder’sCenterforHealthyMindandMoodtolookattheresultsand createagraph.Inthiscase,ascatterplotwascreatedtohelpfindthelineofbestfittoillustrate thecorrelationbetweentheindependentvariable(WatershedScale)andthedependentvariable (theSubjectiveHappinessScale).
Analysis
Whenexaminingthedata,wenoticedthatthehypothesisisgenerallysupported,witha fewoutliers.ThisgivesustheconfidencethattheWatershedScaleisaveryeffectivesurveyto measuresubjectivehappiness.Thistrendisclearlyvisibleon figure 1 below.Thetrendisshown bythelineofbestfit.

(fig. 1)
Interestingly,thedataalsorevealedthatthechancesofthehypothesisbeingfalseisvery, veryslim.TheP-valueisthechanceoftheresultsbeingrandom,sothelowerthenumberis,the lesslikelythatthechanceswererandom.TheR-valueshowsthestrength,direction,andquality ofthecorrelation.
P<0.001→lessthana0.1%chanceofrandomoccurrence
R=0.811→Strongpositivecorrelation
Discussion
TheimplicationsofthisresearchsuggestthattheWatershedHappinessScaleisuseful andcouldpossiblybeusedlaterdownthelinetogetagaugeonoverallschoolhappiness.Asa resultofcreatingthissurvey,welearnedthathappinessisinfluencedbyalargenumberof factors,includingourculture,biology,emotions/feelings,beliefs,socialrelationships,and activities.Becauseofthis,theprocessofmeasuringhappinessisprettycomplex!Infact,some researcherssuggestthat“itisnearlyimpossibletodrawdefinitiveconclusionsfromhappiness surveys”(Brooks,2019).
Wealsolearnedthatyouneedtousesimpleandpreciselanguagewhencreatingasurvey statement.It’salsoimportanttothinkaboutbalanceandincludeasmanyhappinessfactorsas possiblewithoutoverwhelmingyoursurveytakers.Webelievethesewerevaluablelessonsto learnbecauseitgaveusexperiencewithconductingaresearchproject.Wewerealsoableto learnfirst-handhowresearchersapproachstudyingsomethingasbigashappiness,andnowwe haveamethodtogaugethehappinessofourcommunity,allowingustomakerecommendations forthefuture.
Recommendations
Ifweweretoconductthissurveyinthefuture,onerecommendationwouldbetomake thesurveyshorterandmorevisuallyappealingsopeopledon’tgetboredwhiletakingit.An additionalrecommendationwouldbetocreatemoreengagingquestionsontheWatershed Survey,aswellastoremovequestionsthatsomepeoplemightfeeluncomfortableorpressured toanswer,suchassexassignedatbirth.Inconclusion,resultsclearlysupportourhypothesis: PeoplewhoreporthigherhappinessonthenewWatershedScalealsoreporthigherhappinesson thevalidatedscale.Thismeansournewscaleisreadytouseforfutureresearch.Ifanypartofit ischanged,futureresearcherswillneedtovalidatethenewcreation.
References
Brooks,N.(2019).“Don’tworry?Thesadtruthabouthappinessscales.” Krannert: Purdue’s School of Management Magazine.
https://business.purdue.edu/konline/2019f/features/purce-bond.php.
Lyubomirsky,S.,&Lepper,H.S.(1999).“Ameasureofsubjectivehappiness:Preliminary reliabilityandconstructvalidation.” Social Indicators Research, 46(2),137–155.
https://doi.org/10.1023/A:1006824100041

TheRelationshipBetweenHappinessandDepression
LillaBauerandJadenO’Connor
Introduction
Mentalhealthisvitalinshapingwhoweareandourhappiness.Tofurtherinvestigatethe relationshipbetweenhappinessandmentalhealth,Part5ofthissurvey,theShortDepression Scale,wasincludedandcross-referencedwithindividualresponsesfromtheWatershed HappinessSurvey.Thissectionwillevaluatethestrengthoftherelationshipbetweendepression andhappiness,discusstheimplicationsofourfindings,andproviderecommendationsfor depressionvs.happinesswithintheWatershedcommunity.
SummaryofResults
ThesurveyresultsrevealedthatpeoplewhoscorehighonWatershedHappinessScale scorelowontheShortDepressionScale.ThesefindingssuggestthatWatershedhappinessmay influenceoveralldepressioninthefollowingway:wakinguptoknowthatyouareexcitedabout schoolandbeinghappyinschoolcanaffectyouroutsidelife.Additionally,itisworthnotingthat evenwithgoodquestions,peoplewillstillgothroughthesurveyandnotpayattention, indicatingeitheryoursurveyisdullorthequestionsaren'thittingwhatyou'retryingtogetat.
Methods
Ourstudy(H8)investigatedhowpeoplewhoarehappieratWatershedscorelowerlevels ofdepression.TheindependentvariableistheShortDepressionScale,andthedependent variableistheWatershedHappinessScale.Thesurveymethodusedoccasionally,calledreverse scoring,istoscorequestionssothata“one”representsthehighestvalueanda“seven”the lowest.Thisencouragescarefulresponsesbutcanleadtooutliersifparticipantsdon’treadthe questionsthoroughly.Toanalyzethedata,wecomparedresponsesmeasuringdepressionwith happinessscores.Ahigherscoreonthedepressionscaleindicatesagreaterlikelihoodof short-termdepressioninarespondent.Forinstance,thestatement“Iamnothappyinlife"would have1signify“thisdoesnotdescribemeatall,"and 7indicate“thisdescribesmeverywell.”

(Fig. 3a: Happiness vs. Depression)
Analysis
AsFigure3ashows,mostpeopleareabovethescaleof(10,60)showinghighhappiness andlowdepression.Fromwhatthegraphhasshown,ourhypothesisissupported:atWatershed, highhappinessisstronglycorrelatedwithlowdepression.Thelineofthebestfitshowsa significantnegativecorrelationbetweenhappinessanddepression:asdepressionincreases, happinesstendstodecrease.
Tofurtherunderstandthedata,it’svaluabletoanalyzespecificstatisticalvalues:
● R=correlationcoefficient.Rangesfrom-1to+1.Negativeoneisaperfect negativecorrelation,andpositiveoneisaperfectpositivecorrelation.
○ Forthisdataset,R=-0.687,meaningastrongnegativecorrelation.
● 95%Cl=confidenceinterval.95%certainthatRisbetween-.784/-.558
● Pvalue=howlikelytheseresultswouldhappenrandomly,bychance.The likelihoodofthishappeningrandomlyagainis<.001
Outliers&Insights
Outlierssuchasthepoints(2,70)canprovideuniqueinsights.Thisperson'sWatershed happinessscoreisbelowaverage,yettheyscoredlowonoveralldepression.Anotheroutlieris thedotat(16,90).ThisdotmeansthatevenwithahighWatershedHappinessscore,theystill haveahighoveralldepressionscore.
Inconclusion,thehighertheWatershedhappiness,thelowertheoveralldepression,with somesignificantoutliers.
Discussion
Theimplicationsofthisresearchsuggestthathavinglowerdepressioncouldoverall improvehappinessormoresignificantdepressionpushinglowerhappiness.Butishappinessthe absenceofdepression?Basedonthisdata,happinesscouldbeconsideredagood predictor of lowdepression.However,happinesscouldalsoberegardedascontentment,joy,or accomplishment.Buttherealityis,thereisnohonestanswer.AccordingtotheAmerican PsychologicalAssociation(Cohn,etal.,2009),thinkingpositivelycanenhancemoodand happiness.Additionally,theNationalLibraryOfMedicinesays:“Positiveemotionsarestrong predictorsofhappinessthatsometimesalleviatenegativethoughtsthatcanleadtodepression overtime.”
Ontheotherhand,otherrecentresearchsaysdifferently.Accordingto Psychology Today, “Somebelievethathappinessissimplytheabsenceofsadness,andsadnessistheabsenceof happiness.Recentresearchsuggeststhathappinessandsadnessareseparate,independent emotionsthatcancoexistinaperson'semotionalexperience”(Bennett,2023). Ourdata,boththe trendandoutliers,alsosupportsthistopic'scomplexity.
Whilesignificantquestionslike“Is happiness the absence of depression?”are interesting,thatwasn’tthepurposeofthishypothesis.ThepurposewastoseeiftheWatershed HappinessScalewasstatisticallyrelevant,andthescalewashighlystatisticallyrelevantinterms
ofthesurvey.Becauseofthenegativecorrelationbetweenthedatapoints,theWatershedScale wasahighlyeffectivewayofmeasuringindividualhappinessincontrasttodepression,even consideringoutliersthatmirrortherealhumanexperienceofafullrangeofemotions. Regardless,thisdatadoesshowthatitisclearthatmostoftheindividualsatWatershedSchool reporthigherhappinessandlowerdepression.
Recommendations
Ratesofdepressionamongteenshaverisendramaticallyinthelastfiveyears,withthe COVID-19pandemiccausingalargespike.AccordingtotheWorldHealthOrganization,there hasbeena25%increaseinanxietyanddepressionsincethepandemicinchildrenalone (Hirsh-Paskek,etal.,2024).Oursurveyresultsmainlydemonstratedepressioninyounger adolescentstomid/post-teens.TheShortDepressionScalecouldbeusefulforthesekindsof studies.Thisdatacouldbehelpfulinfuturestudiesinmeasuringdataondepression,happiness, andeveninthequestionreviewedearlierof“happiness being the absence of depression.” This datademonstratestheconnectionbetweentheWatershedcommunity,andeveniftherearesome outliers,itstillshowsthesameresults.Thatdatacouldbeusedforsomethingevenmore significantifneeded.
References
Bennett,K.(2023,03/10).“TheWorstWaytoThinkAboutHappinessandSadness.” https://www.psychologytoday.com/intl/blog/modern-minds/202303/the-worst-way-to-thin k-about-happiness-and-sadness#:~:text=Not%20Mutually%20Exclusive%20In%20anoth er%20study%2C%20researchers,can%20coexist%20within%20a%20person's%20emotio nal%20experience.
Cohn,M.A.,Fredrickson,B.L.,Brown,S.L.,Mikels,J.A.,&Conway,A.M.(2009).
Happinessunpacked:positiveemotionsincreaselifesatisfactionbybuildingresilience.
Emotionhttps://pmc.ncbi.nlm.nih.gov/articles/PMC3126102/.
Hirsh-Pasek,K.“Whyplayseriouswork”(2024,May2nd).BrookingsInstitution. https://www.brookings.edu/articles/why-play-is-serious-work/
Introduction
TheEffectsofNegativeStressonHappiness
RyderKunkelandJacksonGardner
Haveyouevermissedanassignmentorbeenlateforworkandfeltstressed?Thisdiffers frompositivestress,whichcanmakeyoufeelmotivatedtodosomethinglikehomework.This partwillcovertherelationshipbetweennegativestressandhappinesswiththedatafromthe survey;itwilldescribehowthesurveywasformedtocollectdataaswellasdiscussresultsand implications.Thehypothesisis“Peoplewhoexperiencemorenegativestressarelesshappy.” Thiswasimportantduetotheunknownrelationshipbetweennegativestressandhappiness affectingtheWatershedcommunityinaharmfulorunpleasantway.Thedatashowedhow negativestressaffectsourcommunity'shappinessandwhattodomovingforward.
SummaryofFindings
Thedatashowedthatthemorenegativestressthereis,thelesshappinesswasreported. However,someoutlierswereobserved,suchassomeonewhoreportedhighnegativestress,but alsothemosthappiness,whichmaysuggestinaccuratedata.Additionally,itisworthnotingthat sincewehadafewquestions,andthequestionscouldhavebeeninterpretedwithadifferent meaningthanweintended,thedatawillnotbeaccurate.
Methods
Thisstudyexploredtherelationshipbetweennegativestressandoverallhappiness.The hypothesiswasthatwithmorenegativestress,thelesshappysomeonewouldbe.Totestour hypothesis,wemeasurednegativestressusingtheLifeEventsScale(Part6),items1-11,andthe WatershedHappinessScale(Part1),items1-16.
Theindependentvariableinthisstudywasnegativestress,whilethedependentvariable washappiness.WemodifiedthedatarepresentationcreatedbyourresearchpartnersatCU Boulderbyaddinganestimatedlineofbestfittomoreclearlyillustratethecorrelationbetween negativestressandhappiness(fig. 3a).

Fig. 3a: The results with a line of best fit.
Weusedthecorrelationcoefficient(r-value)tomeasuretherelationshipbetweennegative stressandhappiness.WeusedtheP-valuetofindthedata'sprobabilityofcoincidence.The P-valuewas<0.001,whichmeansthattherewaslessthana0.1%chanceofthisdataoccurringat random.Thervaluewas0.398,whichmeansthatthevariableshaveamoderatecorrelation.The slopeofthelineofbestfitis-0.759,whichshowsamoderatenegativecorrelation,whichmeans thatthehigherthenegativestress,thelowerthehappiness.
Analysis
Whilenegativestressisnotstronglyaffectingourcommunity,ourresultsshowthat peoplearestillexperiencingstress.Peoplemightfeeloverwhelmedorbusy(duetonegative stress),whichcanimpacttheirabilitytoenjoybeingwithpeopleorenjoypositivemoments. RickHanson,forexample,arguesourbrainsarewiredtoleanintobadmemoriesandnegative experiences;itis,therefore,importanttotaketimetoenjoypositiveexperiencesmorebyusing stepscalledHEAL(Hanson,2014,p.110-115).
BadriBajajetal.(2022)furthersupportthesefindings;asnegativestressbecomesmore frequent,theamygdalatriggers,whichcancausefear,anxiety,andrage.So,ifwecanreduce harmfulstress,ourbrainswillbeinamorerelaxedstateandworkatahigherleveltoprocess information.Reducingnegativestresscanimprovethelivedexperienceofpeopleasindividuals andWatershedSchoolasawhole.
Discussion
Toboosthappinessmovingforward,weshouldhelpeachothertakethestressoffour shoulders.Humansaresocialanimals,meaninghelpingeachotherwillmakeushappyby releasingachemicalcalledoxytocin.Oxytocinhasbeenrevealedtoreduceanxietyandstress (TakayanagiandOnaka,2021).Butstressdoesn’tonlycomefromschool;itcancomefromyour familyorsociallife.Soifyouthinksomeoneisfeelingdown,trytohelpthem.Thiswillreduce stressfromhomework,sociallife,andfamily,creatingastress-freeenvironmentandastronger community.
Recommendations
Fromaneurologicalperspective,whenweexperiencenegativestress,ourbrainsrelease chemicalscalledcortisolandnorepinephrine,whichiswhystresscanfeelbad.Preventingthis couldincludeaddingastudyhallblockwherepeoplebehindcancatchuponstressfulwork;this couldalsoincludeaddingtimeforpeopletodosomethingthatcalmsthem,suchasasportor playingwithastressball,listeningtocalmingmusic,orsleepingandexercising.Overall,we foundthatstressandhappinessweredirectlycorrelatedandlowerstresscanleadtohigherlevels ofhappiness.Takingstepstoreducestresscouldleadtoahappiercommunity.
References
Bajaj,B.etal.“ResilienceandStressasMediatorsintheRelationshipofMindfulnessand Happiness.”(2022,February3). Frontiers in Psychology
https://pmc.ncbi.nlm.nih.gov/articles/PMC8850270/#:~:text=Chronic%20stressors%20m ay%20significantly%20affect,experience%20increased%20levels%20of%20happiness
Hanson,R.(2013). Hardwiring Happiness: The New Brain Science of Contentment, Calm, and Confidence. HarmonyBooks.
Takayanagi,Y.andOnaka,T.(2021,December23).“RolesofOxytocininStressResponses, Allostasis,andResilience”. Molecular Sciences.
https://pmc.ncbi.nlm.nih.gov/articles/PMC8745417/
TrustInOurCommunity
IsaHulserandCricketNatapow
Introduction
Whatifthekeytohappinessisn’twealthorachievementbutinthebondswebuildwith others?Trustisoftenoverlooked,butitmightplayabigroleinourhappiness.Insection6,we explorethecorrelationbetweenhappinessandtrustandhowthisplaysaroleinourcommunity Manypaststudieshaveshownthatpeoplewhohaveastrongerinterestintheircommunityand otherindividualsarehappierandmoresatisfiedwithlife(BrainWorld,2020).Webelievethat whenindividualsfeelabasicleveloftrustinothers,outsideoftheir immediatefriendsand family,theyarehappier(Radcliff,2022).Thissectionevaluatesthestrengthoftherelationships betweentrustandhappinessandconnectsthesociologicalandneurologicalaspectsoftrusting otherswithinthecontextoftheWatershedcommunity.
SummaryofFindings
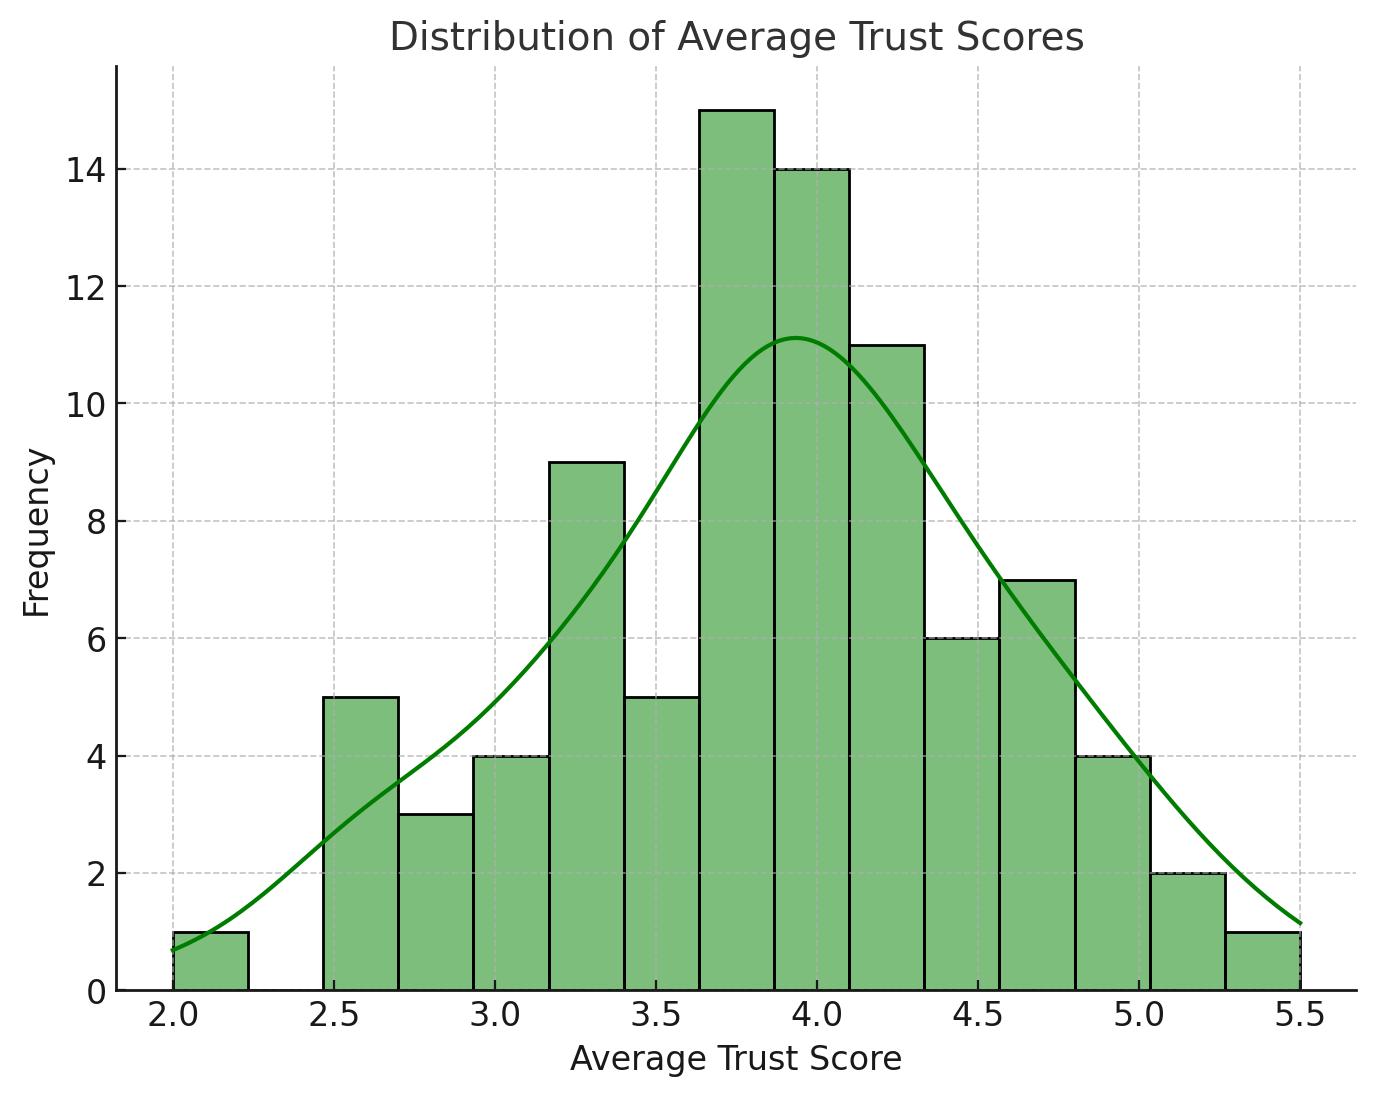
Thesurveyresultsshowedusthatmostpeopleinourcommunityhaveahighlevelof trustandthattrustcorrelateswithhigherlevelsofhappiness.Therearenopeoplewhohavea highhappinesslevelanddon’ttrustintheircommunity.Asrepresentedinthefiguresbelow (figs.4aand4b),thereisacorrelationbetweenthetrustscoresandtheoverallhappinessscores. Foreachscoredistribution,themajorityofscorefrequenciesoccurredbetweenthe70thand80th percentileofagivendataset,showingadditionalcorrelationandstatisticalsignificance (conversationwithLockeHassett,2024).Thisdatacorrelatesandisalsostatisticallysignificant becausethedistributionsarefairlypredictableandstandardforapopulation.


Methods
Inthisstudy,weexploredthecorrelationbetweentrustandhappiness.Thehypothesis wasthatahighersenseoftrustwouldfosterahappiercommunity.Wemeasuredthetrustlevels byusingstatementsone,three,five,andsevenontheSocialMeasure(Watershed)scaletotest ourhypothesis.CUresearchpartnersassessedtherawdataandwereabletoestimatethatinthe Watershedcommunity,thereisarelationshipbetweentrustandhappinesswithapositive correlationbetweentheamountoftrustandtheamountofhappiness.Theywereabletograph thisrelationshipusingthevariableofxastheamountofhappinessandybeingtheamountof trustinthecommunity.Wemodifiedthedatarepresentationcreatedbyourresearchpartnersat CUBoulderbyaddinganestimatedlineofbestfittoillustratethecorrelationbetweentrustand happiness(fig. 4c). Thelineofbestfitwasaddedtorepresenttheaverageofthedata.

Figure 4c: AI database used to calculate the line of best fit.
Analysis
Analyzingthedatashowsaclearrelationshipbetweentrustandhappiness.Trustplaysa crucialroleinyourhappinessanditcaninfluenceyourmoodandyourlifesatisfactionlevelif youtrustinyourcommunity.Thisrelationshipisevidentinoursurveyresults.Thegraphbelow (fig.4D)showsascatterplotillustratingtherelationshipbetweentrustlevelsinthecommunity andoverallhappinessscores.Eachpointonthegraphrepresentsanindividualparticipant's responsestothesurvey,withthex-axis(horizontal)indicatingtheleveloftrust(rangingfrom lowtohigh)andthey-axis(vertical)showingthecorrespondinghappinessscore.Asobserved, thereisagenerallyupwardtrend,suggestingapositivecorrelationbetweentrustandhappiness. Thismeansthatastrustlevelsincrease,happinessscorestendtorisecorrespondingly.
Therearesomeoutliersonthegraph,suchasafewindividualswithlowtrustbuthigh happiness,whichdon'tmatchthegeneraltrend.Thistellsusthatwhiletrustisafactorin influencinghappiness,theremaybeotherelementsorpersonalcharacteristicscontributingto thoseindividuals'happinesslevelsthatareindependentoftheirlowtrustinthecommunity Overall,thegraphprovidesacompellingvisualrepresentationofthefindingsandillustratesthe hypothesisthathighertrustlevelscorrelatewithgreaterhappinessinthecommunity.Weused theAIdataanalysistool(chatGPT4o)withguidance.Whilethereareoutliers,apossible explanationisthatthebulkoftheresponsesfallinthemiddleofthedataset,asexplainedby Figures4aand4binthesummary.

Discussion
Trustplaysacrucialroleinyourhappinessanditcaninfluenceyourmoodandyourlife satisfactionlevelifyoutrustinyourcommunity.Resultsindicatethattrustisimportantforour community.Itisabaselineforhappinessinarelationshipandacommunitybecauseitallows peopletofeelsafeandbethemselves.AccordingtoBenjaminRadcliff(2022),“Inahigh-trust environment,peoplegoabouttheirliveswiththeeasyassurancethatothersaroundthemare generallyhonestandevenbenevolent.Thesesortsofstronghumanconnectionshavebeen showntopromotehappiness.”
“Bycomparison,inalow-trustenvironment,”Radcliffcontinues,“peoplearesuspicious. Theyfeeltheymustalwaysbeonguard,incaseotherpeopleattempttodeceive,exploit,ortake advantageofthem.”Thisiswhyitwasabigsignastowhytrustandhappinesscorrelatefor mostofourWatershedcommunity.Peoplewhocantrusttheircommunitywithbeingthemselves, butalsowithkeepingsecretsorpersonalinformationthattheydonotwanttobeshared,havea highersenseofhappiness.Asthesayinggoes,“Ifweknoweachother'ssecrets,wewillfind comfort”(JohnChurtonCollins).Keepingasecretfeelsunnatural,sotohavethetrustina communitytonothavetohideanythingisasignificantpointinoverallhappiness.Additionally, accordingtoEqualityTrust,“Thereisasubstantialandrobustbodyofresearchsuggestingthat countrieswithhigherlevelsofinequalityhavelowerlevelsoftrust.Thislackoftrustis associatedwithavarietyofothersocialissuesincludinghappiness,homicides,andhealth.”
Recommendations
Basedonthefindings,wediscoveredthattrustandhappinessarehighlycorrelated.To fosteramorepositiveandhappyrelationshipbetweenfriendsorsomeoneyouwanttobein contactwith,trytobehonest,keeppromises,communicatewell,bereliable,helpothers,admit mistakes,andbuildtrust.Tofurtherenhancehappinessinourcommunity,weproposebeingkind becauseitensurespeopletrustwhoyouareandpeoplealsowillfeelsaferaroundyou(Freiand Morriss,2020).
AsFreiandMorriss(2020)argue,“Trusthasthreedrivers:authenticity,logic,and empathy.Whentrustislost,itcanalmostalwaysbetracedbacktoabreakdowninoneofthem” (fig.4e).Tocreatetrustinacommunityfirstthereneedstobekindnessandnojudgmentbecause judgmentandhurtingeachotherislikedominosandcontinuesuntilit'sstopped.Bychoosing
kindnessandstickingwithit,youcanreversethelineandtrustwillbebuilt;withtrustcomes happinessandifthewholeworldishappy,nobodywillbemean.AsthequotefromMahatma Gandhigoes,“Aneyeforaneyewillleavethewholeworldblind.”

References
BrainWorld.(December1,2020).“TheGivingBrain:ALookattheNerologyofAltruism.”
https://brainworldmagazine.com/giving-brain-look-neurology-altruism/
EqualityTrust(N.D.)“Trustparticipation,attitudes,andhappiness.”
https://equalitytrust.org.uk/trust-participation-attitudes-and-happiness/#:~:text=There%20 is%20a%20substantial%20and,including%20happiness%2C%20homicides%20and%20h ealth.
Frei,F.andMorriss,A.(May-June2020).“BeginwithTrust.” Harvard Business Review.
https://hbr.org/2020/05/begin-with-trust
Radcliff,B.(May11,2022).“Trustingsocietiesareoverallhappier-ahappinessexpert explainswhy.”
https://newhampshirebulletin.com/2022/05/12/trusting-societies-are-overall-happier-anda-happiness-expert-explains-why-commentary/#:~:text=In%20a%20high%2Dtrust%20en vironment,trust%20environment%2C%20people%20are%20suspicious.

HowActivitiesAffectHappiness
JulesStarnesandMartyBarlow
Intro
Activitiessuchasplayingasportordoingartarebeneficialtoyourmentalhealth. Part2ofthissurvey,ActivitiesMeasure,wasdesignedtoinvestigatetherelationshipbetweena varietyofactivities,suchasplay,altruism,spendingtimeinnature,andhappiness.Inthis section,weevaluatethestrengthoftherelationshipbetweenactivitiesandhappinessanddiscuss theimplicationsoftheresultsforourcommunity.Thisisquiteimportanttounderstand.
Methods
Thehypothesisforthissectionwasthat:Themoreactivitiesyouengagein,thehappier youare.Ourindependentvariablewasactivities(meaningsports,hobbies,orhangingoutwith friendsandfamily),measuredusingtheActivitiesMeasure(Part2)andthedependentvariable wassubjectivehappiness,measuredusingtheSubjectiveHappinessScale(Part4:SHS).We modifiedthedatarepresentationcreatedbyourresearchpartnersatCUBoulderbyaddingan estimatedlineofbestfittomoreclearlyillustratethecorrelationbetweentheActivitiesMeasure andtheSubjectiveHappinessScale(fig. 2).
Notes:Inthefuture,thisstudycouldbemodifiedtobetterunderstandtherelationship betweensports/physicalactivitiesandSubjective Happinessbydefiningactivitiesmore clearly
Analysis
Thedatafromthegraphshowsatrendbetweenpeoplewhodomoreactivitiesand greaterself-reportedhappiness.Fromthegraph,itseemsactivitiesaremorepopularthannot participatinginanyactivities.Interestingly,thedatarevealedthatactivitiesandoverallhappiness arequitepopularinourschool,whichcouldimplyastillactivecommunity.Givenwelivein Colorado,thisdoesnotcomeasasurprise.Withthis,discussionisnecessarytohelpus understandthisanalysis.

Discussion
Theseresultsindicatethatparticipationinactivitiesisimportantforourcommunity.It improvesmentalandphysicalhealth(Hirsch-Pasek,2024).Onepotentialexplanationforthis findingisthatbeingoutsidebenefitsapersonquitealot(Narvez,2013).Physicalactivityhas beenproventoreducedepressionandothermentalhealthcomplications(Mahindruetal.,2023).
Participatinginartactivitiesprovidessimilarbenefits(MayoClinic,2024).Additionally,the CDCrecommendsthatweget“atleast150minutesofmoderate-intensityphysicalactivityeach week.”Thisishighlyrecommended,amongotherthings.Thisisimportanttounderstand, especiallyforstrugglingstudents.Itcouldgivethemanoutletforsupportingthemselves.
Recommendations
Basedonourfindings,werecommenddoingmoreactivities,suchashobbieslike buildingLegos,playinganinstrumentorsports,orplayingonateam.Thissupportshappiness. Playingphysicalsportscanhelpreducestress,helpteamwork,andplayingsportscanalso increasementalhealth(Narvez,2014).Furthermore,participatinginactivitieslikeplayingan
instrumentcanhelpyourmood,confidence,coordination,andmuchmore(Matthews,2021).
Justlisteningtomusiccanhelpwithstress,mood,andcanevenhelpwithsleep(JohnsHopkins Medicine,n.d.).
Tosupportstudentsinparticipatinginmoreactivities,werecommendthatWatershed Schoolprovidesmoresupportforstudentstoparticipateinsportsandafterschoolactivities, whetherthatisplayingonadifferentschool’steamorWatershedmakingtheirownteam.
References
Hirsch-Pasek,K.etal.(2024,May29).Whyplayisseriouswork.Brookings. https://www.brookings.edu/articles/why-play-is-serious-work/#:~:text=However%2C%2 0literature%20states%20that%20play,is%20critical%20for%20adults%20too.
JohnsHopkinsMedicine.(n.d.)KeepYourBrainYoungwithMusic, https://www.hopkinsmedicine.org/health/wellness-and-prevention/keep-your-brain-young -with-music#:~:text=It%20provides%20a%20total%20brain,%2C%20mental%20alertnes s%2C%20and%20memory.
Mahindru,A.etal.(2023,Jan7).“RoleofPhysicalActivityonMentalHealthandWell-Being: AReview.” Cureus. doi:10.7759/cureus.33475.PMID:36756008;PMCID: PMC9902068.
Matthews,M.(2021).18BenefitsofPlayingaMusicalInstrument.
https://stamfordschools.org.uk/wp-content/uploads/2021/08/18-benefits-of-playing-a-mus ical-instrument.pdf.
MayoClinicPressEditors.(2023).“Theintersectionofartandhealth:Howartcanhelppromote well-being.” Mayo Clinic.
https://mcpress.mayoclinic.org/living-well/the-intersection-of-art-and-health-how-art-can -help-promote-well-being/
Narvez,D.(2013,April2).Playingatschool:Moreimportantthanwethought?.Psychology Today.
https://www.psychologytoday.com/us/blog/moral-landscapes/201404/playing-at-schoolmore-important-than-we-thought

Introduction
EffectsofSocializingonHappiness
ChetanTrudellandCollinRaney
Socializationplaysacriticalroleinfosteringhappinessandoverallwell-beingwithin communities.Thissectionaimstoexplorethehypothesisthatthemoreyousocialize,thehappier youbecome.Thisissignificantbecausewe’reinaschool,ahighlysocialsetting,andwefeltit wasimportanttoknowhowwellthestudents/stafffeelasenseofbelongingorhowhappythey areaspartofthiscommunity.Thissectionwillfurtherdiscussourmethods,provideananalysis ofourdata,anddiscusswhattheseresultsmean.Basedonthatdiscussion,wewillconcludewith recommendationsforourcommunity.
SummaryofFindings
Thesurveyresultsrevealedthatthemoresocialyouare,thehappieryouwillbeinmost cases.Therewere,however,someoutlierswhodidn’tconformtothistrend.AsshowninFigure 6,somepeoplewereveryhappybutnotassocialandsomepeopleweremoresocialandnotas happy.Despitetheseoutliers,ourresultsstillshowedastrongconnectionbetweensocialactivity andhappiness.
Methods
Wehypothesizedthatthemoreindividualssocialize,thehappiertheywillbe.Totestour hypothesis,weusedPart3:SocialMeasuresandPart1:WatershedHappinessSurvey.The independentvariableinthisstudywasSocialMeasures,whilethedependentvariablewasthe WatershedHappinessSurvey.TheSocialMeasuresectionofthesurveygaverespondentsa varietyofstatementsdesignedtomeasurehowconnectedtheyfeeltoothers.Somesample statementsinclude:
Part3
● “Icanrelyonmyfriendsforhelpwithsomething.”
● “Peopleincludemeinsocialeventsoractivities.”
TheWatershedHappinessSurveygaverespondentsavarietyofstatementsdesignedto measurefeelingsandbeliefs.Somesamplestatementsinclude:
Part1
● Ibelievethatmyfutureisbright.
● Idonothavemuchenergy.
Analysis
Whenexaminingthedata,wenoticedthatthegraph(Fig.6)showsthatthepeople reportinghigherparticipationinsocialactivitiesalsoreportedhigherlevelsofhappiness.More areindeedhappier.Butthereweresomeoutliers.Therewasoneoutlierwhowasnotsocializing butwasstillveryhappy.Sooverall,itdependsontheperson,butthegraphshowsthatformost people,themoresocialtheyare,thehappiertheyare.

Discussion
TheseresultsindicatethatmanypeopleintheWatershedcommunityarehappyandsocial overall.Thisisimportantforourcommunitybecauseitwillhelpusknowtowhatdegreepeople inourcommunityfeelasenseofbelongingandconnectionwithothers.Itshowsushowwe're doingasacommunityandhowwearecreatingagoodenvironmentinwhichpeoplefeel
Figure6
connected.However,theoutliersshowthattherearestillopportunitiestoimprove,aswillbe discussedinourrecommendations.
Whenpeopledon'tfeelhappyoraredepressedtheyarelesssocialandmoreisolated.A studyfromtheNationalLibraryofMedicine(2019)foundpatternsofsocialinteractionsthat peopleengageinthatarehappiness-enhancingandarebasedonclosesocialrelationships. AnotherfindingcomesfromHarvardMedicalSchool(Godman,2023).Thisstudylookedatthe differencesindailysocialexperienceswithstrangers,friends,orfamilymembersthatsurvey respondentsdon'tseeeveryday.Theresearchersfoundthat“themorediverseyour‘portfolio’of socialinteractions,thehappieryou’llbe.”Overall,oursurveyresultsshowedthatindividuals whoaremoresociallyengagedaremorelikelytobehappy.
Recommendations
Basedonourfindings,werecommendsocializingtosupporthappiness.Ourfindingsare inlinewithapreponderanceofresearch,whichsuggeststhatsocializingmorewillmakeyou happier(Schrader,2019).Strategiesforimprovementcouldincludejoiningaclub,asthisaligns withhappiness.Inconclusion,ourresearchshowsaclearconnectionbetweensocializingand happinessandsupportsimprovingexistingconditionsforsocializingtofostergreathappinessin theWatershedcommunity.Wethinkmovingforwardwecouldhaveacalendarwithallthe eventslistedsoifyoueverfeellonelyyoucouldgotoaneventandenjoyotherpeople's company.Anotherquestionthatcouldbeconsideredinthefutureis:
● Wouldyoulikemoreeventswhereyougotoadifferentschoolandgettoknowmore people?
References
Godman,H.(2023,April1).Canvariedsocialinteractionsboostwell-being?HarvardHealth. https://www.health.harvard.edu/staying-healthy/can-varied-social-interactions-boost-well -being
NationalLibraryofMedicine-NationalInstitutesofHealth.(2019).Nih.gov;U.S.National LibraryofMedicine.https://www.nlm.nih.gov.
Schrader,J.(2019,December31).“DoesBeingMoreSocialMakeUsHappier?” Psychology Today
https://www.psychologytoday.com/us/blog/the-mindful-self-express/201912/does-beingmore-social-make-us-happier?msockid=09bd7b95b54a65653dda6f4db4b26445.

WhatAgesaretheHappiest?
EvynneOndatjeandEliRose
Introduction
Haveyoueverwonderedaboutwhatagesarethehappiest?Forthissectionofthereport, wecross-referencedageandhappinesstoseeiftherewasacorrelationbetweenthetwo, attemptingtofindwhichageswithinWatershedSchoolwerethehappiest.Wehypothesizedthat studentsaged11or12wouldhavethehighestscoresonthehappinessscale.Webelievedthe16, 17,and18-year-oldswouldalsohavehighhappinessscores.Finally,wethought13,14,and 15-year-oldswouldbetheleasthappygroup.Wehypothesizedthisbecauseatthisagestudents' mindsandbodiesaregoingthroughsignificantchangeswithhormonesaffectingtheirmood, causingthemtobelesshappyandmoodier(PfeiferandAllen,2020).
SummaryofFindings
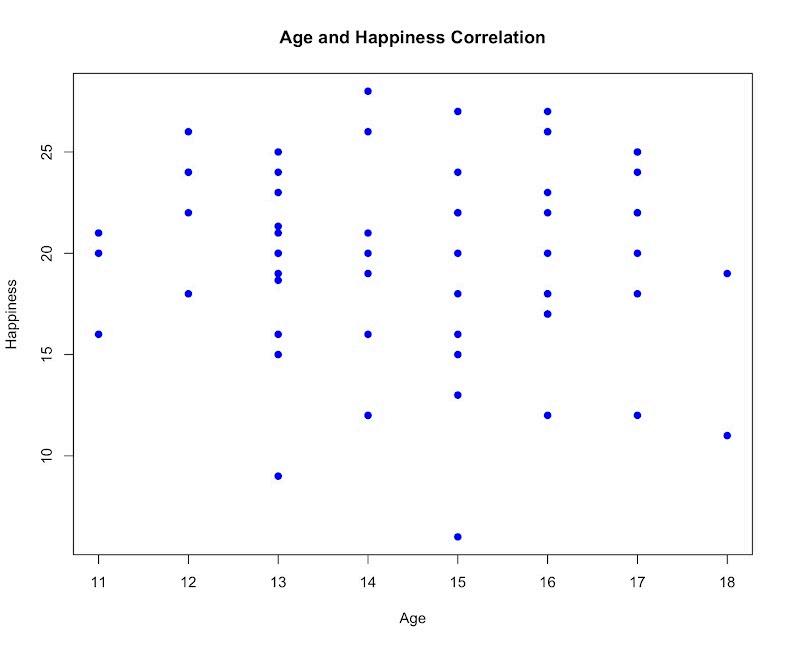
Wehavefoundthattheresultsdidnotshowasignificantdifferencebetweenthetwoage groups.The11,12,16,17,and18-year-oldparticipantsscoredslightlyhigherinhappinessthan the13,14,and15-year-oldparticipants.Thescatterplotillustratedvarioushappinessreports fromeachagecategory.WehadaP-valueof.627,whichmeanstheresultshavea62.7percent chanceofhappeningagain.Tosummarize,theseresultsrepresentedtheinsignificanceoftherole thatageplaysinWatershedcommunityhappiness.
Methods
WemeasuredhappinessusingtheSubjectiveHappinessScale,avalidatedscalecreated bySonjaLyobomiskyandHeidiLepperin1999tomeasureaperson'shappiness.Avalidated scalemeansthatthescalehasbeenproventocorrelatewithitsgiventopicandcanbereliably usedtomeasureit.
WefoundwecouldobserveourdatabylookingatascatterplotwiththeYaxisbeinga person'shappinessscorefrom0-25andontheXaxistheperson'sagefrom11-18.Eachpointon
thegraphrepresentsanindividual'shappinessscoreandage.ResearchersfromCUBouldertook thedatafromeachparticipant'sscoreandplacedthedataonagraph(fig.7a).

Analysis
Wefoundverylittlecorrelationbetweenourtwomeasures:ageandtheSubjective HappinessScale.Wesawpracticallynopositiveornegativecorrelation.Thiscouldmeanthat ourhypothesiswasincorrectandthatpubertydoesnotaffecthappinessatourschool.Thiscould alsomeanthatoursurveyisflawedorthatoursmallpopulationatWatershedunderminesour abilitytofinddifferences.Perhapsifwehadmorerespondents,wewouldhavemorepowerto detectadifference.Maybeourresultwouldhavebeendifferentataseparateschool.
Theaveragehappinessscoreofthenon-hormonalgrades(6/7/11/12)was20.5.The averagehappinessscoreofthehormonalgrades(8/9/10)was19.9.Thisshowsthatthereisa fractionaldifferencebetweenthesetwodemographics,provingaweakrelationship.Another measurementgiventousbyourpartnersatCUBoulderiscalledaP-value.AP-valuerepresents
thechancethatourresultcouldhavebeenachievedrandomlyanddoesnotproveanything. P-valueismeasuredonascaleof0-1.OurPvaluewas0.627,meaningthattherewasa62% chancethatthesefindingswerecompletelyrandom.

Discussion
Tosummarizethedata,wefoundthattherewasn'taseriousincreaseinaperson's happinessdependingontheirage.Weweresurprisedbytheresultsbecausewebelievedthat8th, 9th,and10thgradershadabiggerworkloadandhigherlevelsofstressversus6th,7th,11th,and 12thgraders,whowebelievedhadaneasierworkloadandlessstress.Now,werealizethatthere couldbemanyreasonsforthesimilarhappinessscoresbetweenages.Forexample,webelieved that11and12-year-oldswouldbehappierthantherestoftheschoolbecauseoftheirlower workload,butotherstressorscouldbecontributing.Beginningmiddleschool,especiallyata schoolwithseniorsand18-year-oldsinthesamebuilding,couldbeverystressfulforincoming
sixthandseventhgraders.Additionally,webelievedthat13,14,and15-year-oldswouldbeless happybecauseofchangesintheirbodiesandminds,butalsotheycouldbehappierbecauseat theseages,studentsareexperiencingmorefreedominsideandoutsideofschool,allowingthem tobehappier.Wepredictedthat16,17,and18-year-oldswouldbehappier,butonsecond thought,theycouldalsobelesshappybecauseoftheextremestressofcollegeapplicationsand worryingaboutfuturelifeafterschool.
Recommendations
Forfuturesurveys,wewouldtesthappinessbasedonaperson'sgender.Wethinkthis wouldprovidebetterdatabecauseweliveinasocietywherepeoplehavedifferentexpectations andstereotypesbasedonperceivedgender.Forexample,youngfemalesareexpectedtobehave inspecificwaysandthatcouldimpacthappinessinaperson.DavidBlanchflower(2023)studied thehappinessgapbetweenmenandwomen.Hefoundthatin167countries,womenhadlower mentalhealthscoresthanmen.
Alternatively,wecouldtakethedatapointswiththesamesurveybutatdifferentpointsin theyear.WecouldseeWatershedstudents'happinessthroughouttheyear.Wewouldtake differentmeasurementsatdifferenttimesoftheyearandmakeconclusionsfromthere.Wecould alsomeasurehowWatershedhappinesscomparestopublicschoolhappiness.Watershedcould partnerwithanotherBoulderCountyschooltotakedataonthedifferenceinhappinesslevels betweenschools.Thiswouldgiveusawidervarietyofresultsandallowustomakebetter conclusionsbasedontheresults.
References
Blanchflower,D.(2023). The Gender Wellbeing Gap | CEPR.Thegenderwellbeinggap. https://cepr.org/voxeu/columns/gender-wellbeing-gap
Pfeifer,J.H.,&Allen,N.B.(2020).Pubertyinitiatescascadingrelationshipsbetween neurodevelopmental,social,andinternalizingprocessesacrossadolescence. Biological Psychiatry, 89(2),99.https://doi.org/10.1016/j.biopsych.2020.09.002.
HappinessinStudentsvs.Staff
TreaMcDonaldandGrayJospe
Introduction
Whenyouthinkofaschool,whodoyouthinkisamorehappypopulation:thestudents, ortheadults?Thispartofthereportwilllookintothatquestion.Wehypothesizedthatstaffwere lesshappythanstudents.Thissectionevaluatesthestrengthoftherelationshipbetweenageand happiness,discussesitsimplications,andprovidesrecommendationsforcultivatinggreater happinessinstudentswithintheWatershedcommunity.Althoughthewhole8th-gradegroup generatedthishypothesis,theauthorsofthissectionpredictedthatitwouldbefalse,anditwas. Thishypothesisisanimportantonetoaskbecause,intheUnitedStates,thereisageneral perceptionthatteachersaremuchlesshappywiththeirworklives(Toropovaetal.,2020).We wantedtofindouthowthatrelatestoourschoolandseeifitdiffers.
Summary
Overall,staffrespondentsscoredhigherontheWatershedHappinessSurvey. Additionally,itisworthnotingthattheaveragestudent’sscoreandtheaverageadult’sscoreare notmuchdifferent,buttherangeforthestudentsismuchlowerthantheadults.Thismaybea resultofhavingmorestudentthanadultresponses.
Methods
Thissectionexploreshowhappinessvariesbetweentwoagegroupsofthestudied population:studentsandadults.ThedatawasgatheredusingtheWatershedHappinessScale developedbyWatershedSchool8th-gradestudentsandCUBoulderresearchpartners.
SurveyDesignandContent
1. TheWatershedHappinessScaleconsistsof16questionstomeasurehappinessratesand includesstatementssuchas:
● “My thoughts are negative.”(ReverseScored)
● “I like who I am.”
● Thequestionsweremeasuredfrom1(stronglydisagree)to10(stronglyagree).
● Numericvaluesonthescalewerenotvisibletorespondents.
Thequestionswentthroughareviewprocessforlanguagesimplicityandtoremovebias. Thoughtandcarewereputintomakingsomequestionsreverse-codedsotherespondenthasto readtheentirequestion.Reverse-codedquestionsalsohelpresearchersidentify“click-through” responses.
2. Age
● Agewasself-reportedattheendofthesurvey
● Twoagegroupswereidentified:
○ Students:ages11-19
○ Staff/Adults:ages20+
Variables
● Theindependentvariablewasage.
● Thedependentvariablewashappiness.
Analysis
Examiningthedatarevealsthatstudentsaremoreunhappythanthestaff(age20+).
Figure8showsthatthemean(theaveragevalueofasetofnumbers)happinessscoreofstudents was75.768andthenthemeanofstaffwas82.601.Thisconcludesthattheteachersare,on average,happier.TheP-valueindicatesthelikelihoodoftheresultsrandomlyoccurring.Inthis study,theP-valuewas.038,confirmingtherelationshipwassignificantwithaverylow
likelihoodofoccurringrandomly.

Fig. 8: Comparison of Happiness in Students and Teachers.
Discussion
Onepotentialexplanationforthisfindingisthatthestudentsaregoingthroughchanges andtheirbrainsaredevelopingandevolving,creatinghigherlevelsofanxiety.Ontheother hand,staffhavemorefreedomandhavemoreexperienceduetotheirage.Thismightreduce theiranxietyandleadtogreaterfeelingsoftrust,safety,andconnection—importantfor psychologicalhappiness.Also,thenumberofstudentresponseswas61,while15adultsreported theirage.25peopledidnotreporttheirages.Thereasonforthisispotentiallyduetothelong lengthofthesurvey.AsJamieDucharme(2023)reports,avarietyofstudiesshowattention
spansareshrinkingandfocusingisgettingmoredifficult.Overall,thisinformationisimportant toimprovethecommunityandprovideinsights.
Recommendations
Basedononlythesefindings,theremaynotbeaconcreteactionthatcanbetakentoraise thehappinessofthestudents.Werecommendthatmoreresearchonthetopicisgatheredbefore makinganysortofclaimtofixit.Wealsorecommenddoingaqualitativestudy,whereweask adultswhatmakesthemhappy,andstudentswhatcouldmakethemhappier.Additionally,there isanabundanceofresearchthatsuggestspeopleoverallgethappierastheygetolder,andthat happinessdropsduringteenageyears,risesinthe20s,dipsagaininthe30s,andthensteadily increasesafter40(Onque,2024).
References
DucharmeJ.(2023,August10).WhyEveryone’sWorriedAboutTheirAttentionSpan—And HowtoImproveYours. Time
https://time.com/6302294/why-you-cant-focus-anymore-and-what-to-do-about-it/
Toropova,A.etal.(2020).“Teacherjobsatisfaction:theimportanceofschoolworking conditionsandteachercharacteristics.” Educational Review
https://www.tandfonline.com/doi/full/10.1080/00131911.2019.1705247
Onque,Renee.(2024,July23).“Youngpeopletodayarestressed,depressed—andchangingthe fundamentalpatternofhappiness,newresearchshows.” CNBC.
https://www.cnbc.com/2024/07/23/new-research-young-people-are-reshaping-the-happin ess-curve.html.
AppendixA WatershedHappinessSurvey
Part 1: Happiness Survey (Watershed)
(1) I am unsatisfied with my life.
(2) I like who I am
(3) My thoughts are negative.
(4) I am motivated in daily life.
(5) I feel connected to people who care about me.
(6) I am appreciated for who I am.
(7) I lack confidence in myself
(8) I enjoy life even when hardship happens.
(9) I am happy most of the time.
(10) I feel safe
(11) I believe my future is bright
(12) My attention is on what is happening at the moment
(13) I see the world as full of opportunities.
(14) I do not have much energy.
(15) I am active
(16) When life hassles happen, they roll off me.
Part 2: Activities Measure (Watershed)
(1) Spend time in nature or outdoors.
(2) Play sports or games or spend time doing a hobby.
(3) Engage in physical activities or exercise.
(4) Support or help someone or volunteer for the community.
(5) Spend time with family or friends.
Part 3: Social Measure (Watershed)
(1) I feel a sense of trust at Watershed.
(2) I can rely on my friends for help
(3) My mentors and/or teachers at Watershed support me.
(4) I am comfortable being myself with friends.
(5) People at Watershed know me well
(6) People include me in social events or activities
(7) I feel a sense of belonging at Watershed.
Part 4: Subjective Happiness Scale (validated)
(1) In general, I consider myself a very happy person.
(2) Compared to most of my peers, I consider myself more happy.
(3) Some people are generally very happy. They enjoy life regardless of what is going on, getting the most out of everything. To what extent does this characterization describe you?
(4) Some people are generally not very happy. Although they are not depressed, they never seem as happy as they might be.
To what extent does this characterization describe you?
Part 5: Short Depression Scale (validated)
(1) I was bothered by things that usually don't bother me.
(2) I had trouble keeping my mind on what I was doing (3) I felt depressed.
(4) I felt that everything I did was an effort.
(5) I felt hopeful about the future.
(6) I felt fearful.
(7) My sleep was restless (8) I was happy
(9) I was lonely.
(10) I could not 'get going.'
Part 6: Life Events Scale (validated)
(1) Did poorly on or failed an exam, major paper, or project in an important class.
● How stressful or emotionally intense was the above event for you, at the most stressful or intense, in the past year? (asked for every question in this scale, if participant said 1+ events)
(2) Failed to achieve an important school-related goal that does not involve grades (for example, did not get into an orchestra or athletic team; did not get the lead part in play).
(3) Significant negative change in financial situation for self or family
(4) Significant fight or argument with someone.
(5) Pressure from someone to do what they wanted you to do, to agree with them, or to achieve things you weren't capable of or weren't interested in
(6) Someone invading your privacy or being too nosy or infringing on your freedom
(7) Put down or made fun of by someone.
(8) Betrayed or emotionally hurt by someone.
(9) Not accepted into a desired social group or excluded from an important social event (10) Dated less often than would have liked or wanted a boyfriend/girlfriend/romantic partner but did not have one.
(11) Were teased, criticized, or put down for appearance or others pressured you to change your appearance in a major way
(12) Received an excellent grade on an exam or major project in an important class.
(13) Achieved an important school-related goal that does not involve grade point average (for example, got into an orchestra or athletic team; got lead part in a play)
(14) Significant positive change in financial situation for self or family
(15) Accepted into a desired social group or included in an important social event.
(16) Met a new friend, and started a new friendship.
(17) Attended or hosted a social event with new people
(18) Went on a first date or started a new romantic relationship.
(19) Finished an important project, task, or venture that is related to school, work, hobby, etc.
(20) Started a new project or hobby.
(21) Succeeded in meeting an important deadline
(22) Took on a new challenge or opportunity of some kind (for example, taking a difficult class at school; or entering a competition).
Demographic Questions
What is your age?
What was your sex assigned at birth?
Gender/ Gender Identity
AppendixB
SubjectiveHappinessScale


