Appendix 5 | Addendum Amsterdam Neuroscience co-author analyses These analyses, made by the CWTS in Leiden, show the internal cooperation within the Amsterdam Neuroscience research institute and map out the connections between the research programs of the institute. Three analyses were made: a network analysis to map out cooperation, a network of Principal Investigators from the nine different research programs and a keyword analysis to visualize the research focus.
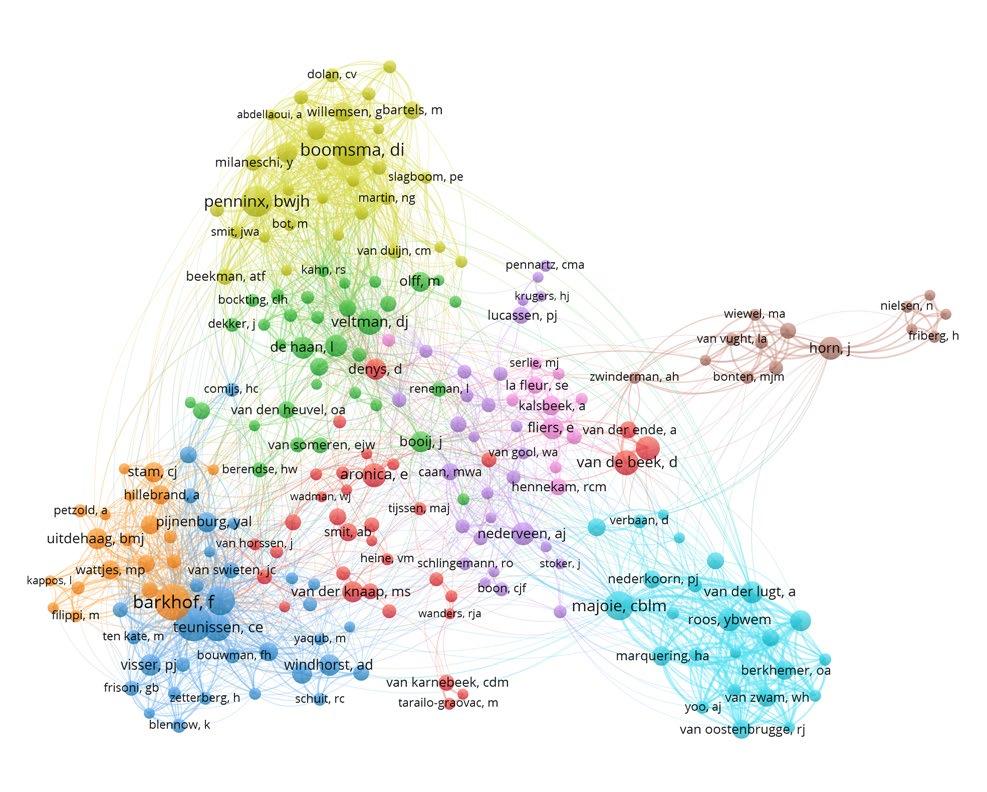
Explanation and background of the network analyses Based on the metadata of publications from sources such as Web of Science, Scopus or Pubmed, networks can be visualized on the basis of co-author relationships. For these analyses, the publication set of Amsterdam Neuroscience over the years 2016-2021 was used. For this purpose, the institute has provided an overview of publications with corresponding digital object identifiers (doi’s). Due to a reorganization of the research programs in 2019, which lead to the disappearance of two programs and the creation of two new ones, two different datasets were provided, one corresponding to publications from 2016-2018 and a second one corresponding to 2019-2021. Network analyses were performed separately for both periods. A CWTS enhanced version of the Web of Science core collection has been used in this project. This bibliographic data source provides a clear view of the international scholarly communication, though it does not capture all scholarly output.
Appendix 5
In the visualizations, the sphere size is a measure of the number of publications of an author compared to other authors. The lines between the spheres reflect co-author relationships within the analysis period. The colors reflect groups of authors who often publish together and are a proxy for research groups.
An interactive presentation of these networks can be found online in the URLs located below the figures, which link to the VOSviewer software. The left side panel of VOSviewer allows for different possibilities in visualizing the data, such as adjusting the sphere size, the amounts of links between spheres or the colors of the clusters.
To correct for author name variants, a thesaurus was constructed. Next, a number of choices have to be made in the visualization of the network, such as the threshold for the number of publications per author to appear in the network and whether or not to include publications with large author lists in the network. The visualizations have limitations. For example, not all spheres in the network can be displayed by name. This means that in the network visualizations sometimes names that might have been expected are not shown. In the various visualizations over time, an attempt was made to show as many different researchers as possible.
79