Appendix 3 |
Research input (personnel)
About the metrics To collect the metrics of our research institute we followed the Strategy Evaluation Protocol of the Universities of the Netherlands (UNL, former VSNU), the Netherlands Organization for Scientific Research (NWO), and the Royal Netherlands Academy of Arts and Sciences (KNAW). As for funding categorization for the university medical centers, we used the Netherlands Federation of University Medical Centers (NFU) criteria. In the ratio-conversion from personnel to the full-time-equivalent (FTE) spent on research the default guidelines (HRM-SAP instructed) can be applied: full professor: 0.1-0.2 FTE; strategic professor: 0.1-0.2 FTE; associate professor: 0.2-0.4 FTE; assistant professor: 0.4; investigator: 0.6-0.8 FTE; postdoc: 0.85 FTE; PhD candidate: 0.75 FTE. Amsterdam Neuroscience – Research institute (unique personnel counts) The collective ‘community’ of the Amsterdam Neuroscience research institute over the years ranged from 784-1025 investigators. This included over 150 Principal Investigators, around 100 faculty members & residents, more than 200 postdocs and research associates, and between 376-479 PhD candidates per year.
Appendix 3
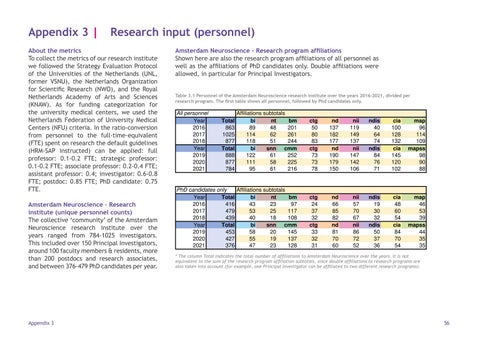
Amsterdam Neuroscience – Research program affiliations Shown here are also the research program affiliations of all personnel as well as the affiliations of PhD candidates only. Double affiliations were allowed, in particular for Principal Investigators. Table 3.1 Personnel of the Amsterdam Neuroscience research institute over the years 2016-2021, divided per research program. The first table shows all personnel, followed by Phd candidates only.
Affiliations subtotals bi nt bm 89 48 201 114 62 261 118 51 244 bi snn cmm 122 61 252 111 58 225 95 61 216
ctg 50 80 83 ctg 73 73 78
nd 137 182 177 nd 190 179 150
nii 119 149 137 nii 147 142 106
ndis 40 64 74 ndis 84 76 71
cia 100 128 132 cia 145 120 102
map 96 114 109 mapss 98 90 88
PhD candidates only Affiliations subtotals Year Total bi nt bm 2016 416 43 23 97 2017 479 53 25 117 2018 439 40 18 108 Year Total bi snn cmm 2019 453 58 20 145 2020 427 55 19 137 2021 376 47 23 128
ctg 24 37 32 ctg 33 32 31
nd 66 85 82 nd 81 70 60
nii 57 70 67 nii 86 72 52
ndis 19 30 32 ndis 50 37 36
cia 48 60 54 cia 84 70 54
map 46 53 39 mapss 44 35 35
All personnel Year 2016 2017 2018 Year 2019 2020 2021
Total 863 1025 877 Total 888 877 784
* The column Total indicates the total number of affiliations to Amsterdam Neuroscience over the years. It is not equivalent to the sum of the research program affiliation subtotals, since double affiliations to research programs are also taken into account (for example, one Principal Investigator can be affiliated to two different research programs).
56