


November 2022
Prepared By:

“
You cannot get through a single day without having an impact on the world around you. What you do makes a difference, and you have to decide what kind of differenceyouwanttomake.
—JaneGoodall
Abbreviations
Executive Summary
Section 01 Introduction
Section 02 Transportation and Mobility
Section 03 Land Use and Housing
Section 04 Buildings and Energy
Section 05 Waste Management
Section 06 Water and Wastewater
Section 07 Local Food and Agriculture
Section 08 Green Space and Trees
Section 09 Health and Safety
Section 10 Economy
Section 11 Implementation
Appendix A Funding Sustainability Initiatives Memo
Appendix B Supporting Research Documents
Appendix C Skokie Climate Infographics
Appendix D Potential Cost Savings Assumptions
Appendix E Glossary of Terms
Appendix F References
Appendix G Acknowledgements
ACU Accessory Commercial Unit
ACU Accessory Dwelling Unit
BAU Business as usual
BEV Battery electric vehicle
BIPOC Black, Indigenous, People of Color
C&D Construction and demolition
CAP Climate Action Plan
CE Carbon Equivalent
CDP Carbon Disclosure Project
CFC Chlorofluorocarbons
CH4 Methane
CHP Combined Heat and Power
CO2 Carbon dioxide
CO2e Carbon dioxide equivalent
CSG Community Solar Garden
DOE U.S. Department of Energy
EMS Emergency medical services
EPA U.S. Environmental Protection Agency
EV Electric vehicle
EVSE Electric vehicle supply equipment
FEMA Federal Emergency Management Agency
FTE Full-time equivalent
GCoM Global Covenant of Mayors
GDP Gross Domestic Product
GHG Greenhouse gas
GWP Global warming potential
HFC Hydrofluorocarbons
ICE Internal combustion engine car
IPCC Intergovernmental Panel on Climate Change
kWh Kilowatt-hour
LEV Low emission vehicle
See
MWH Megawatt hour – 1,000 Kilowatt-hours
MSW Municipal Solid Waste
MT Metric ton equivalent to 1,000 kg (also known as Metric Tonne)
MMT Million Metric tons
MTCO2e Metric tons of carbon dioxide equivalent
N2O Nitrous Oxide
NOx Nitrogen Oxides
NZE Net-Zero Emissions
O3 Ozone
ODS Ozone Depleting Substances
PACE Property Assessed Clean Energy
PFC Perfluorocarbons
PHEV Plug-in hybrid electric vehicle
PM2.5 Particulate matter of 2.5 micrometer diameter or less
POC People of Color
PPA Power Purchase Agreement
PUB Public Utilities Board
REC Renewable Energy Credit
SEAC Sustainable Environmental Advisory Commission
SO2 Sulfur Dioxide
SF6 Sulfur Hexafluoride
STAT Skokie Telecommunications and Technology Commission
SULEV Super ultra-low emission vehicle
t Ton equivalent to 2,000 lbs (United States)
TOG Total Organic Gasses
USGS U.S. Geological Survey
VMT Vehicle miles traveled
VHT Vehicle hours traveled
ZEV Zero emission vehicle
The work that went into developing the 2022 Skokie Environmental Sustainability Plan:
8 months planning timeframe
900 community members providing input
33 planning team members
5 foundational research study documents
2 online community input survey efforts
The Village of Skokie developed the 20162021 Environmental Sustainability Plan to guide municipal and community action to advance sustainability. In April 2022, the Village engaged paleBLUEdot for the development of an updated Environmental Sustainability Plan to build on the success of the earlier plan and establish environmental sustainability and climate resilience strategies and actions through 2030.
This document is the result and was developed in collaboration with the Village’s Environmental Sustainability Planning Team.
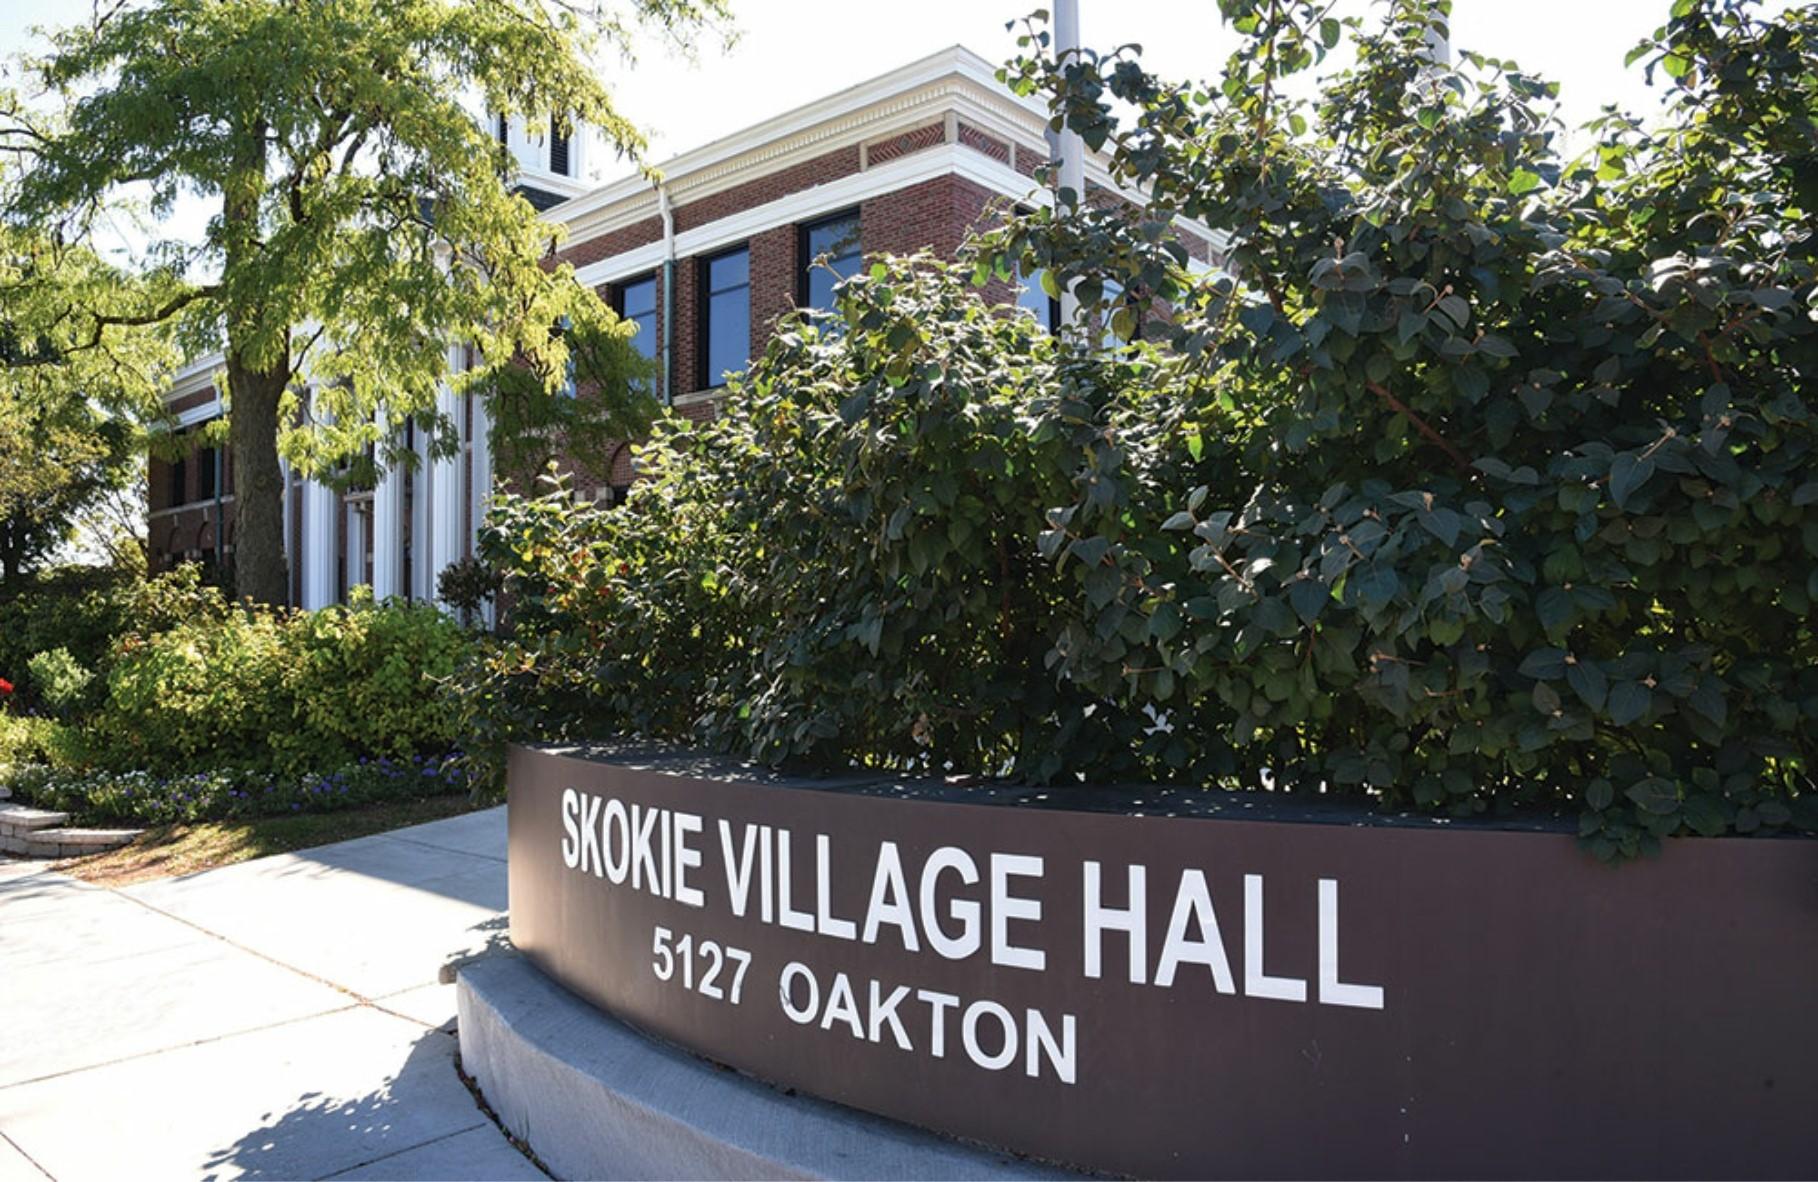
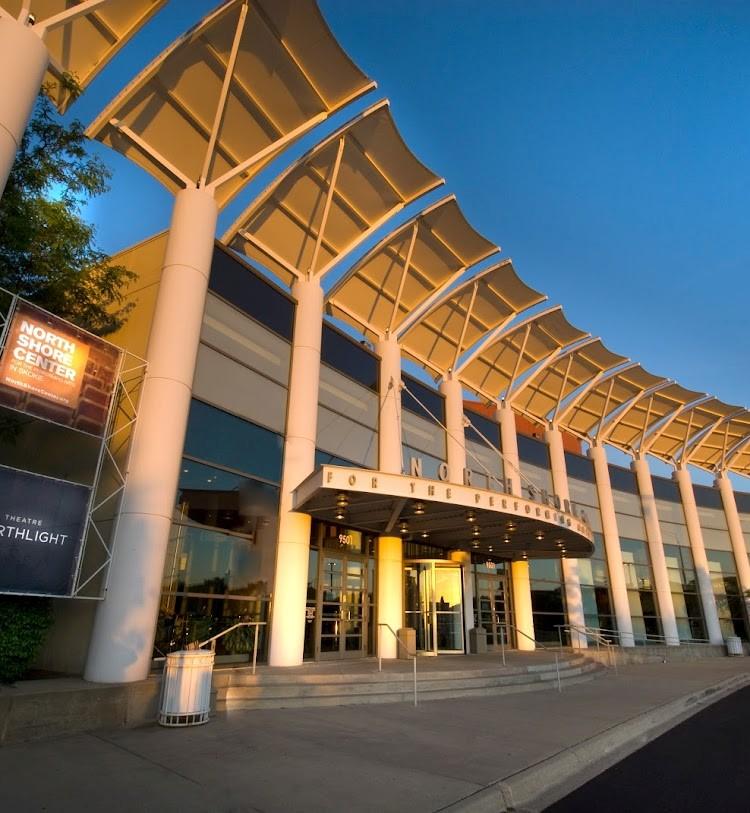
The Village of Skokie has a diverse population of nearly 68,000 residents. It is an urban community of just over ten square miles in area situated approximately 15 miles north of downtown Chicago and much of the community is an extension of the Chicago street grid system.
The Village has a tradition of being a leader in addressing sustainability and environmental issues. For almost four decades, Skokie has made significant strides towards improved community sustainability. Over that timeframe, the Village has taken a number of steps to create a more sustainable community including: achieving a Clean Air Counts Gold Level community certification, construction of a new CTA train station furthering use of mass transit, construction of a LEED certified Village’ s Police Station, and thirty seven consecutive years of Tree City USA designation.
In 2016, Skokie developed its first Environmental Sustainability Plan whose implementation was designed to extend through 2021. This plan builds on the success of the first plan and establishes environmental sustainability and climate resilience strategies and actions to guide community-wide and municipal operations sustainability improvements through 2030
The complex systems that make up modern civilization result in stressors on the delicate balance of our ecosystems. The combustion of fossil fuels is warming earth’s atmosphere and changing our climate. Climate change is already affecting Skokie and all of Cook County. The impacts of Climate Change are projected to become much more severe in the coming decades2. These impacts also contribute to additional strain on vulnerable populations, social systems, and overall community resilience.3
By 2050, Skokie and all of Cook County’s climate can be expected to be:


+4-5°F Warmer
average annual temperature than today.
+15-20 more days
with high temperatures over 95°F annually.
+69% more demand
for air conditioning and energy needed.


+15% higher average
annual rainfall than now.
+30% more heavy
precipitation events annually.
+20 days longer
growing, allergy, and mosquito season.
The impacts communities have on our environment represent a major sustainable development opportunity while transformation of our energy system is essential in order to stop burning fossil fuels—a necessity to address climate change impacts. These transitions present an opportunity for Skokie. Directing our energy investments into renewable sources will make them more resilient and provide for local job creation. 4,5 Innovation, technology, and collective social change inherent in environmental sustainability can also support greater community abundance and shared equity.
This plan seeks to re-affirm the Village’ s commitment to the Metropolitan Mayors Caucus’ Greenest Region Compact and support the State of Illinois’ emissions reductions goals. To do so, the plan must align itself within the IPCC-suggested greenhouse gas (GHG) reduction goals associated with the Paris Agreement of 26%28% reduction by 2025 and 80% or greater reductions by 2050. These global recommendations and state and national commitments were accounted for in the formulation of appropriate carbon reduction goals for Skokie:

To reduce community-wide GHG emissions by 35% below 2020 levels by 2030, and achieve carbon neutrality by 2050.
*Goal is equal to or greater than the goal established in the Mayors Caucus Climate Action Plan; however, this plan uses 2020 as the baseline year due to prior year data unavailability for the Village of Skokie. Goal excludes “ scope 3” emissions.


This Environmental Sustainability Plan is intended as a “living plan” rather than a static document. This means that the implementation phase of this plan should be characterized by intermittent measurement of progress and plan adjustments. As a “living plan,” the 2030 goals should be seen as a guiding constant and recognition should be given that initial implementation actions may
This Skokie Environmental Sustainability Plan is only the beginning of an ongoing process to evaluate and advance the community’ s resilience, GHG emissions, and overall sustainability goals. The plan includes an Implementation section providing a framework for launching, guiding, monitoring, and evaluating the execution of this plan. The
The Skokie Environmental Sustainability Plan:
addresses through
9 sectors of sustainability and climate resilience
43 strategiesachieving communitywide goals

Environmental sustainability is broad. Implementing this plan must be equally broad. Some actions in this plan will need to be led by the Village Board, Village departments, and/or the business community. In addition, there are steps that households and individuals can take to make an impact. Ultimately, achieving the visionary goals outlined in this plan will require engagement and a sense of responsibility not only by the Village of Skokie leadership and staff, but by the community as well.

726,365

506

2.7 Billion gallons of water consumed

24,035 tons of solid waste generated

In 2016, Skokie developed its first Environmental Sustainability Plan whose implementation was designed to extend through 2021. That plan was developed over an eight-year period and guided sustainability actions in five sectors. In April 2022, the Village engaged paleBLUEdot for the development of an updated Environmental Sustainability Plan to build on the success of the first plan and establish environmental sustainability, climate resilience strategies and actions to guide community-wide and municipal operations sustainability improvements through 2030.
This document is the result and was developed over an eight-month period in collaboration with the Village’s Environmental Sustainability Planning Team.
Sustainability plans are comprehensive road maps that outline the specific strategies and actions that a community will implement to increase community sustainability.
The creation and dedicated implementation of a sustainability plan is an organized way for a municipality to contribute to improving community resilience while addressing key environmental concerns. Sustainability action can also create investment in innovation, jobs, and actions that save households and businesses money while improving quality of life particularly among the community’s most vulnerable populations.
According to the World Health Organization, studies are increasingly showing that the implementation of sustainability policies leads to both cost savings and improvement in health. As an example, the actions communities take to reduce GHG emissions in various sectors, including housing, transportation, and energy have many co-benefits that go beyond climate change mitigation. Co-benefits to sustainability planning include reduced air pollution, reduced health risks, increased resource efficiency, improved local economic security, and improved resilience of ecosystems and our built environment.1,2,3,4
Sustainability actions have direct and indirect financial impacts (e.g. savings from reduced fuel consumption). Studies show that air pollution benefits of sustainability actions can cover a significant part of the cost of those initiatives.5 Still others help avoid costs through increased resilience such as reducing dependence on fossil fuels – estimated at $5 per metric ton of GHG reduction.6 Health benefits may offer the most significant financial opportunity. One study estimated global average health co-benefits of $58-380 per metric ton of GHG.
The actions included in this and other sustainability plans support a continued improvement to the community’s quality of life. Studies indicate that successful implementation of many sustainability actions will result in increased mobility options, job creation, and reductions in poverty and inequality.8
Increasing sustainability and addressing global warming could help lessen the harmful impacts of climate change on the ecosystems that now provide us with multiple benefits.9 Increasing Skokie’s community-wide tree canopy to meet the goals of this sustainability plan, for instance, could increase the economic benefit provided by the community’s trees by as much as $300,000 annually while other actions can result in improved access to green space for residents.10

Reduced Costs
Improved


Improved


Improved Public Health

Reduced Pollution Safer Streets


Jobs

Reduced Traffic Congestion

Improved

Improved


From 1980 through 2018, Skokie has experienced:
Increase in annual average temperature:
Increase in annual precipitation:
Increase in heavy precipitation:
Increase in days >95:
Decrease in days <32:
Growing season increase:
1.13° 5.7% 34% 2 days -9 days 10 days
By 2100 Skokie can anticipate:12 , 19
Increase in annual average temperature:
Increase in annual precipitation:
Increase in heavy precipitation:
Increase in days >95:
Decrease in days <32:
Growing season increase:
Air Conditioning
Demand increase:
Climate change is a global phenomenon that creates local impacts. It presents one of the most profound challenges of our time. A broad international consensus exists among atmospheric scientists that the earth’s climate system is being destabilized in response to elevated levels of GHG emissions in the atmosphere. Two changes to Illinois’ climate are occurring already: shorter winters with fewer cold extremes, and heavier precipitation.
The climate in the Village of Skokie has already changed. From 1980 through 2018, the community has experienced an increase in annual average temperature, an increase in the number of days above 95 degrees, an increase in the number of heavy rain events, and a decrease in the number of days below 32 degrees .12,13
Some of the most significant changes in the climate relate to variability. Climate variability can be seen in the changes in annual precipitation for Skokie. Overall annual precipitation has increased; however, this increase is not evenly distributed throughout the year. Fall and winter precipitation have increased up to 15.5%, while spring and summer precipitation have remained nearly unchanged.14,15
9°-12°F 15% 30% 55 days -58 days 59 days 178%
The community’s climate is anticipated to continue to warm through this century and beyond. Precipitation is anticipated to likely increase in all seasons particularly in the spring and fall. The primary changes to climate characteristics for the community include:
• Warmer annual average temperatures with a more significant warming in winter months
• Increase in extreme heat days
• Increase in heavy rain fall events with increase in flood potential
• Increase in time between precipitation with increase in drought potential
• Greater variability in temperature and precipitation trends
Future economic and social impacts of climate change include impacts to agriculture (including food costs), energy costs, labor impacts, death rates, and crime impacts among others. The estimated economic impacts for Skokie are:16
$98,401,604
Annual Cost Impact (in 2018 dollars)*
“
Social Cost of Carbon” is measure of the share of climate change economic harm and impacts from emitting one ton of carbon dioxide into the atmosphere. For Skokie it can be calculated as follows:
The projected changes to the community’s climate in the coming decades represent potential risks to residents. These risks are inequitably felt and are particularly acute in populations especially vulnerable to them such as children, seniors, and those with disabilities (see the Skokie Climate Vulnerability Assessment for more information). Below are some of the more significant risks to the community’s population:
Certain groups of people are more at risk for stress, health impacts, or death related to extreme weather events including tornadoes, wind storms, lightning, winter storms, hail storms, and cold waves. Vulnerability to heat stress can be increased by certain variables including the presence of health conditions like diabetes and heart conditions, demographic and socioeconomic factors, and surrounding land cover.
Climate change is expected to affect air quality through several pathways including production and potency of allergens and pollen, and increased regional concentrations of ozone, increased potential of smoke from wildfires, and increased particulate air pollution and dust.
726,365
Tons
÷ = Estimated Localized Social Cost of Carbon: $135* Per Ton
* Figure does not include increased healthcare costs due to increased illness and disease, nor increased property damage due to increased extreme weather events.
According to the latest National Climate Assessment, the frequency of heavy precipitation events has already increased for the nation as a whole as well as for Illinois specifically. These heavy rain events are projected to increase throughout Illinois. Increases in both extreme precipitation and total precipitation are likely to increasingly contribute to flash flooding.
Climate change is likely to destabilize cropping systems, interrupt transportation networks and trigger food shortages and spikes in food cost.
Extreme weather events, flooding and flash flooding, as well as increasing daily stresses caused by increasing climate variability, all represent potential causes of failure of our aging infrastructure. Power outages, road damage, bridge collapse, and water infrastructure failure each represent significant physical climate risks to the community - especially individuals who are climate vulnerable.
A GHG is a molecule in the atmosphere which does not react to light energy in the visible range, but does react to light energy in the infrared range like that which is emitted from the Earth after being warmed by the sun. The most common GHGs include carbon dioxide (CO2), methane (CH4), and nitrous oxide (N2O).
GHGs let the sun's light shine onto the Earth's surface, but they trap the heat that reflects back up into the atmosphere. In this way, they act like the insulating glass walls of a greenhouse. The more GHGs there are the more heat that is trapped in our atmosphere and the more we experience the impacts of global warming.
What can we do to reduce GHGs?
GHGs can be reduced by making changes to the key GHG sectors throughout our community particularly through the reduction and elimination of fossil fuel combustion and the advancement of clean energy sources.
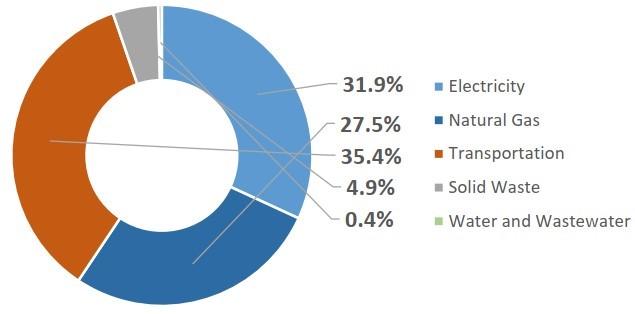
The following are the raw consumption data reported as the foundation of the Village of Skokie’s 2020 GHG Emissions:
Water:
Total
** Data is for single-family households up
.
This plan seeks to re-affirm the Village’ s commitment to the Metropolitan Mayors Caucus’ Greenest Region Compact and support the State of Illinois’ emissions reductions goals. To do so, the plan must align itself within the IPCC suggested carbon emission reduction goals associated with the Paris Agreement of 26%-28% reduction by 2025 and 80% or greater reductions by 2050. These global recommendations and state and national commitments were accounted for in the formulation of appropriate carbon reduction goals for Skokie:
To reduce community-wide GHG emissions by 35% below 2020 levels by 2030, and achieve carbon neutrality by 2050.
This community-wide goal is reflected in strategies established for individual sectors. Sector goals related to GHG emissions reductions are designed to balance reduction across all sectors and achieve the overall emissions goals set forth for the community. The goals seek to strike a balance between achievability while also stretching for improvement beyond business-as-usual.
Chicago, IL
Reduce GHG emissions 80% from 1990 levels by 2050
Deerfield, IL
Eau Claire, WI
Evanston, IL
La Crosse, WI
Madison, WI
Maplewood, MN
Milwaukee, WI
Minneapolis, MN
Reduce GHG emissions by 45% by 2030 and become carbon neutral by 2050
100% renewable energy and carbon neutrality by 2050
Community-wide carbon neutrality by 2050, zero waste by 2050 and 100% renewable electricity by 2030. Carbon neutrality for municipal operations by 2035 .
40% to 50% below 2019 levels by 2030 and achieve carbon neutrality by 2050.
100% renewable energy and net-zero emissions by 2030
Reducing greenhouse gas emissions to 20 percent of the City’s 2015 baseline levels by 2050 (an 80 percent reduction).
Reduce community-wide net greenhouse gas emissions by at least 45% and net zero GHG emissions By 2050, or sooner
100% renewable energy for city operations by 2022 and citywide electricity by 2030
Northbrook, IL 35% below 2010 levels by 2030 and 80% below 2010 levels by 2050
Oak Park, IL
Reduce community-wide GHG emissions by 60% by 2030, carbon neutral by 2050. Achieve carbon neutral municipal operations by 2035.
Rochester, MN 100% renewable energy citywide by 2031 across all sectors
St Paul, MN
Urbana, IL
Carbon neutral municipal operations by 2030, carbon neutral citywide by 2050
25% reduction in greenhouse gas emissions by 2020 and an 80% reduction in greenhouse gas emissions by 2050 from a 2007 baseline
Winona, MN Carbon neutral citywide by 2050
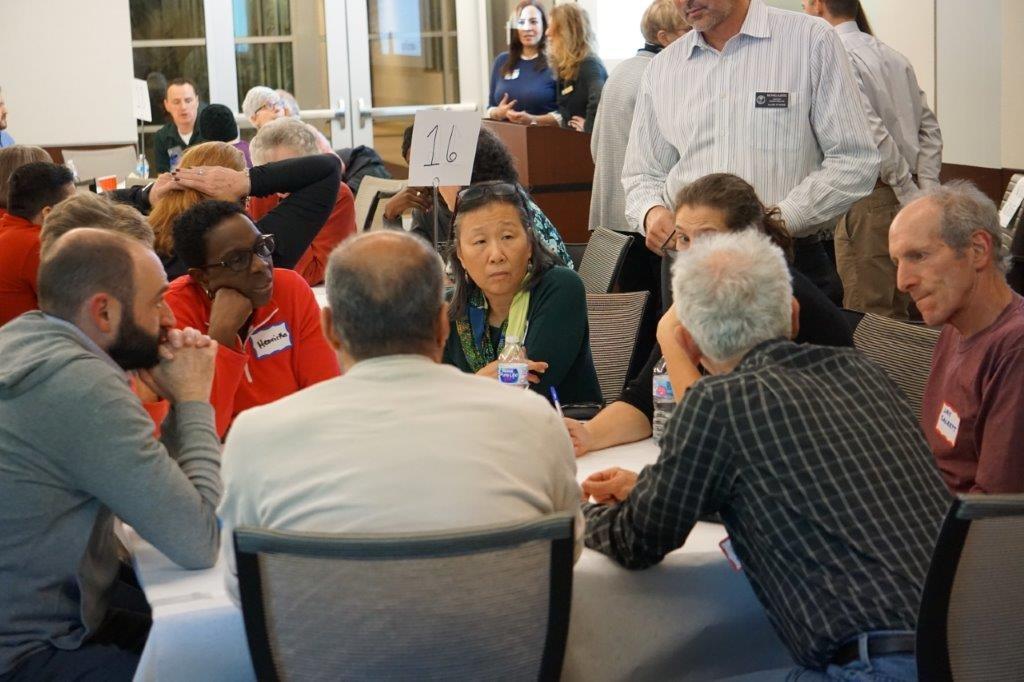
This Environmental Sustainability Plan was developed in collaboration with a 33-person planning team of community members, and Village of Skokie staff. The planning team was organized into sub-teams aligned with each of the sectors included in this plan (see Plan Framework). The plan was developed through a number of planning workshops from May 2022 through August 2022. The goals and actions identified in the Environmental Sustainability Plan are grounded in community input, expert analysis, and best practices from other cities throughout the United States. Strategic goals and detailed actions were developed, refined, prioritized, and finalized by the Planning Team through a series of workshop meetings. The result of this process is a collaboratively created, co-authored plan which directly integrates the voices of Skokie community members and Village of Skokie staff.
In support of establishing the goals, strategies, and actions included in this plan, paleBLUEdot also produced a Greenhouse Gas Emissions Projection, a Climate Vulnerability Assessment, a community-wide Renewable Energy Potentials Study, a community-wide Ground Cover, Tree Canopy, and Carbon Sequestration Study, and a Climate Action Baseline Assessment. These assessments created the foundation of the Environmental Sustainability Planning process (see Appendix A for more information).
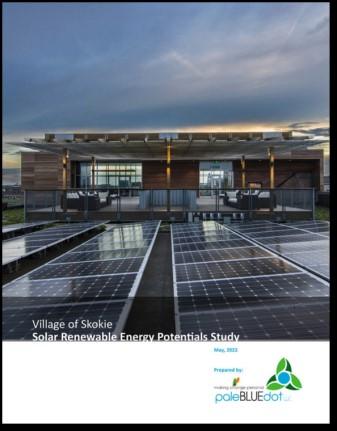
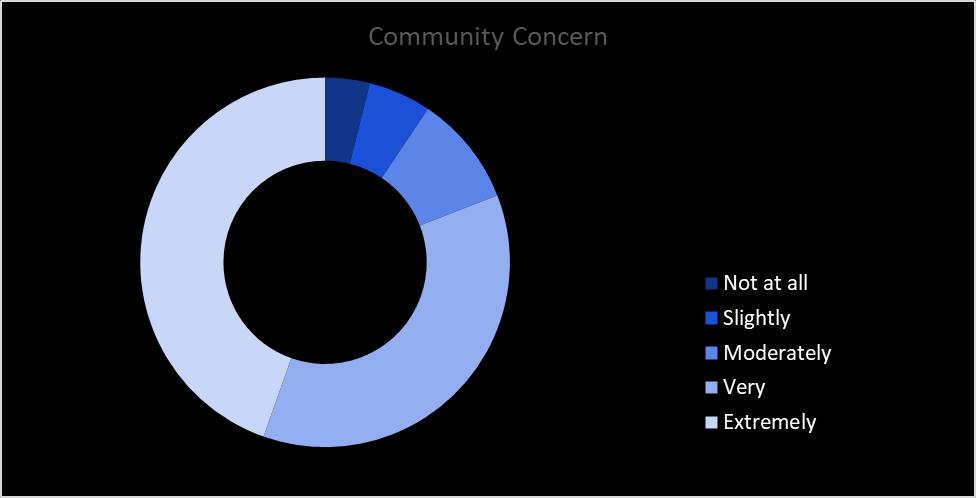
Understanding the perspectives of community members and broad community input is key to any successful community sustainability or climate planning effort. With that in mind, the Village of Skokie held community input meetings and provided presentations to the Sustainable Environmental Advisory Commission. The intent of each of these was to help the Village identify environmental sustainability needs, opportunities, priorities, and issues for the community.
The Village also issued a community survey to collect input from a broad range of community members. This survey was designed as an online questionnaire with random self-selected engagement. The survey was designed by paleBLUEdot and reviewed for edit by Village of Skokie staff. The survey was made available online on a dedicated webpage and received a total of 820 responses.


A preliminary draft of actions were reviewed against action-screening criteria which enabled the Planning Team to evaluate and prioritize the actions to be incorporated in the final Environmental Sustainability Plan. The screening criteria were established by the Planning Team and included:
• Effectiveness/Impact: How likely is it the action will work to address the goal? Will it impact a large portion of the targeted emissions sector or population?
• Equity of Implementation: Will this action positively support advancing equity within the community or address an existing inequity in the community, such as disproportionate poor air quality, access to transit, flood risk, etc? Does the action address the needs of vulnerable and historically marginalized populations? Does the action reduce vulnerability for all populations? Is it fair? Are there undesirable unintended consequences?
According to the Village’ s
• Potential For Success: Do these strategies have a track record for success locally or in other communities? Does this strategy “fit” our community well?
• Game-Changer: Is this action “visionary”? Does it have the potential to bring about, or contribute to bringing about, a fundamental change in the way the subject of the action is thought about or done? Does this action have the potential of helping to create a fundamental shift towards a more sustainable, climate-smart sector (transportation, energy, adaptation, etc)?
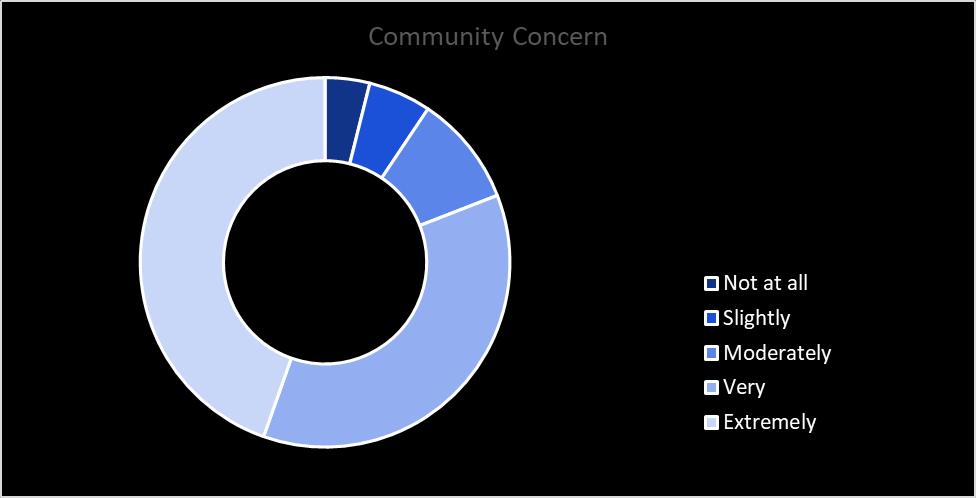
According to the Village’ s Community Survey, 88% of respondents have been personally impacted by the effects of climate change:
This Environmental Sustainability Plan includes an implementation framework designed to achieve community-wide goals for sustainability, resilience, and GHG reduction. The plan is structured around a unifying framework organized by nine community-wide sectors.
Each of these sector areas is described in a separate section with background considerations on the subject covered. In the beginning of each section, there is an identification of equity considerations that should be addressed during the ongoing implementation of each action. Sectors have over-arching strategies established to meet 2030 goals and detailed actions for implementation.
Strategies are specific statements of direction that expand on the sustainability vision and GHG reduction goals and guide decisions about future public policy, community investment, and actions. The goals included in these strategy statements should be seen as a vision. The Village may find some goals are readily surpassed while others may prove more challenging than anticipated. As outlined in Section 10 Implementation, the plan should be seen as a living document and its progress should be reviewed regularly and adjusted as appropriate.
Actions are detailed items that could be completed in order to carry out the vision and strategies identified in the plan. Each sector of this plan includes a menu of actions to be considered and prioritized into annual workplans developed by Village staff. See Section 11 Implementation, cross-cutting action CC 1-1 for more information on the annual workplan recommendation.

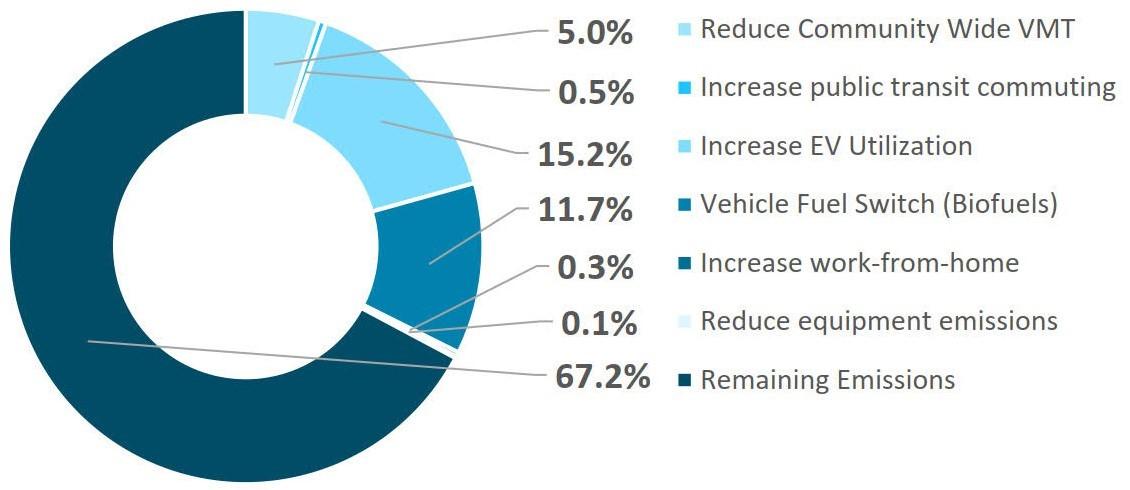
TM 1: Decrease community-wide VMT by 5% by 2030 through increased biking, walking, shared mobility, and eMobility.
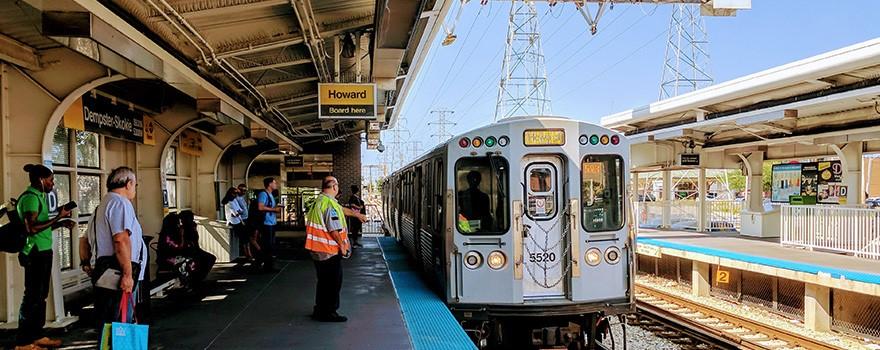
TM 2: Increase public transit access and commuter ridership from 8.9% to 11% by 2030.
TM 3: Increase electric vehicle (EV) utilization to 15% of community-wide rolling stock by 2030 (from approximately 174 vehicles to 8,100 plugin and full battery electric vehicles communitywide).
TM 4: Establish viable renewable diesel and/or biodiesel sources to serve community by 2025. Achieve 50% diesel consumption replacement with renewable diesel and/or biodiesel by 2030.
TM 5: Increase utilization of work-from-home for Skokie workers from 4.7% to 6% by 2030.
TM 6: Reduce community-wide off-road and lawn equipment annual emissions 30% by 2030.
TM 7: Reduce fossil fuel consumption in Village operations by 30% by 2030.

LH 1: Increase average population per developed acre by 10% by 2030 (from 11.3 residents per acre of developed land to 12.4).
LH 2: Reduce share of population living in high energy poverty from 15.4% to 10% by 2030.
LH 3: Update community plans, zoning, and design standards to increase housing and community resilience to the impacts of climate change, including flooding, heat island, and extreme weather particularly for populations most vulnerable.

BE 1: Improve total community-wide residential, commercial, institutional, and industrial building energy efficiency by 15% by 2030.
BE 2: Increase adoption of high-performance building construction technology, achieving 0.5% Net Zero households, commercial, and institutional properties community-wide by 2030.
BE 3: Achieve 5% residential, commercial, industrial, and institutional building "fuel switching" from on-site fossil fuel combustion to electrification by 2030.
BE 4: Increase on-site renewable energy from 0.12% to 2% of residential, commercial, industrial, and institutional electric use by 2030.
BE 5: Increase residential, commercial, industrial, and institutional green electricity purchasing (wind and solar source) communitywide to 15% by 2030.
BE 6: Increase resilience of community-wide building stock to the impacts of climate change (increased flood control and green infrastructure, etc).
BE 7: Improve total municipal building energy efficiency by 15% by 2030 (electricity and natural gas).
BE 8: Achieve 15% municipal building thermal “fuel switching" from on-site fossil fuel combustion to electrification by 2030.
BE 9: Increase on-site renewable energy to 7.5% of Village operations electricity consumption by 2030.

WM 1: Decrease landfill waste by 10% by 2030 (for Village-collected solid waste of singlefamily households up to 4-flats).
WM 2: Increase the number of commercial properties and condos that recycle and use organics collection through incentives and mandates.
WM 3: Increase organics diversion rate for single-family households up to 4-flats from 2.4% of total solid waste handled to 8% by 2030.
WM 4: Increase landfill diversion of recyclable materials 10% by 2030 while decreasing contamination of recycling collections. (for Villagecollected solid waste of single-family households up to 4-flats).
WM 5: Increase diversion of potential recoverables, hazardous waste, and construction and demolition waste 25% by 2030.

W 1: Promote increased water conservation community-wide with a targeted reduction of 7.5% by 2030 (199 million gallons conserved annually by 2030).
W 2: Update design standards and implement plans to meet projected climate change storm water and flood mitigation requirements.
W 3: Educate, engage, and empower the public on water quality and conservation.

LF 1: Increase availability and resilience of locally-produced food.
LF 2: Increase access to locally-produced food, particularly serving food-insecure individuals.
LF 3: Reduce food waste and hunger, achieve a 50% reduction in food insecurity communitywide by 2030.

GS 1: Increase tree cover, particularly in the priority neighborhoods, from 25.5% to 28% by 2030 and 31% by 2040.
GS 2: Replace 8% of turf community-wide with alternative natives or other plants or reduce maintenance cycles that benefit pollinators and increase stormwater benefits by 2030.
GS 3: Reduce heat island effect through community-wide “dark” impervious surface coverage reduction by 5% from 28.5% to 23.5% (320 acres) by 2030 and 15% (960 acres) by 2040. Reductions should be prioritized in neighborhoods identified with higher heat island impacts.
GS 4: Increase climate, flooding, and extreme heat resilience and biodiversity supportiveness of the community’s parks and open spaces.
GS 5: Increase connectivity, accessibility, and equity of community’s parks and open spaces.

HS 1: Assist the community's populations who are vulnerable to air quality, extreme temperature, flooding, and power/infrastructure failure in preparing for and mitigating climate change impacts.
HS 2: Educate, engage, and empower the public

EC 1: Develop the economic potential related to sustainability and climate action.
EC 2: Improve access to training related to sustainable economy fields to improve an equitable workforce.

CC 1: Continue to build internal capacity for support of environmental sustainability plan implementation.
CC 2: Facilitate external support needed for Environmental Sustainability Plan implementation.
CC 3: Establish sustainable financing and maintain appropriate funding to support the Village’ s Sustainability Plan implementation.
* Actions which are foundational recommendations that apply to multiple sectors. See Section 11 Implementation.

Long-term emission reduction potentials of the strategies and actions included in this plan have been modeled based on projected energy and fuel reductions and adoption rates of renewable energy and low/no emission transportation modes outlined in the strategies and actions. From this modeling, we know that with the successful implementation of the strategies of this plan, community-wide annual GHG emissions are projected to drop 256,984 metric tons below 2020 levels by 2030. The potential cumulative GHG emissions reductions over the eight-year implementation period are estimated at over 860,000 metric tons - an elimination of over 16.9 billion cubic feet of human-made GHG atmosphere resulting from this Environmental Sustainability Plan.


Click


Moving ourselves and our goods and services from place to place is energy intensive while the vehicles we use for that mobility are material resource intensive. In addition to transportation vehicles, off-road equipment like construction, recreational and lawn equipment consume significant amounts of fossil fuels for their operation.
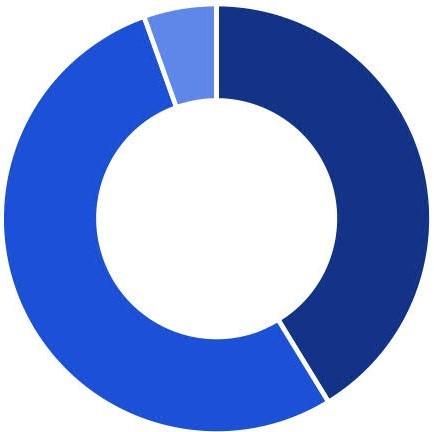
In Skokie, the Transportation and Mobility sector accounts for 35.4% of community GHG emissions and is projected to decrease as the transportation sector electrifies.
• Increased opportunities for public transit and active transportation can help address health disparities for many at-risk populations.
• Affordable and reliable mobility options for people with special transportation needs can significantly improve mobility equity. Populations with special transportation needs include older adults, youth, persons with disabilities, and persons with reduced incomes.
• Some neighborhoods in Skokie have fewer housing and transportation options than others, limiting people’s choices in where they live and how they get activities and work event potentially limiting choices in where they work.

81% of survey respondents support the Village in replacing its fleet with hybrid and electric vehicles.
• Biking infrastructure installed at Howard Street, Main Street, Old Orchard Road, and Skokie Valley Trail
• Sidewalk gap program
• Addition of Oakton CTA train station, weekend CTA service & extended hours
• Niles North High School traffic calming pilot project
• Shared parking lots – Amazon vehicles at Village Crossing
*
• Impacts of climate change on infrastructure lifespan and need for maintenance and repair
• Potential for transportation disruptions due to direct damage from extreme events
• Impacts of climate change on ease of movement and reliable access to neighborhoods, workplaces, and critical services
• Factors that could cause delays or interruptions in public transportation services or make using public transportation more difficult and less desirable
• Impacts of climate change on the safety and comfort of pedestrians and cyclists of all abilities
TM 1: Decrease community-wide VMT by 5% by 2030 through increased biking, walking, shared mobility, and eMobility.
TM 2: Increase public transit access and commuter ridership from 8.9% to 11% by 2030.
TM 3: Increase electric vehicle utilization to 15% of community-wide rolling stock by 2030 (from approximately 174 vehicles to 8,100 plug-in and full battery electric vehicles community-wide).
TM 4: Establish viable renewable diesel and/or biodiesel sources to serve community by 2025. Achieve 50% diesel consumption replacement with renewable diesel and/or biodiesel by 2030.
TM 5: Increase utilization of work-from-home for Skokie workers from 4.7% to 6% by 2030.
TM 6: Reduce community-wide off-road and lawn equipment annual emissions 30% by 2030.
TM 7: Reduce fossil fuel consumption in Village operations by 30% by 2030.


The detailed actions on the following pages are anticipated to be initiated in phases: phase 1 within 1-2 years, phase 2 within 2-5 years, and phase 3 within 3-7 years of plan approval. Phasing shown in this plan is preliminary and may evolve through implementation.


The following are detailed items that could be completed in order to carry out the vision and strategies of this sector. This menu of actions will be considered and prioritized into annual workplans to be developed by Village staff. See Section 11 Implementation, cross-cutting action CC 1-1 for more information on the annual workplan recommendation.
TM 1: Decrease community-wide VMT by 5% by 2030 through increased biking, walking, shared mobility, and eMobility.
TM 1- 1
Continue seeking funding for a new Transportation Plan. When funded, that plan will update additional documents and policies accordingly and in support of the goals of this Environmental Sustainability Plan, including the Village's comprehensive plan and non-motorized transportation management.
1
TM 1- 2
Promote and cooperate with school districts to expand and implement Safe Routes To Schools Implementation Plan for all schools within the community. Ensure improved bicycle access to all schools in Skokie including each high school. Plan implementation should focus on infrastructure and policy changes as well as promotion of biking/walking transportation to schools through education and encouragement. 1
TM 1- 3
Conduct a Sidewalk and Bike Path Quality Assessment and Master Plan to identify needs to accelerate bike paths, building sidewalks, crosswalks, and other walking infrastructure, particularly in high-need areas and areas serving vulnerable populations. Create an implementation plan establishing annual increases in the total miles of sidewalks, on-road bicycle lanes and multi-use paths. 1
TM 1- 4 Achieve "Bike Friendly Business" designation from the League of American Bicyclists for Village of Skokie facilities and operations. Promote biking, walking, carpooling and other forms of alternative commuting to Village employees.
TM 1- 5
school-aged children in Skokie with an accompanying program to educate parents and all interested adults.
TM 1- 6
Prioritize transportation funding for Vision Zero engineering improvement projects paired with VMT reduction strategies to create safe streets for people walking, biking and riding transit.
2
2
TM 1- 7
Provide incentives such as density bonuses, reduced parking, or expedited review for development projects that have mixed-used zoning (residential, retail and office uses) and commit to sustainable transportation practices. For example, prioritizing access by pedestrians and bicyclists, incentivizing increased bike rack availability, providing electric vehicle charging stations and discounted transit passes, as well as fee-appropriate parking.
2
TM 1- 8
Determine appropriate locations for "shared streets" and car-free pedestrian zones in high-density areas. Evaluate feasibility of limiting vehicles on certain days of the week and implementing congestion parking pricing, where appropriate. Revisit the Active Transportation/Niles North demonstration on Lawler Ave. Conduct a pilot project to evaluate implementation potential and strategies.
implementation.
3
TM 2- 1
TM 2: Increase public transit access and commuter ridership from 8.9% to 11% by 2030.
Promote public transportation options to Village employees, and implement a pre-tax transit benefit program for Village employees. Educate other public agencies, higher education institutions, and private-sector employees about the program and encourage them to adopt similar strategies. Goal: 15 new organizations establishing programs annually.
TM 2- 2
Explore options to reduce cost of transit passes for all youth, households with low incomes, and individuals with restricted mobility.
TM 2- 3
Promote and collaborate with CTA and Pace to provide increased carbon-free connection options to major transit routes and mixed-use hubs making a notable contribution to lowering transportation-related emissions. Consideration should be given to introduction of an autonomous shuttle as technologies develop.
TM 3: Increase electric vehicle (EV) utilization to 15% of community-wide rolling stock by 2030 (from approximately 174 vehicles to 8,100 plug-in and full battery electric vehicles communitywide).
1
2
3
TM 3- 1
Achieve designation of "EV Ready Community" through the Metropolitan Mayors Caucus.
TM 3- 2
Identify and collaborate with local partners to host ride-and-drive events to increase EV ownership by providing residents an opportunity to compare EVs to ICE vehicles through test drives. This also encourages local dealerships to stock more EVs, thus keeping business local. Showcase tools and information from vehicle manufacturers, clean air and transit regional entities, and the electric utilities. Village to showcase EV use in Village fleet.
1
1
TM 3- 3
Establish new and promote existing incentives and/or grants for EV charger installation and EV vehicles. Potential incentives may include strategies to offset or reimburse part or all of the increased State of Illinois vehicle sticker fee for EV cars. Prioritize charging near high-density housing and workplaces, and shopping districts and areas on travel routes (like near interstate and state highways).
1
TM 3- 4
Partner with public and private sector fleet operators and transit providers to work towards a goal of 20% electric fleets within Skokie by 2030 and 75% by 2040. Establish collaborations to take advantage of federal transit grant opportunities to purchase new EVs.
2
TM 3- 5
Include a No / Low Emission Fleet advancement policy in waste hauler contracting procedures which encourages waste haulers to advance utilization of electric and other no / low emission fleet vehicles and operations in support of the goals of this plan. Require hauler to conduct a GHG inventory of their Skokie operations 1-2 times during contract.
2
TM 3- 6
Explore opportunities to promote inclusion of EV chargers and alternative fuels at any new or significantly renovated gas station in Skokie. 3
TM 4- 1
TM 4: Establish viable renewable diesel and/or biodiesel sources to serve community by 2025. Achieve 50% diesel consumption replacement with renewable diesel and/or biodiesel by 2030.
Conduct a No/Low Emission Diesel Vehicle Fuel Alternative Feasibility study to identify viable no/low diesel vehicle fuel alternatives, sources, and outlets for increasing no/low emission fuel alternative availability and utilization. Study to include analysis of efficiency chain and impact on land use and other communities. Study may include exploration of existing supply chains as well as potential new sources such as through a locally operated biodiesel plant or plasma gasification plant producing hydrogen or biodiesel.
TM 4- 2
Work with gas stations to provide alternative fuels. The Village could work with existing gas stations to identify opportunities for alternative fuels as well as identifying areas for new stations, such as an EV charging station by the freeway to serve both Village of Skokie residents and through-traffic. Improving accessibility to fueling stations could persuade consumers who are worried about refueling limitations to make the switch to alternative fuel vehicles.
1
TM 4- 3
TM 5- 1
TM 5- 2
TM 5- 3
TM 6- 1
TM 6- 2
TM 6- 3
*Phasing
2
Establish communication and education campaign to encourage the use of no/low emission fuels for vehicles unable to be replaced with electric alternatives. 3
TM 5: Increase utilization of work-from-home for Skokie workers from 4.7% to 6% by 2030.
Collaborate with the Chamber of Commerce, community businesses, and local/regional colleges and universities to conduct a Remote Work Impact and Potentials Study identifying the advantages/disadvantages, and lessons learned by businesses in the community related to use of video/remote meetings in lieu of business travel for meetings and events. Depending on findings of the study, establish, distribute, and promote a "best practices" guide outlining the opportunities for operational savings and reduced vehicle use and encouraging effective, long-term increased remote meeting technologies.
Explore zoning strategies to encourage work-from-home opportunities such as allowing Accessory Dwelling Units for home office use, reducing restrictions on garage structures to allow "lofting" of garages for accessory dwelling units and home offices, etc.
Depending on findings of Remote Work Impact and Potentials Study, consider, create and implement incentives (such as free WiFi) to support increased work-from-home as well as increased capture of economic potential of the trend for Skokie businesses.
TM 6: Reduce community-wide off-road and lawn equipment annual emissions 30% by 2030.
Explore an incentive program to convert fuel-burning lawn equipment such as gas-powered lawn mowers and blowers to electric. Request support from ComEd to create a rebate program and to promote electric yard equipment.
1
2
2
1
Establish a gas-powered lawn equipment phase-out ordinance with an established time frame for implementation. 2
Explore opportunities to work with landscaping and construction industry contractors to eliminate the use of gas- and propane-powered equipment prior to the phase-out. Utilize Village newsletter and enews to encourage residents to hire contractors that use electricity or alternative clean fuel equipment or talk with their existing contractors about implementing a fossil fuel phase-out.
plan is preliminary and may evolve through implementation.
3
TM 7- 1
TM 7: Reduce fossil fuel consumption in Village operations by 30% by 2030.
Conduct a Municipal Fleet Inventory and EV Transition Implementation Plan. Identify opportunities for electrifying, right-sizing, and improving overall efficiency of vehicles to meet CAP Goals. Include implementation recommendations to incorporate EV's through right-timing purchases with a planned vehicle-replacement schedule.
TM 7- 2
Update Village Operations anti-idling policy and increase enforcement. Support policy by compiling an "Eco Driving Guide" and distribute to all employees and include in new employee training.
TM 7- 3
Update Village vehicle purchasing policy and budget process to default to alternative fuel with traditional internal combustion engine (ICE) as optional requiring proof of need and lack of EV option meeting use case. Develop policy to take emissions/fuel reductions into account when purchasing vehicles/equipment. Focus on small vehicles as well as large vehicles for alternative fuels. EV replacement to be prioritized for high-mileage vehicles or as guided by the Village's "Municipal Fleet Inventory and EV Transition Implementation Plan." For unavoidable approved ICE vehicle purchases, establish minimum fuel efficiency requirements.
Implementing many of the measures in this plan, such as reduction of singleoccupancy auto use, can save money for the community. The estimated community savings of the goals for this section include:
Decrease VMT: $93,800,000 $1,400 per capita +
Increase EV utilization: $139,100,000 $2,100 per capita
= Estimated Cumulative Savings Potential* $232,900,000* $3,500 per capita
* Allowances for expenses for EV purchase, and public transit passes are included in calculations. (see Appendix for more)
The strategies and actions included in this section of the Environmental Sustainability Plan are projected to reduce the community’s annual GHG emissions by 84,310 metric tons (MT) annually by 2030 - a 32.8% reduction from 2020 levels. When compared to 2020 emissions, this is equivalent to eliminating over 17,000 of current Skokie vehicles from the road, or 1.7 billion cubic feet of human-made GHG atmosphere annually by 2030.
The total projected change to sector emissions are as follows*:
(in 2030)
* Projections include “business-as-usual” impacts and changes such as changes to population, climate projections, etc. See the Skokie Greenhouse Gas Emissions Projections study for more.

Land-use policies establish the pattern of development and redevelopment of public and private property throughout a community. Policies that guide housing affect accessibility, energy demand, affordability, and access to opportunities for a community’s residents. Other land-use decisions can impact the balance of biodiversity, access to and consumption of environmental resources, GHG emissions associated with mobility, and the climate resilience of a community.
Skokie’s 5,960 acres of developed land supports a population of 67,775 averaging 11.3 residents per acre. Meanwhile, according to the US Department of Energy, an estimated 15.4% of all households (3,500) are required to spend over 6% of their total income to meet their home’s energy needs a condition known as “High Energy Burden” which can greatly exacerbate challenges faced by those living with economic stress.

75% of survey respondents support actions encouraging all rental properties to meet energy efficiency standards.
• In Skokie, residential buildings account for over 18% of community-wide GHG emissions – representing an important sector in community-wide energy reduction goals, while increasing energy efficiency, particularly within housing serving low income community members, will result in decreased energy burden.19
• The age, condition, quality, efficiency, and affordability of our housing determines the climate resilience of its occupants. Lower-income people without access to quality, affordable, housing consequently face disproportionate risks from extreme heat and weather exposure.20
• Involuntary displacement of people from their homes due to climate-related hazards such as flooding or fire increases vulnerability and is associated with poor health, wellbeing and socio-economic outcomes. Meanwhile, the likely migration of populations into the Skokie region due to on-going climate impacts elsewhere will increase the strain on available quality housing for all. 21, 22
• Identification of land uses and/or locations that might be particularly impacted by climate changes
• Potential for transportation disruptions due to direct damage from extreme events
• Impacts of climate change on the availability and affordability of housing stock, costs associated with home maintenance, habitation and repair
• Impacts of climate change on the functioning or maintenance requirements of infrastructure necessary for particular land uses, including residential use
• Access to safe and affordable transportation near affordable housing units, and overall community connectedness for pedestrians, bikers, and vehicles
LH 1: Increase average population per developed acre by 10% by 2030 (from 11.3 residents per acre of developed land to 12.4).
LH 2: Reduce share of population living in high energy poverty from 15.4% to 10% by 2030.
LH 3: Update community plans, zoning, and design standards to increase housing and community resilience to the impacts of climate change, including flooding, heat island, and extreme weather particularly for populations most vulnerable.
The detailed actions on the following pages are anticipated to be initiated in phases: phase 1 within 1-2 years, phase 2 within 2-5 years, and phase 3 within 3-7 years of plan approval. Phasing shown in this plan is preliminary and may evolve through implementation.


The following are detailed items that could be completed in order to carry out the vision and strategies of this sector. This menu of actions will be considered and prioritized into annual workplans to be developed by Village staff. See Section 11 Implementation, cross-cutting action CC 1-1 for more information on the annual workplan recommendation.
LH 1: Increase average population per developed acre by 10% by 2030 (from 11.3 residents per acre of developed land to 12.4).
LH 1- 1
Assess the community’s affordable housing needs and determine how housing for low and moderate income households can become sustainable in accordance with the Sustainability Plan. 1
LH 1- 2
Identify underutilized paved areas and incentivize conversion to sustainable green space or infill development. Conversion focus should take into consideration neighborhood's green space, heat island mitigation, affordable housing, and bike/walk mobility needs and prioritize site utilization based on addressing the greatest needs at each site as determined through appropriate engagement with the community, particularly people traditionally under represented. 1
LH 1- 3
Study ability to construct accessory dwelling units in Skokie and potential to increase rental and home ownership opportunities compatible with both established neighborhoods and new development. Specific consideration should be given to utility service placement and parking requirements. 1
LH 1- 4
Explore “market development” strategies, which would remove barriers for small-scale retail and essential services like daycare centers. 2
LH 1- 5
Study the usage of a Sustainability Development Incentives such as density bonuses or creation of an expedited review process for development projects that have mixed-used zoning (residential, retail, and office uses) and which meet sustainability goals of this plan. 2
LH 1- 6
Reconsider Village parking requirements and establish revisions which support the goals of this plan such as reducing overall parking requirements, establishing parking maximums, elimination or reduction of parking minimums, establishing minimum EV and bike parking requirements or incentives. Particular focus should be given to the Transit Oriented Development areas within a ¾-mile radius of train station and transit stops. Incorporate bicycle parking requirements in commercial districts.
3
LH 2- 1
LH 2: Reduce share of population living in high energy poverty from 15.4% to 10% by 2030.
Identify and publicize additional options for building improvement programs for both owner-occupied and rental properties that would reduce energy consumption for vulnerable populations and those living under high energy burden through added insulation, air sealing, passive energy systems, heat pumps, and higher efficiency equipment.
LH 2- 2
Manage disproportionate impacts of energy and resource costs associated with decarbonizing energy sources on lowerincome or vulnerable parts of the community through development of new and promotion of existing incentives and grants supporting decarbonization strategies for low-income households (owner occupied and rental).
LH 2- 3
Use grant, state, and municipal funding to implement an income-based payment system to allow low-income and fixedincome residents to participate in energy efficiency and weatherization program(s) at little to no cost.
1
LH 2- 4
Explore the potential for installation of re-deployable solar microgrid systems for resilient power use in community emergency management and hazard/disaster response. Systems can be semi-permanently installed at public facilities to provide day-to-day power and re-deployed in emergency response.
LH 3: Update community plans, zoning, and design standards to increase housing and community resilience to the impacts of climate change, including flooding, heat island, and extreme weather particularly for populations most vulnerable.
1
2
3
LH 3- 1
LH 3- 2
LH
LH 3- 4
LH 3- 5
entry into creeks from trails and roads.
Support neighborhood-based plans for all neighborhoods to encourage neighborhood identity, engagement and development. Plan goals should be to increase housing density, options, affordability, and equity while furthering the goals of the Sustainability Plan. 3

Building energy use is a major contributor to GHG emissions. GHG emissions from this sector come from direct emissions such as fossil fuels burned on-site for heating or cooking needs as well as indirect emissions such as fossil fuels burned off-site in order to supply the building with electricity. Building design plays a large role in determining the future efficiency and comfort of facilities. Increasing energy efficiency can help reduce GHG emissions and result in significant cost savings for both homes and businesses.
The residential sector in Skokie consumes over 120 million kWh annually. This is equal to 4,800 kWh per household, approximately 64% of the statewide average. The sector also consumes over 12.6 million therms of natural gas annually, 53% of statewide household average.9,15
This sector consumes over 320 million kWh, equal to 8,837 kWh per job. The sector also consumes 25 million therms of natural gas, or approximately 695 therms per job 9,15
• Often, families that live in properties that are not energy efficient are also those that can least afford high-cost utility bills and often lack the ability to pay for energy efficiency improvements.
• Renters of both single-family homes as well as multi-family housing usually do not have the ability to implement energy efficiency measures to the buildings they live in to gain the benefits of energy efficiency.
• High energy burdens exacerbates other vulnerabilities for families including exposure to heatwaves and other climate impacts.
• Solar Initiatives
- Solsmart Bronze Designation
- Reviewed Village’s solar PV policies and permitting procedures
- Member of the Northshore Community Solar project
- SEAC sponsored solar and energy conservation seminars
- STAT sponsored energy saver consulting for residents
• Wind power zoning ordinance amendment
• Electric aggregation 1.0 offered a green energy option
• LED streetlight conversion (ongoing)
• Resilience of critical infrastructure serving buildings, including streets, stormwater, and utilities
• Impacts of extreme heat and other climate changes on energy supply and demand and potential for increased power outage
• Ability of a building’s insulation and heating and cooling systems to affordably keep occupants safe during extreme temperature events

74% of survey respondents support the Village offering incentives for energy efficiency and renewable energy adoption, particularly for low-income households.
BE 1: Improve total community-wide residential, commercial, institutional, and industrial building energy efficiency by 15% by 2030.
BE 2: Increase adoption of high-performance building construction technology, achieving 0.5% Net Zero households, commercial, and institutional properties community-wide by 2030.
BE 3: Achieve 5% residential, commercial, industrial, and institutional building "fuel switching" from on-site fossil fuel combustion to electrification by 2030.
BE 4: Increase on-site renewable energy from 0.12% to 2% of residential, commercial, industrial, and institutional electric use by 2030.
BE 5: Increase residential, commercial, industrial, and institutional green electricity purchasing (wind and solar source) community-wide to 15% by 2030.
BE 6: Increase resilience of community-wide building stock to the impacts of climate change (increased flood control and green infrastructure, etc).
BE 7: Improve total municipal building energy efficiency by 15% by 2030 (electricity and natural gas).
BE 8: Achieve 15% municipal building thermal “fuel switching" from on-site fossil fuel combustion to electrification by 2030.
BE 9: Increase on-site renewable energy to 7.5% of Village operations electricity consumption by 2030.
The detailed actions on the following pages are anticipated to be initiated in phases: phase 1 within 1-2 years, phase 2 within 2-5 years, and phase 3 within 3-7 years of plan approval. Phasing shown in this plan is preliminary and may evolve through implementation.


The following are detailed items that could be completed in order to carry out the vision and strategies of this sector. This menu of actions will be considered and prioritized into annual workplans to be developed by Village staff. See Section 11 Implementation, cross-cutting action CC 1-1 for more information on the annual workplan recommendation.
BE 1: Improve total community-wide residential, commercial, institutional, and industrial building energy efficiency by 15% by 2030.
BE 1- 1
Community Development shall review for adoption of the most recent International Energy Conservation Code as well as the International Green Building Code.
BE 1- 2
Collaborate with ComEd, Nicor, and others to educate residents, businesses, and institutions on ways to lower energy costs.
BE 1- 3
Through SEAC, ComEd, Nicor, and community partners like Go Green Skokie, create a residential energy efficiency challenge promoting and expanding residential and multi-family energy efficiency audit and upgrade program similar to ComEd's "Home Energy assessments." Collect communication materials to share with residents. Develop a plan to drive residents to action; identify other community groups that can build capacity for effective outreach; publicly recognize annual challenge "winners" with successful energy reduction achievements. Track annual progress; combine efforts with increased renewable energy purchases and installations. Goal: 220 households annually.
1
1
BE 1- 4
Encourage use of current sustainability and energy-efficiency certification programs (e.g. LEED Platinum, Passive House (PHIUS), Green Globes, Living Building Challenge, American Institute of Architects (AIA) 2030, and Enterprise Green Communities) and adopt an ordinance by 2025 to have commercial, institutional, industrial, and multi-family developers participate in a certification program.
1
BE 1- 5
Promote and offer incentives for improving energy efficiency (e.g. Nicor Gas, ComEd, Cook County Property-Assessed Clean Energy financing program, insulation, energy-efficient windows, electric heat pumps) in substantially-renovated and newly-constructed properties. New construction incentives shall support measures for projects that exceed code requirements.
1
BE 1- 6
Establish and implement an energy and water benchmarking and annual reporting program for commercial, institutional, industrial, and multi-family buildings by 2025. Support improved access to utility data for building owners and managers seeking to improve energy and water performance.
2
BE 1- 7
Work with other public agencies including Park District and School districts to support energy efficiency programs, geothermal energy and solar energy installation. Goal: Achieving energy efficiency and renewable energy installation at public facilities equal to or greater than goals established in this plan by 2030.
2
BE 1- 8
Explore and implement a mechanism for expedited zoning and building code review process for projects meeting or exceeding the goals of this section to support and provide additional incentive for sustainable building projects.
2
3
BE 2- 1
BE 2: Increase adoption of high-performance building construction technology, achieving 0.5% Net Zero households, commercial, and institutional properties community-wide by 2030.
Establish a Net Zero Energy Building Guide and Solar-Ready Checklist providing building owners, renters, developers, designers, and contractors with detailed information on strategies to make new construction or significant renovation projects Net Zero Energy or Net Zero Energy ready. Include a project strategy checklist for building owners and teams to use and report sustainable strategies used.
1
BE 2- 2
Explore a policy requiring Village-assisted projects and projects receiving PUD, Special Use Permit, or other zoning action to to be built to meet or exceed an energy efficiency standard, like Sustainable Buildings 2030 (SB2030), LEED Gold, Enterprise Green Communities, the 24 National Green Building Standard ICC/ASHRAE 700, or an equivalent certification.
1
BE 2- 3
Launch a platform and training program to share best practices, providing training, and promote the Village's Net Zero Energy Guide and Solar-Ready Checklist. 2
BE 2- 4
Develop competitive Request for Proposals (RFP) for effective and innovative Net Zero pilot projects. Focus on "Net Zero building in every neighborhood" to establish visibility of strategies within the community. RFPs should encourage highquality mixed-use redevelopment on infill properties and existing surface parking lots along transit-oriented development corridors. RFPs should focus on equity, affordability, livability, and compliance/support of Sustainability Plan goals. Goal: minimum of 1 successfully completed pilot project of at least 25 homes (single-family or multi-family).
BE 3: Achieve 5% residential, commercial, industrial, and institutional building "fuel switching" from on-site fossil fuel combustion to electrification by 2030.
3
BE 3- 1
Educate residents and businesses about the benefits of replacing fossil fuel-burning heating equipment and with airsource heat-pumps, geo-thermal systems, solar thermal, or other efficient electric heating options. Include promotion of rebates and tax credits available for electrification upgrades and appliances. Collaborate with ComEd and education partners like the library and Go Green Skokie.
BE 3- 2
Explore, identify, and promote incentives for all-electric buildings.
1
BE 3- 3
Coordinate and promote a residential and small business "Electrification and Energy Efficiency/Weatherization" group purchase campaign annually to help reduce the costs of energy efficient heating systems such as air source heat pumps and ground source heat pumps through volume purchasing power (goal, 150 households and 20 businesses/institutions annually). Program design to focus on improved equity (residential and commercial) in its implementation and explore strategies to support local small business contractors. NOTE: Action may be implemented in combination with the renewable energy group purchase program action.
*Phasing shown in this plan is preliminary and may evolve through implementation.
BE 4- 1
BE 4: Increase on-site renewable energy from 0.12% to 2% of residential, commercial, industrial, and institutional electric use by 2030.
Promote existing local residential, commercial, and institutional programs through Grow Solar Chicagoland and the Citizens Utility Board (CUB) that offer group purchasing to lower the cost of solar installations. Goal: 150 households and 1.1% of commercial/industrial sector electrical consumption "solarized" annually.
1
BE 4- 2
Continue to promote existing North Shore Community Solar Program. Explore options to increase the purchase of renewable energy. 1
BE 4- 3
Achieve Solsmart Gold Level Status requirements. Create a solar landing page with promotional and technical information on the Village website.
BE 4- 4
Explore creation of a Solar Ready Ordinance to require all commercial, institutional, and multi-family buildings to be solar ready and to require on-site solar for all commercial properties receiving Village funding and incentives. See Village's Solar Ready Guidelines.
BE 5: Increase residential, commercial, industrial, and institutional green electricity purchasing (wind and solar source) community-wide to 15% by 2030.
2
2
BE 5- 1
Continue Community Choice Electricity Aggregation (Aggregation). Explore expanding the reach of the Aggregation program and tighten sourcing requirements to encourage/require energy suppliers to directly invest in renewable energy. Goal: 200 additional households and 50 additional businesses and institutions signed on annually.
1
BE 5- 2
Promote green power purchase options, when reasonably available, such as those provided by ComEd and Nicor. Collaborate with utilities on promotion and education of available options. Goal: 200 additional households and 50 additional businesses and institutions signed on annually.
1
BE 6- 1
BE 6: Increase resilience of community-wide building stock to the impacts of climate change (increased flood control and green infrastructure, etc).
Conduct a Village Facilities Resilience Assessment and Implementation Plan outlining appropriate facility resilience upgrade projects and establishing a timeline for implementation. Resilience considerations to include flooding, flash flooding, and urban heat island mitigation among other considerations. Resilience assessment should include considerations for how municipal facilities can enhance or support resilience for surrounding community, particularly vulnerable populations (i.e. establishment of cooling center access, etc.).
BE 6- 2
BE 6- 3
BE 6- 4
1
BE 7- 1
Streamline approval process of "green roofs" by Village Appearance Commission. Provide training or education of staff and commission members. 1
Seek funding opportunities through FEMA "Building Resilient Infrastructure and Communities (BRIC) grant program for resilience upgrade projects as identified in the Village Facilities Resilience Assessment and Implementation Plan. 2
Explore development of "Cool Roof," "Green Roof," “Green Wall”/“Live Wall” and “vertical garden” incentives (demonstration projects, voluntary programs, incentivized program, ordinance/policy) to meet long-range dark impervious surface reduction goals. Coordinate with existing compatible municipal policies such as the Stormwater Management Utility fee structure. Examples of incentive programs have been developed by the Climate Protection Partnership Division in the U.S. Environmental Protection Agency’s Office of Atmospheric Programs.
BE 7: Improve total municipal building energy efficiency by 15% by 2030 (electricity and natural gas).
Conduct a Village Facilities Energy Audit on all buildings within the next 3 years targeting energy efficiency meeting or exceeding goals of this plan. Use results from Village Facilities Energy Audit to prioritize Village Facilities Capital Improvement Plans (CIPS) and maintenance improvements. Plan to establish a timeline for implementation all improvements within 5 years of completion of energy audits.
3
BE 7- 2
Establish a Green Building policy that requires all new municipal buildings to meet and maintain energy, resource efficiency, and on-site fossil fuel combustion reduction and elimination goals or building standards (ENERGY STAR, LEED, Home Energy Score or other). Policy to require energy consumption to be benchmarked and disclosed annually. Encourage houses of worship, schools, park district, and other public and private agencies to establish similar policies.
1
BE 7- 3
Explore use of the Guaranteed Energy Savings Program (or another option such as a tax-exempt bond or performance contracting) to finance all possible municipal solar projects and renewable energy purchases through the utility.
1
BE 7- 4
Conduct an occupancy and plug load energy efficiency study of primary Village owned facilities and establish a "Plug Load and Occupancy Energy Efficiency Guide" outlining operational practices to advance the Village's energy efficiency goals for Village facilities. Provide training to all existing Village employees and provide on-going training to all new Village hires.
*Phasing shown in this plan is preliminary and may evolve through implementation.
2
2
Implementing many of the measures in this plan, such as reduction of singleoccupancy auto use, can save money for the community. The estimated community savings of the goals for this section include: Residential
The strategies and actions included in this section of the Environmental Sustainability Plan are projected to reduce the community’s annual GHG emissions by 94,753 metric tons (MT) annually by 2030 - a 22% reduction from 2020 levels. It should be noted these decreases include impacts anticipated by a 10% population increase projected for Skokie by CMAP. When compared to 2020 emissions, this is equivalent to eliminating nearly 20,000 of current Skokie vehicles from the road, or 1.9 billion cubic feet of human-made GHG atmosphere annually by 2030.
The total projected change to sector emissions are as follows*:
* Allowances for expenses for energy efficiency and renewable energy upgrades are included in calculations. (see Appendix for more)
* Projections include “business-as-usual” impacts and changes such as changes to population, climate projections, etc. See the Skokie Greenhouse Gas Emissions Projections study for more.

Waste management refers to both waste that is sent to a landfill and waste that is recycled or re-used. Habitat destruction, global warming, and resource depletion are some of the effects of our materials consumption.
Organic waste and food discards and residuals that decompose in landfills release methane, a GHG that is at least 28 times more potent than carbon dioxide. This fact makes food wasting a significant contributor to solid waste GHG emissions.
Recycling - converting discarded materials into new materials or putting them to beneficial use (which can include organic waste)is an important approach in mitigating these impacts and reducing the pollution caused by wasting.
In 2020, community-wide municipal solid waste (MSW) totaled 24,035 tons. Of the MSW handled, an estimated 20.6% were recycled, 2.4% were collected organics, and the remaining 77% were landfilled.
• Accessibility to recycling and composting programs may not be equally or readily available to all community residents and businesses or may be impacted by other participation-related barriers, including awareness of programs, user fees, accessibility based on housing type, and language barriers.
• Reducing and preventing food waste can increase food security, and economic efficiency; however, studies show that due to the high cost of healthy foods which are also more perishable, lowincome households must often sacrifice healthier food options to avoid food waste while maintaining budgets.*
• Curbside recycling
• Food composting curbside pick-up franchise agreement
• Backyard compost bin rebate
• Textile recycling
• Grass clippings ban
• Tree logs are repurposed into pallets
• On-going marketing through NewSkokie, Skokie news, library programs
• Climate impact vulnerability of waste management infrastructure
• Extreme weather impacts on waste collection frequency and routes
• Waste pickup equipment GHG emissions contributing to climate change
• Fossil fuel price increases and climate impacts such as extreme weather events will complicate waste management

76%
WM 1: Decrease landfill waste by 10% by 2030 (for Village-collected solid waste of single-family households up to 4-flats).
WM 2: Increase the number of commercial properties and condos that recycle and use organics collection through incentives and mandates.
WM 3: Increase organics diversion rate for single-family households up to 4-flats from 2.4% of total solid waste handled to 8% by 2030.
WM 4: Increase landfill diversion of recyclable materials 10% by 2030 while decreasing contamination of recycling collections (for Village-collected solid waste of single-family households up to 4-flats).
WM 5: Increase diversion of potential recoverables, hazardous waste, and construction and demolition waste 25% by 2030.
The detailed actions on the following pages are anticipated to be initiated in phases: phase 1 within 1-2 years, phase 2 within 2-5 years, and phase 3 within 3-7 years of plan approval. Phasing shown in this plan is preliminary and may evolve through implementation.


The following are detailed items that could be completed in order to carry out the vision and strategies of this sector. This menu of actions will be considered and prioritized into annual workplans to be developed by Village staff. See Section 11 Implementation, cross-cutting action CC 1-1 for more information on the annual workplan recommendation.
WM 1- 1 Coordinate with public partners to establish paths towards Zero Waste program ("Zero Waste" as defined by the US Conference of Mayors). Program to provide outreach to support recycling provided and promoted in all schools, public housing, park district facilities, public space, and Village buildings. Program to also include zero waste curricula and communications content as well as zero waste strategies for school facilities.
and
service providers to develop and fund a waste audit and diversion assistance program for businesses.
support businesses in establishing, tracking, and reporting waste streams, identifying reduction, diversion, beneficial use opportunities,
WM 2- 1
WM 2: Increase the number of commercial properties and condos that recycle and use organics collection through incentives and mandates.
-
WM 2- 2
Based on information collected through the Village's on-going research and community outreach, identify financial and other barriers to recycling and composting in multi-family buildings (e.g., different priorities between property management company and tenants, lack of knowledge of costs). 1
WM 2- 3
-Use Code Updates - improve commercial and multi-family recycling requirements by revising Land Use Code to require commercial indoor and outdoor space for recycling and organics collection equal to or greater than the space provided for disposal.
WM 2- 4
Establish a webpage or online pamphlet that can be used by landlords to help residents know about park locations, bike/walk/transit info, sustainability goals and resources, trash and recycling opportunities, renewable energy options, incentives, etc. Website links can be distributed as a part of the Neighborhood Integrity Ordinance licensing program in addition to other avenues.
WM 3:
organics
for single-family households up to 4-flats from 2.4% of total solid waste handled to 8% by 2030.
WM 3- 1
to grocers, restaurants, and food pantries to understand current practices in handling expiring perishable items. Use outreach to identify challenges to and opportunities for reduced landfilling of food waste and increased donation. 1
WM 3- 2
Contact local and regional partners, including Solid Waste Agency of Northern Cook County (SWANCC) and private contractors, to research ways to provide convenient and cost-effective composting services.
1
WM 3- 3 Research the feasibility of waste audits for multi-family residences and commercial properties to provide better Skokie-specific milestone data. 1
WM 3- 4
Increase residential participation in Village's food scrap compost collection and provide information on the value and methods for composting. Goal: increase participation by 5% annually through 2030. 2
WM 3- 5
Increase availability of composting options for residents and businesses such as expanded curbside organics collection, offering low-cost or free compost bins for back-yard composting, workplace composting, free municipal drop-off locations, and organics-to-compost partnerships with community gardens. Include a focus on options which support local gardening and food production.
2
WM 3- 6
Based on outreach, establish a program to increase diversion of viable food currently entering waste stream to food pantries, non-profits, and other pathways serving food insecure community members. When not edible, organic waste shall be composted through a Village-approved vendor. Program may include incentives, information, promotion, support such as "zero-waste coaches," requirements, and/or business recognition awards.
*Phasing shown in this plan is preliminary and may evolve through implementation.
2
WM 4- 1
WM 4: Increase landfill diversion of recyclable materials 10% by 2030 while decreasing contamination of recycling collections. (for Village-collected solid waste of single-family households up to 4-flats)
Create a comprehensive communication campaign to provide standardized information, educational communications, and action items on waste reduction, organics collection, recycling, and hazardous waste handling to reach the commercial and residential sectors. Include updates on waste diversion programs available to residents and businesses. 1
WM 4- 2
Incentivize increased use of reusable food and beverage packaging, maximized recycling/composting of food packaging and minimized landfill trash generation among community businesses. Require that Village-hosted events and users of certain Village facilities follow these practices. 1
WM 4- 3
an award program for businesses, schools, and other non-residential properties to recognize recycling leaders. 2
WM 4- 4 Research options and advocate collection of Styrofoam blocks for pelletization (reuse) and/or extrusion (recycling or disposal). 3
WM 5: Increase diversion of potential recoverables, hazardous waste, and construction and demolition waste 25% by 2030.
WM 5- 1
Reduce construction and demolition waste by ensuring that strong recycling and reuse requirements are met for all building-related permits community-wide. Require compliance with Cook County's construction and demolition requirements including waste management plans; provide support resources such as a copy of the ordinance and requirements with Village permit materials. Partner with Habitat, reuse warehouses and county facilities to promote reuse options.
1
WM 5- 2
an informational sheet for permit holders outlining Cook County requirements and resources for disposal. 1
WM 5- 3
WM 5- 4
Implementing many of the measures in this plan, such as reduction of singleoccupancy auto use, can save money for the community. The estimated community savings of the goals for this section include:
The strategies and actions included in this section of the Environmental Sustainability Plan are projected to reduce the community’s annual GHG emissions by 16,000 metric tons (MT) annually by 2030 - a 45% reduction from 2020 levels. It should be noted these decreases include impacts anticipated by a 10% population increase projected for Skokie by CMAP. When compared to 2020 emissions, this is equivalent to eliminating nearly 3,400 of current Skokie vehicles from the road, or 314 million cubic feet of human-made GHG atmosphere annually by 2030.
The total projected change to sector emissions are as follows*:
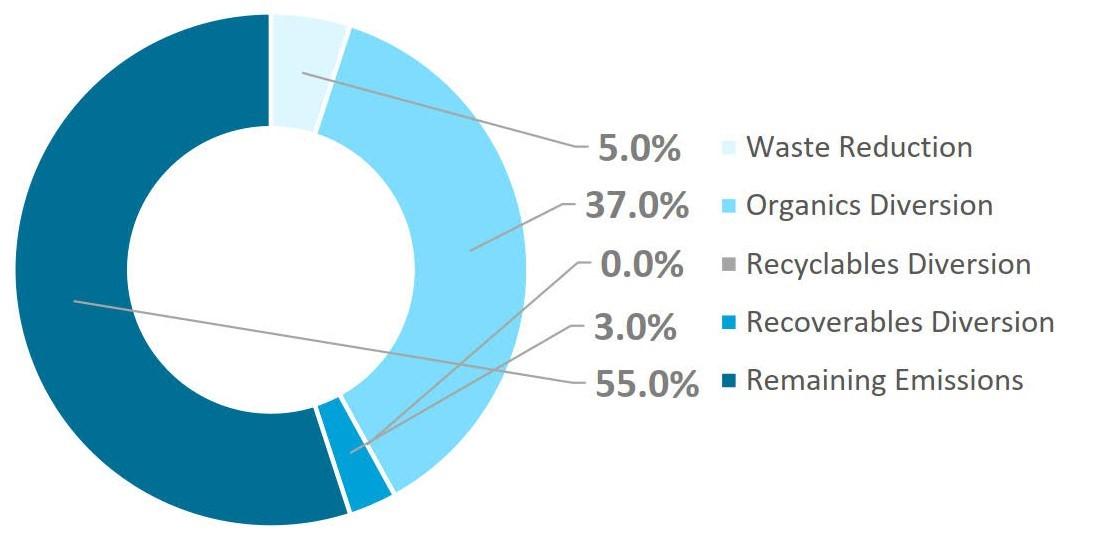
* Projections include “business-as-usual” impacts and changes such as changes to population, climate projections, etc. See the Skokie Greenhouse Gas Emissions Projections study for more.


Water is at the core of climate change and sustainable development. Quality water is vitally important for socio-economic development, for maintaining healthy ecosystems, and for human survival. Water is central to the production and preservation of a wide range of services benefiting people. How we process water is also linked to our GHG emissions. Water and wastewater related GHG emissions total 2,801 metric tons in Skokie annually1
Water is also at the heart of adaptation to climate change. There are nearly 2,782 properties at risk of flooding community-wide with 1,833 properties (9% of all properties) in Skokie having a greater than 26% chance of being severely affected by flooding over the next 30 years.2
Climate change will increase the likelihood of drought combined with additional heavy rain events, flooding, and flash flooding.3 Climate change will also increase stress on our water systems, increase water pollution potential, and place more risk on maintaining safe water resources. Water is an irreplaceable, critically important resource fundamental to the well-being of our communities. Water can only be considered renewable with high-quality best water management practices in place.
• Low-income neighborhoods frequently suffer more damage from flooding.7 The frequency and magnitude of heavy rain events is expected to increase as a result of a changing climate, making the future flooding impacts for at-risk neighborhoods potentially more acute.
• Disadvantaged communities within cities often have denser populations, more impervious surfaces, and less open/green spaces. These areas can also be prone to flooding and sewer overflows. Stormwater management through the creation of open, green spaces serve to revitalize and promote health within these disadvantaged communities.

82% of survey respondents support the Village increasing green space requirements in ordinances to support stormwater management.
• Impacts of current and projected future precipitation patterns on water resources, including processes that are critical for maintaining drinking water supplies
• Impacts of extreme events (e.g., heat waves, flooding, drought) on water quality and stormwater management systems
• Water resource conservation measures that are already being implemented in the community, as well as existing and potential areas that could be used for natural floodwater storage
73% of survey respondents support the Village establishing policies to encourage use of “green roofs” within the community.

W 1: Promote increased water conservation community-wide with a targeted reduction of 7.5% by 2030 (199 million gallons conserved annually by 2030).
W 2: Update design standards and implement plans to meet projected climate change storm water and flood mitigation requirements.
W 3: Educate, engage, and empower the public on water quality and conservation.
The detailed actions on the following pages are anticipated to be initiated in phases: phase 1 within 1-2 years, phase 2 within 2-5 years, and phase 3 within 3-7 years of plan approval. Phasing shown in this plan is preliminary and may evolve through implementation.

The following are detailed items that could be completed in order to carry out the vision and strategies of this sector. This menu of actions will be considered and prioritized into annual workplans to be developed by Village staff. See Section 11 Implementation, cross-cutting action CC 1-1 for more information on the annual workplan recommendation.
W 1: Promote increased water conservation community-wide with a targeted reduction of 7.5% by 2030 (199 million gallons conserved annually by 2030).
W 1- 1
Facilitate reduction of water use by top 20 customers through an opt-in program. Offer free technical resources to large institutions and businesses to identify specific opportunities for employees or customers to conserve water and incorporate water efficiency into internal operations. 1
W 1- 2 Enhance and increase enforcement of the Village's outdoor watering restrictions. 1
W 1- 3
Develop and implement water conservation education and outreach programs in residential, commercial, and institutional sectors. Include promotion of available water efficiency and conservation incentives and programs. 1
W 1- 4 Finalize analysis of leaks in drinking water distribution system, implement findings Goal: reduce water leaks by 50% by 2030. 1
W 1- 5
Consider rate design structures that incentivize reductions in water consumption. Include utility services and capacity support to implement income-based payment plan. Include education and engagement plan to raise awareness about climate change and water efficiency. 1
W 1- 6
Encourage the installation of low-flow water fixtures in residential homes and expand the program to commercial businesses. Goal: achieve 200 households and 30 businesses and institutions upgraded annually. 2
W 1- 7
Explore installation of rainwater collection systems at Village facilities for graywater uses, and investigate opportunities for graywater reuse at existing and new Village facilities and properties. Implement graywater systems identified capable of reducing energy/water demand in other areas (for example, watering urban tree canopy to reduce heat island effect and air conditioning needs).
2
W 2: Update design standards and implement plans to meet projected climate change storm water and flood mitigation requirements.
W 2- 1 Develop green infrastructure implementation goals and integrate with Cook County Multi-Jurisdictional Hazard Mitigation Plan and seek funding opportunities through Federal Emergency Management Agency (FEMA)’ s Building Resilient Infrastructure and Communities (BRIC) Grant Program. Include a focus on equity in implementation.
W
W
W
W


Transporting and refrigerating food across long distances burns GHG emitting fossil fuels. The less transportation and refrigeration needed to supply our food, the more sustainable it becomes.
Buying food from local sources reduces GHG emissions while also supporting the small business local economy. Studies have indicated that nearly 32 jobs are created for every $1 million in revenue generated by produce from farms involved in a local food market. This is compared to only 10.5 jobs for those involved in wholesale channels exclusively.1 Meanwhile, the outdoor and social activity supported by community gardens and increased gardening in neighborhoods have social and community benefits like increasing social cohesion, providing multi-generational activity, supporting outdoor low-impact exercise, and supporting plant/ animal/pollinator habitat. 11
Our food system is also vulnerable to impacts of climate change like extreme precipitation and heat, climate-induced invasive species, and livestock vulnerabilities.2
Food insecurity disruption of nutrition availability because of lack of money, access, or other resources is inequitably felt. People experiencing low income are nearly three times more likely to experience food insecurity.3 We should anticipate that the climate change vulnerabilities of our national food system will exacerbate the inequities of food security in all communities.
• People in low-income neighborhoods may have limited access to full-service supermarkets or grocery stores - an area known as a “food desert.”
• Studies have also shown that communities with fewer resources often have more outlets that promote unhealthy dietary behaviors such as fast food restaurants, and little access to affordable nutritious food. This condition is known as a “nutrition desert.”
• New local food systems and programs can perpetuate inequities if not carefully designed. Without a focus on inclusion during their design, programs often unintentionally leave out the people who cannot afford to “buy local” or organic and who may benefit the most from healthy locally-produced foods.

Shifting just 20% of food purchases in the Village of Skokie to local food sources would add 260 local jobs.
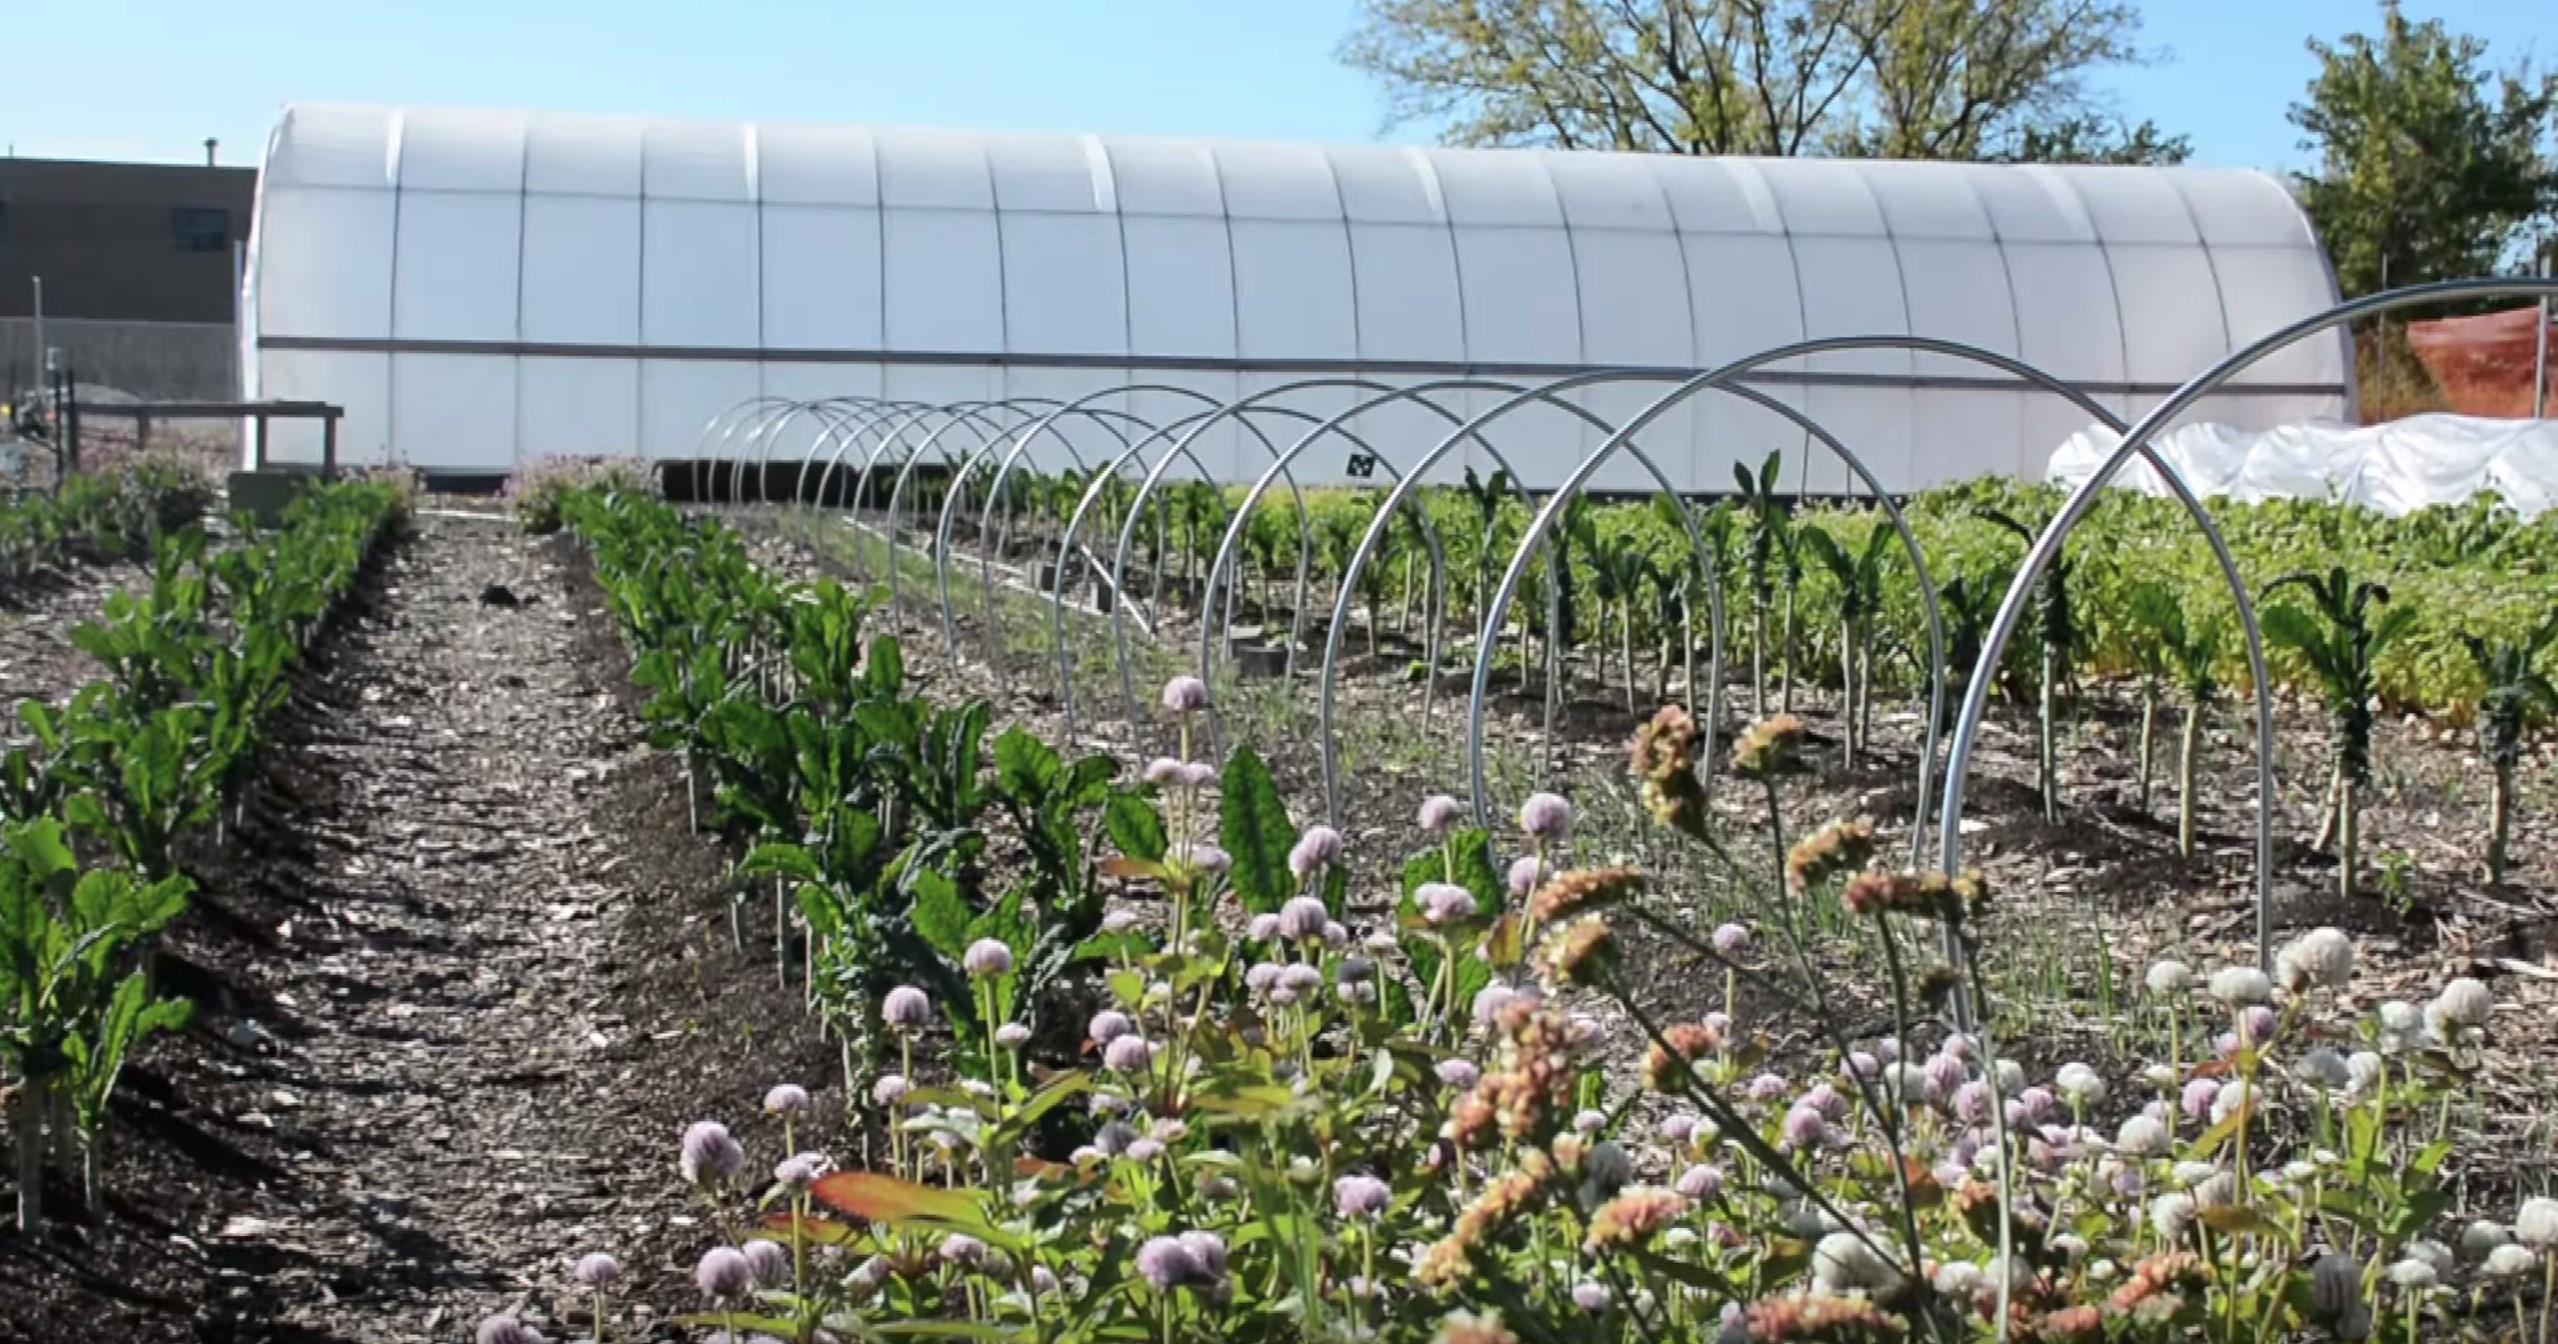
$15,900,000
Could be added to Skokie’s economy by shifting just 20% of food purchases to local sources.
The following are detailed items that could be completed in order to carry out the vision and strategies of this sector. This menu of actions will be considered and prioritized into annual workplans to be developed by Village staff. See Section 11 Implementation, cross-cutting action CC 1-1 for more information on the annual workplan recommendation.
Phase* Strategy Action
LF 1- 1
LF 1: Increase availability and resilience of locally-produced food.
Conduct a study to identify vacant properties or under-utilized plots/land area which could be transformed into urban farms or community garden plots and establish an implementation plan accordingly.
LF 1- 2
Collaborate with schools and park district to establish a “Grow Skokie” program increasing community garden plots and establishing a “market garden” concept supporting garden and urban agriculture training and internship opportunities for youth. Program to work with local restaurants, food shelves, or others working directly with food-insecure individuals in the community for distribution of food grown in the “market garden.” Explore potential of partnering with Oakton Community College.
1
LF 1- 3
Create and promote a publicly available GIS map database to locate and increase awareness of community garden locations within the community and provide contact information.
LF 1- 4
Revise zoning ordinances to remove barriers to urban agriculture: yard and rooftop food production, beekeeping, front-yard gardens, edible landscaping, and foraging. Examine and pursue other policy levers to increase food production within the community. Utilize available and appropriate parks and recreation lands for urban farming and food production.
1
LF 1- 5
Encourage school districts and park district to expand community gardens and opportunities for community growing spaces (including indoor) with a focus on youth, immigrant, and low-income residents. Explore grant opportunities such as the United States Conference of Mayors environmental sustainability award.
1
LF 1- 6
Review/update code to provide incentives for multi-unit buildings and developments/sub-divisions and commercial developers to preserve topsoil, use finished compost for soil amendment, and provide space for backyard or community gardens.
2
2
LF 2- 1
3 LF
Health Department and Human Services Department staff to coordinate with potential partner organizations such as The Talking Farm to identify collaboration opportunities. Particular attention will be applied to potential opportunities for food pantry and Supplemental Nutrition Assistance Program (SNAP) benefit collaboration.
LF 2- 2
Explore opportunities, spaces, and potential partners to expand farmers’ markets (particularly year-round market opportunities), local food hubs and marketing of locally-produced and organic foods. Efforts to focus on increased community equity and food security among at-risk populations.
*Phasing shown in this plan is preliminary and may evolve through implementation.
1
2
LF 3- 1
LF 3: Reduce food waste and hunger, achieve a 50% reduction in food insecurity community-wide by 2030.
Conduct a detailed Food Security Assessment to determine food insecurity conditions within the community, areas with limited access to full-service grocery stores and markets (particularly within areas of higher vulnerable population counts), identify areas within the community for improvement, and establish detailed strategies to increase food security community-wide.
LF 3- 2
Continue to provide enrollment assistance for participation in the SNAP, the Special Supplemental Nutrition Program for Women, Infants and Children Program and other food assistance programs as well as supporting local initiatives addressing financial food insecurity.
1
LF 3- 3
Investigate feasibility of a Food Access Fund to support decreasing food waste and increasing food recovery via the Environmental Protection Agency’s Food Recovery Hierarchy through existing and new initiatives as well as private, innovative competitions. Explore partnerships between local food pantries, Skokie schools, and restaurants for ways to distribute unused food to vulnerable or food insecure individuals.
1
LF 3- 4
Promote awareness of the correct actions to reduce food waste at the household level through public education campaigns
LF 3- 5
Work regionally to support and facilitate food donation programs. Food donation programs reduce the amount of healthy, safe food that goes to waste and redirects it to those in need.
1
LF 3- 6
Develop an emergency food plan that includes a food needs assessment, scenarios for provisioning necessary food supplies during a range of anticipated emergencies, and a distribution and public communication plan that takes into account those most at risk for food insecurity. Work with local retailers, producers, and warehouses to implement food provisioning scenarios.
2
2
3
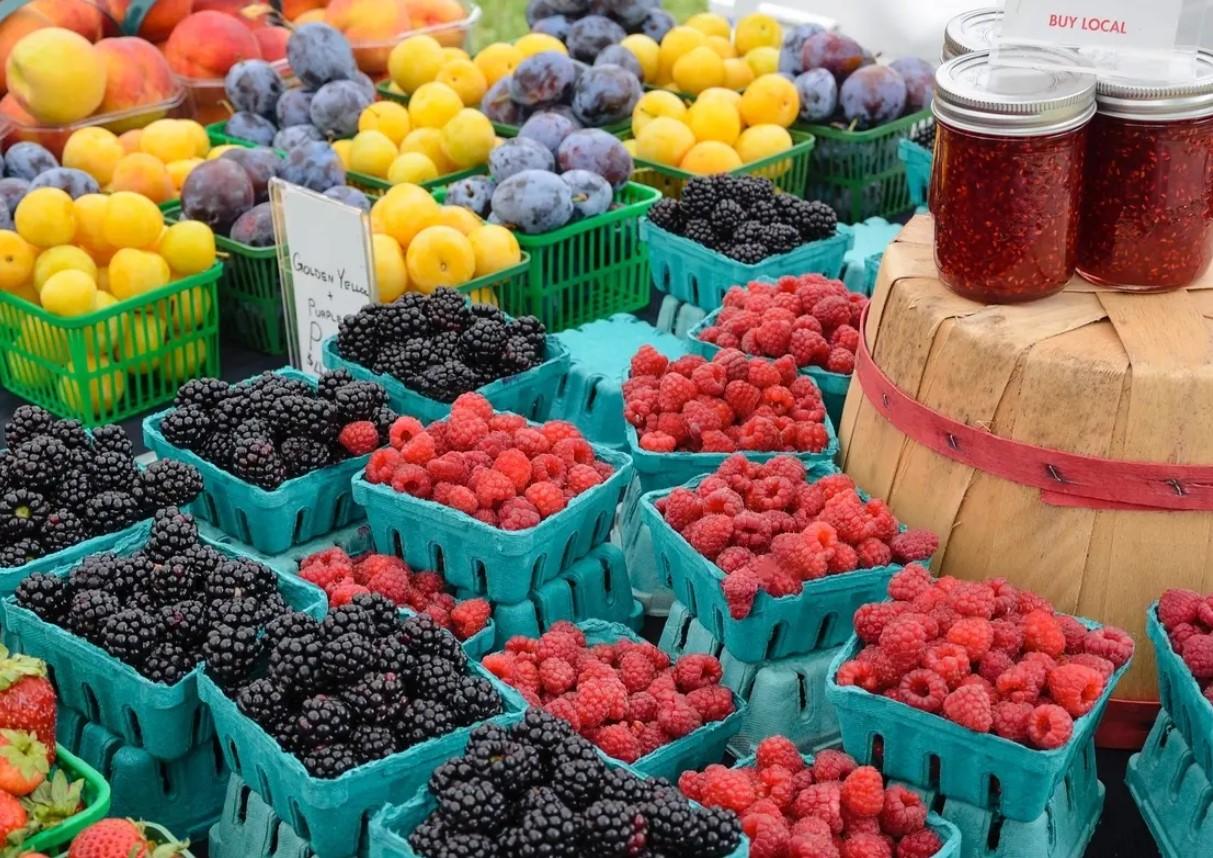


Trees and natural ground cover play a central role in supporting the physical and mental health within communities, improving air and water quality, helping to reduce building energy use, and supporting climate mitigation. Trees are critical in filtering air and removing harmful pollutants such as carbon monoxide, particulate matter, and ground-level ozone.
Conversely, higher levels of impervious surfaces (pavement and buildings) within a community will increase the heat island of the community. Heat island refers to the phenomenon of higher atmospheric and surface temperatures occurring in developed areas than those in the surrounding rural areas due to human activities and infrastructure. Increased heat indices during summer months due to heat island effects raise human discomfort and health risk levels in developed areas, especially during heat waves. There is a direct relationship between the amount of impervious surface coverage in a community and the corresponding degree of heat island temperature experienced meaning a conscious effort to increase green space and tree canopy coverage in areas of higher heat island impacts can lower those impacts.1
• Lower-income neighborhoods and neighborhoods with higher proportions of people of color regularly have lower tree canopy coverage, and less of the environmental, economic, and qualityof-life benefits trees support than more affluent neighborhoods.
• “Heat islands” and “micro heat islands” are built-up areas that are hotter than other nearby areas. This is caused by lack of adequate green space and healthy tree canopy coverage combined with too many hard surfaces like roads, parking lots, and hard building surfaces. Frequently, neighborhoods with higher vulnerable populations have the highest heat island impacts.

Neighborhoods in Skokie experience hot weather as much as 6.9°F
warmer than rural communities due to heat island impacts.
• Climate impacts on existing parks, conservation areas, and other green spaces, and how that may be altered by changes in temperature and precipitation in coming decades
• Potential impacts of climate change on patterns of use around parks and recreational areas.
$3,000,000
In estimated annual benefits to the community provided by Skokie’s tree canopy (includes energy savings and pollution absorption).
GS 1: Increase tree cover, particularly in the priority neighborhoods, from 25.5% to 28% by 2030 and 31% by 2040.
GS 2: Replace 8% of turf community-wide with alternative natives or other plants or reduce maintenance cycles that benefit pollinators and increase stormwater benefits by 2030.
GS 3: Reduce heat island effect through community-wide “dark” impervious surface coverage reduction by 5% from 28.5% to 23.5% (320 acres) by 2030 and 15% (960 acres) by 2040. Reductions should be prioritized in neighborhoods identified with higher heat island impacts.
GS 4: Increase climate, flooding, and extreme heat resilience and biodiversity supportiveness of community’s parks and open spaces.
GS 5: Increase connectivity, accessibility, and equity of community’s parks and open spaces.
The detailed actions on the following pages are anticipated to be initiated in phases: phase 1 within 1-2 years, phase 2 within 2-5 years, and phase 3 within 3-7 years of plan approval. Phasing shown in this plan is preliminary and may evolve through implementation.


The following are detailed items that could be completed in order to carry out the vision and strategies of this sector. This menu of actions will be considered and prioritized into annual workplans to be developed by Village staff. See Section 11 Implementation, cross-cutting action CC 1-1 for more information on the annual workplan recommendation.
GS 1: Increase tree cover, particularly in the priority neighborhoods, from 25.5% to 28% by 2030 and 31% by 2040.**
GS 1- 1
Continue to use a diverse selection of native tree species in new plantings, particularly those that will be most resistant to the stresses of climate change within the region. Develop a comprehensive recommended tree planting list of species that meet the following criteria: adaptability to climate change, especially heat extremes, drought, flooding, and high winds; hardiness and longevity; provision of food and hosts for wildlife, including bees, butterflies, birds, and other creatures; species native to the area (200-mile radius).
1
GS 1- 2 Promote the Village's free parkway tree program and the free tree offerings coordinated by the Metropolitan Water Reclamation District of Greater Chicago (MWRD). 1
GS 1- 3
Establish a tree planting plan to meet the goals of the Environmental Sustainability Plan. Prioritize tree replacement programming in neighborhoods based on factors outlined in the Village's Ground Cover study including those with low-income households, vulnerable populations, street and boulevards with less than 30% sidewalk/curb length shade coverage. Include a focus on increasing shade trees areas where people congregate (picnic areas, bus shelters, etc.). See Village's 2022 Ground Cover, Tree Canopy, and Carbon Sequestration Study.
1
GS 1- 4
Prioritize planting and preservation of native species of plants and trees on public and private property through education, incentives and other promotional programs. Ensure that landscaping requirements articulated in the zoning code include the preservation of the maximum possible number of existing trees, the use of native plantings and the preservation of natural areas whenever possible. 2
GS 1- 5 Establish a policy to plant back twice the number of trees as were removed the previous year on Village-owned properties. 2
*Phasing shown in this plan is preliminary and may evolve through implementation.
** See Village of Skokie s Ground Cover Study for information on potential priority areas: https://view.publitas.com/palebluedot/skokie-ground-cover-heat-island-and-carbon-sequestration-study/
GS 2- 1
GS 2: Replace 8% of turf community-wide with alternative natives or other plants or reduce maintenance cycles that benefit pollinators and increase stormwater benefits by 2030.
Update the Village's weed ordinance to allow for converting traditional lawns to pollinator-friendly gardens that include food gardens, rain gardens, wildflowers, clover, or native grasses to slow the collapse of the area's bee population.
GS 2- 2
Train staff on how to identify common native plants and educate them on the importance of native plantings. Increase the use of native plants in landscaping at Village-owned and park district-owned properties unless a data-driven case can be made that such use is not appropriate.
GS 2- 3
Support the planting of shade and water-absorbing trees and replace turf landscaping with native prairie, wild flower, and savanna plantings. If turfgrass is the best fit for the location, use varieties that require less water and maintenance when appropriate. Create a list of native perennials, shrubs, and trees to help developers and homeowners.
1
GS 2- 4
Continue to implement a strong, integrated pest management program, reducing fertilizer use and eliminating pesticide use, and raise mowing height to 3.5-4" on Village-maintained turf. Use biochar and local compost in landscape beds when feasible. Electrify Village landscape equipment at end of useful life.
1
GS 2- 5
Invite the Beautification and Improvement Commission to develop a recognition program for properties that incorporate a significant amount of natives or sustainable landscaping.
1
GS 2- 6
Collaborate with Oakton Community College, parks, and school districts to provide and promote public education about the use of lawn chemicals, effects on waterways, and alternatives.
1
2
2
GS 2- 7
Reach out to the largest land owners in Skokie to encourage turf replacement projects and include in a revised Property Owner award program. 2
GS 2- 8
Conduct a park and Village facility turf analysis and conversion study to identify lesser maintenance turf and ground cover types, to determine native plant and pollinator restoration opportunities, and to establish a conversion master plan. Master plan should recommend a minimum amount of pollinator-friendly native plantings for all village-owned properties.
3
implementation.
GS 3- 1
GS 3: Reduce heat island effect through community-wide “dark” impervious surface coverage reduction by 5% from 28.5% to 23.5% (320 acres) by 2030 and 15% (960 acres) by 2040. Reductions should be prioritized in neighborhoods identified with higher heat island impacts.**
Update existing parking lot tree requirement to a performance-based ordinance that increases the amount of pavement to be shaded by trees, solar panels, or a green roof.
GS 3- 2
Develop a policy that requires all commercial and institutional development projects receiving Village funding, PUD approval, and/or Conditional Use Permitting to implement commercial-scale heat island mitigation strategies including cool surfaces, solar-friendly landscape shading strategies, impervious surface reduction, and breeze capture.
GS 3- 3
Explore ways to add or encourage rain gardens to Village-owned parking lots, park district parking lots, and private parking lots.
1
1
1
GS 3- 4
Develop educational and informational resources explaining the drivers and impacts of heat island and solutions which may offer multiple benefits for property owners and users to share with residents and businesses.
GS 3- 5
Create educational content such as video and website content to promote green roof technology through information on Skokie Public Library's green roof.
Explore strategies for reduction of parking pavement including:
GS 3- 6
• Reduction of requirement ratios in zoning ordinances and encourage use of “proof of parking” strategies to minimize initial parking construction.
• Community-wide stormwater fee based on a property’s permeable surface area and stormwater management efforts.
• Explore ways to incentivize commercial properties, schools, and religious congregations to share parking space.
1
2
2
GS
GS 3- 8
Research creation of a "Cool Roof"/"Cool pavement" pilot project to educate and exhibit heat island mitigation strategies and measure potential for effectiveness. Identify Village building with low solar PV prioritization/feasibility for inclusion as pilot project location. Alternatively, pilot program could be advertised for submission by Skokie residents, businesses, and neighborhoods for potential sites to be considered for pilot project selection. Preference should be given to sites serving low-income or at-risk communities with high heat island impact potential.
*Phasing shown in this plan is preliminary and may evolve through implementation.
** See Village of Skokie s Ground Cover Study for information on potential priority areas: https://view.publitas.com/palebluedot/skokie-ground-cover-heat-island-and-carbon-sequestration-study/
2
GS 4- 1
GS 4: Increase climate, flooding, and extreme heat resilience and biodiversity supportiveness of community’s parks and open spaces.
Share existing or develop information resources on tree species, reduced pesticide use, high-mow deck settings, and other beneficial green space practices. 1
GS 4- 2 Include resources for invasive species management on Village website. 1
GS 4- 3
Promote strategies that support biodiversity and ecosystem health such as "No-Mow-May" and "Leaf-them-aloneNovember." 1
GS 4- 4 Promote the use of green infrastructure such as bioswales, permeable pavement, and other pervious surfaces to reduce flood risk and use for Village projects when feasible. 2
GS 5: Increase connectivity, accessibility, and equity of community's parks and open spaces.
GS 5- 1
Enlist the Beautification and Improvement Commission to educate and incentivize property owners to plant pollinator or other native plants through a property award program. 1
GS 5- 2
Collaborate with parks to improve the ecological functionality and resiliency of parks and open space through green infrastructure, best practices for stormwater management, and increased plant diversity and pollinator-friendly habitats. 1
GS 5 3 Establish and effectively manage native-habitat corridors along trails, parks, and leased utility easement areas to restore 2


There is a strong relationship between human health and environmental health. From the air we breathe to the water we drink and use, life on Earth depends on the natural resources and the environment around us. Changes in climate, such as higher average temperatures and increased storm frequency and intensity, can intensify public health stressors.1 These impacts endanger public health and safety by affecting the natural systems we rely upon. As the climate continues to change, the risks to human health continue to grow.
In the same way local governments and the health care industry promote healthy behaviors such as eating right and exercising, agencies should recognize the relationship between climate action, environmental stewardship, and community health.
• Some populations, including aging adults, children, persons with disabilities, economically stressed, non-English speakers, homeless persons, and workers employed in climate-exposed jobs are particularly vulnerable to extreme weather, natural disasters, and the health, supply chain, and economic impacts of climate change. Many of these individuals also have limited access to the information, services, and resources needed to ensure resilience in the face of these impacts.
• Areas within the community with increased flood risk, air quality impacts, compromised tree canopy coverage, and older housing stock with insufficient air conditioning are vulnerable environments with heightened exposure to climate change risks and compromised capacity to adapt.
• Vulnerable populations are often disproportionately represented within the portions of communities with the greatest risks of climate impacts like flooding or micro-heat island effects. Meanwhile, they also frequently lack resources or opportunities to improve the resilience of their surroundings.
• Emergency, health, and safety resources or services may be affected by changing conditions, particularly those in high-risk areas
• Changes in patterns of demand for emergency and health care services as a result of climate change, including changes in the type, frequency, or location of emergency services required
• Impacts of extreme events that prevent emergency personnel from quickly and safely reaching those in need, or limit operation of emergency systems
• Potential ways that climate change could impact the type of public health programming or outreach/education that is required to meet the needs of the community
HS 1: Assist the community’s populations who are vulnerable to air quality, extreme temperature, flooding, and power/infrastructure failure in preparing for and mitigating climate change impacts.
HS 2: Educate, engage, and empower the public on health and safety risks of climate change impacts.
HS 3: Ensure that the Village's mission-critical, emergency services, and health care facilities are prepared for impacts of air quality, extreme heat, and cold, flooding, and power/infrastructure failure.
HS 4: Strengthen community response capacity and social support networks for populations who are vulnerable to air quality, extreme temperature, flooding, and power/infrastructure failure impacts.
The detailed actions on the following pages are anticipated to be initiated in phases: phase 1 within 1-2 years, phase 2 within 2-5 years, and phase 3 within 3-7 years of plan approval. Phasing shown in this plan is preliminary and may evolve through implementation.

The following are detailed items that could be completed in order to carry out the vision and strategies of this sector. This menu of actions will be considered and prioritized into annual workplans to be developed by Village staff. See Section 11 Implementation, cross-cutting action CC 1-1 for more information on the annual workplan recommendation.
HS 1- 1
HS 1: Assist the community’s populations who are vulnerable to air quality, extreme temperature, flooding, and power/infrastructure failure in preparing for and mitigating climate change impacts.
Continue to provide information to the community regarding cooling centers to ensure vulnerable residents are aware of these services, including direct messaging at community facilities and through health providers, translated to the community’s top non-English languages. Cooling center locations should be located to maximize accessibility by vulnerable populations, particularly those with limited mobility access, and provided with permanent signage.
HS 1- 2
Make emergency communications available in multiple languages and platforms. The community’s top non-English languages should be addressed in the multiple-language communication plan. Platforms used should focus specifically on reaching the community’s top vulnerable populations identified in the Village's Climate Vulnerability Assessment.
1
HS 1- 3
Conduct climate change impacts and adaptation training, including training to recognize and respond to physical and behavioral signs of heat-related illness, for law enforcement, fire, and other Village staff working outdoors.
1
HS 1- 4
Establish a resilient home-inspection referral list to provide voluntary on-site home reviews to identify possible resilience improvements such as flood mitigation strategies, improved weatherization, vegetative shading, etc. Explore a partnership with other agencies including Cook County, ComEd, and local schools.
1
HS 1- 5
Research the development of a transportation-assistance program for individuals without access to vehicles, such as providing travel vouchers to vulnerable individuals to use during extreme weather or extreme heat emergencies. Explore partners and funding options for program implementation.
2
HS 1- 6
Collaborate with providers and others to improve awareness of the potential mental health impacts of climate change, signs to watch for, and available supportive resources.
2
2
HS 2- 1
HS 2: Educate, engage, and empower the public on health and safety risks of climate change impacts.
Provide education and resources about climate risks to the public, especially those most vulnerable to potential impacts of high-heat and extreme weather. Include an Emergency Response Toolkit offering tips and suggestions for residents to increase their emergency preparedness, and increase awareness of Village and other alert systems.
HS 2- 2
Establish a communication campaign in alignment with the American Public Health Association Policy Number: 201711 and educate the public about the hazards of air pollution, including indoor air quality, and the steps individuals can take such as reducing and eliminating fossil fuel use, and available resources to reduce their exposure. Communication campaign to include translation of education and resource materials into the community’s top non-English languages, and shared via communication platforms typically relied upon for information by those populations.
1
HS 2- 3
Develop and deploy early-warning response and community-alert plans and systems to notify residents and businesses, especially those most vulnerable, of poor air quality days, extreme weather events, extreme temperature events, potential energy and communication infrastructure failure, or other events which may pose health risks. Communication plan to include pathways for when community power and communication systems are non-functional.
HS 3: Ensure that the Village's mission-critical, emergency services, and health care facilities are prepared for impacts of air quality, extreme heat, and cold, flooding, and power/infrastructure failure.
1
HS 3- 1
Establish inter-governmental agreements on mutual aid with current community partners such as school districts, park district, and Oakton Community College.
2
HS 3- 2
Strengthen emergency management capacity to prepare for and respond to the impacts of climate change. The Village should prioritize capacity improvements such as training and equipment to address risks exacerbated by climate change. Emergency management should be equipped to address the possibility of multiple emergencies at the same time, such as the combination of wildfire smoke coupled with extreme heat and local brush fires.
1
HS 3- 3
Support response to severe storm and flooding event debris management by including optional, per-unit pricing for debris management into Village's condo refuse and tree pruning and removal contracts.
1
2
HS 3- 4
Prepare for public buildings to be used in different ways, both in lower-impact ways, such as seniors using the library to cool down during hot days, and as safe-havens during acute emergencies. Integrate these concepts in all Village facility design and renovation design processes and considerations.
*Phasing shown in this plan is preliminary and may evolve through implementation.
2
HS 4- 1
HS 4: Strengthen community response capacity and social support networks for populations who are vulnerable to air quality, extreme temperature, flooding, and power/infrastructure failure impacts.
Evaluate outreach responsibilities and/or volunteer network to support resilience contact list outreach implementation in times of distress such as during/after extreme weather events, particularly when they involve grid disruption.
1
HS 4- 2
Review and evaluate community networks and connections for those who require special attention or assistance during or after extreme weather events (heat, cold, and heavy precipitation). Develop a Resilience Contact List for the Village and any community partners, updated annually, to be utilized during times of distress.
1
Promote equity in hazard mitigation, emergency response, and recovery activities. Consider populations most vulnerable to weather related emergencies in all plans, including evacuation routes, transportation for vulnerable population groups, 2


Sustainability and the economy are inexorably linked. Left unabated, the impacts of human-made climate change through the end of this century will cost the United States billions of dollars. According to a 2019 study by two EPA scientists, the difference in economic impact between the mid-range climate model (RPC6) and the high range climate model (RPC8.5) may account for as much as $224 billion in economic impact annually by 2090.17
According to a 2019 World Bank report on trends in carbon pricing, a carbon price range of $40-$80 per ton is necessary as of 2020 to reach the goals set by the 2015 Paris Agreement, while other studies have placed the full cost of carbon at $200-$400 per ton. In Skokie, every 1% in community-wide emissions reductions could generate over $980,000 in social community benefits alone, not including other economic savings or revenue generation.
Investments in energy efficiency, public transportation, renewable energy, and many other climate action strategies ultimately result in cost savings for community businesses and residents.19,20,22 These savings contribute to an increase in the quality of life for residents and will largely be spent within the community on goods and services, providing indirect and induced economic development potential for the community.
Rather than weakening the economy, sustainability and climate action can support economic development.21 Transitioning away from fossil fuel use, improvements to public transit systems, and growth of local food industries are all, in part, a transition to local energy and labor sources.
These transitions represent opportunities for communities to reduce the community wealth that is being exported and increase the percentage of that wealth remaining in the community in the form of local jobs. Additionally, many of the non-sustainable industries such as fossil fuel tend to employ fewer people per dollar spent than their sustainable counterparts such as the renewable energy industry. The end result is that transitioning our economy from a less sustainable focus to an increased environmental sustainability focus can support a reduction in environmental resource utilization combined with potential jobs growth.23
• Impacts of current climate conditions that affect the community’s economy and resources that drive it, and consideration of how local business and industry might be affected if these patterns change
• Potential for climate-driven changes in either the supply or demand for products or services that are crucial to the local economy
• Impacts of action to address climate change – or inaction – on various aspects of the local economy, including direct costs or savings, jobs creation/employment rates, and vitality of the downtown areas and local businesses
EC 1: Develop the economic potential related to sustainability and climate action.
EC 2: Improve access to training related to sustainable economy fields to improve an equitable workforce.
EC 3: Develop and implement an education plan to support more climateimpact resilience in businesses.
EC 4: Promote sustainable businesses who are Green America or B Corp certified.
The detailed actions on the following pages are anticipated to be initiated in phases: phase 1 within 1-2 years, phase 2 within 2-5 years, and phase 3 within 3-7 years of plan approval. Phasing shown in this plan is preliminary and may evolve through implementation.


Electricians
Renewable energy designers + installers
Energy analyst
Energy law
Grid integration engineering
Equipment manufacturers
Sales

Energy efficiency consultants
Energy auditors
Heating and air conditioning installers
Contractors (insulation, windows, roofing, etc)
Appliance and equipment manufacturers and installers
Sales

Infrastructure contractors
Transit drivers
Electric vehicle sales
Electric vehicle equipment installers
Electricians + engineers
Bike/scooter sales + repair
Transportation planners

The following are detailed items that could be completed in order to carry out the vision and strategies of this sector. This menu of actions will be considered and prioritized into annual workplans to be developed by Village staff. See Section 11 Implementation, cross-cutting action CC 1-1 for more information on the annual workplan recommendation.
EC 1- 1 Consider the current Economic Development Commission (EDC), SEAC and/or establishing a Green Economy Task Force with business, environmental organizations, and Village staff to support the evaluation and promotion of green economy potential in Skokie and the region.
EC 1- 2
Enlist the existing EDC, SEAC or a Green Economy Task Force to conduct a study to identify economic opportunities possible through the successful implementation of the Environmental Sustainability Plan and achievement of its goals, especially those which can provide opportunity for the community’s vulnerable populations.
EC 1- 3
Strengthen public-private economic communications in support of climate resilience, climate economic opportunities, and the goals of this plan. Effort should focus particularly on communications with disadvantaged group businesses (minority-owned, veteran-owned, economically-disadvantaged, etc.) and small businesses. 2
EC 1- 4
Support climate resilience of local economy by preparing water, roads, utilities, and other public infrastructure for increased demands from climate change based on Skokie's Climate Risk and Vulnerability Assessment, Emergency Management Plan, and state climate change data and projections.
EC
EC 2- 2
Facilitate a meeting with High School District 219, Oakton Community College, the Skokie Chamber of Commerce, and other partners to explore and identify training needs and opportunities related to emerging jobs related to sustainability and the goals of this plan.
EC
EC 3: Develop and implement an education plan to support more climate-impact resilience in businesses.
with partners to assess and improve the resilience and redundancy in power supply, telecommunications, and broadband networks to protect commerce and public safety in the event of natural or manmade disasters.
Collaborate with the Skokie Chamber of Commerce (Chamber) and other business partners to explore the need, value, and potential of an online assessment of business’ vulnerability/resiliency. Assessment tool could include topics such as:
Available incentives or tax breaks
Zero waste improvements
Water
Work with Chamber, community businesses, and EDC to explore the creation of an incentivized “buy local” campaign to enhance resilience of small local businesses, particularly those with products, services, and operational policies in line with the goals of this plan.

The first few years after plan adoption are critical to its success. Establishing roles and identifying funding will help establish the implementation phase of the plan and ensure the community is on track to achieve its goals. This plan includes robust goals for significant GHG emission reductions and addressing climate resilience. This vision requires commitment and integration of the plan into Village operations, functions, and services. Ultimately successful implementation of this Environmental Sustainability Plan will require the support and commitment of Skokie residents and businesses.
Environmental sustainability is broad. Implementing it must be equally broad. Some actions will need to be led by the Village Board, Village departments, and/or the business community. In addition, there are steps that households and individuals can take to make an impact. Ultimately, achieving the visionary goals outlined in this plan will require engagement and a sense of responsibility not only by the Village of Skokie leadership and staff, but by the community as well. It is critical for all to remain engaged and active, advancing and advocating for actions they believe are important.
It is not possible at the beginning to have all of the detailed answers on a decade’s worth of actions. Both the Environmental Sustainability Plan and its implementation are a journey. Although the actions outlined in the plan are designed to demonstrate a pathway for Skokie to achieve its sustainability goals, there is much uncertainty in predicting future technologies, costs, and regulations. For this reason, a full cost-benefit analysis of every action is not possible at this time.
Refinement of detailed actions is anticipated and will occur while they are implemented. Accordingly, actions are designed to provide guidance on intent but flexibility on details and design. Actions which may modify/create policy or ordinances or which may have Village expenses incurred should be anticipated to go through the appropriate Village approval process.
The following are the proposed Cross-Cutting Actions which are foundational recommendations that apply to multiple sectors. The implementation plan includes a “Phase” indicator:
Phase 1: action initiation anticipated within 1-2 years of plan approval
Phase 2 action initiation anticipated within 2-5 years of plan approval
Phase 3 within 3-7 years of plan approval
Phasing shown is preliminary and may evolve through implementation.
The following are likely the phase 1 actions with the greatest impact in each sector GHG reduction or climate adaptation potential or those which help to establish a solid foundation for later actions included in the Environmental Sustainability Plan. These actions represent a “Quick Start” sub-list of highly impactful actions for community-wide and municipal operations.

TM 1- 1
Continue seeking funding for a new Transportation Plan. When funded, that plan will update additional documents and policies accordingly and in support of the goals of this Environmental Sustainability Plan, including the Village's comprehensive plan and non-motorized transportation management.
In addition to these actions, it is recommended that the Village simultaneously pursue the actions focused on establishing plan implementation structure by building internal capacity, facilitating external support, and establishing sustainable financing. These known as the “Cross-Cutting” strategies (see Section 11 Implementation).

BE 1- 1 Community Development shall review for adoption of the most recent International Energy Conservation Code as well as the International Green Building Code.
TM 2- 1
Promote public transportation options to Village employees, and implement a pre-tax transit benefit program for Village employees. Educate other public agencies, higher education institutions, and private-sector employees about the program and encourage them to adopt similar strategies. Goal: 15 new organizations establishing programs annually.
TM 3- 1
Achieve designation of "EV Ready Community" through the Metropolitan Mayors Caucus.
BE 1- 3
TM 7- 1
Conduct a Municipal Fleet Inventory and EV Transition Implementation Plan. Effort to identify opportunities for electrifying, right-sizing, and improving overall efficiency of vehicles to meet CAP Goals. Include implementation recommendations to incorporate EV's through right-timing purchases with a planned vehicle-replacement schedule.

LH 1- 3
Study ability to construct accessory dwelling units (ADU's) in Skokie and potential to increase rental and home ownership opportunities compatible with both established neighborhoods and new development. Specific consideration should be given to utility service placement and parking requirements.
BE 4- 1
Through SEAC, ComEd, Nicor, and community partners like Go Green Skokie, create a residential energy efficiency challenge promoting and expanding residential and multi-family energy efficiency audit and upgrade program similar to ComEd's "Home Energy assessments". Collect communication materials to share with residents. Develop a plan to drive residents to action; Identify other community groups that can build capacity for effective outreach; publicly recognize annual challenge "winners" with successful energy reduction achievements. Track annual progress; Combine efforts with increased renewable energy purchases and installations. Goal: 220 households annually.
Promote existing local residential, commercial, and institutional programs through Grow Solar Chicagoland and the Citizens Utility Board (CUB) that offer group purchasing to lower the cost of solar installations. Goal: 150 households and 1.1% of commercial/industrial sector electrical consumption "solarized" annually.
BE 7- 1
Conduct a Village Facilities Energy Audit on all buildings within the next 3 years targeting energy efficiency meeting or exceeding goals of this plan. Use results from Village Facilities Energy Audit to prioritize Village Facilities Capital Improvement Plans (CIPS) and maintenance improvements. Plan to establish a timeline for implementation all improvements within 5 years of completion of energy audits.

WM 1- 4
Reduce solid waste collection frequency to once weekly for single family households.
WM 2- 1
Require all new commercial and multi-family construction to provide recycling and composting services.

GS 1- 3

W 1- 4
Finalize analysis of leaks in drinking water distribution system, implement findings Goal: reduce water leaks by 50% by 2030.
W 2- 1
Develop green infrastructure implementation goals and integrate with Cook County Multi-Jurisdictional Hazard Mitigation Plan and seek funding opportunities through FEMA BRIC Grant Program. Include a focus on equity in implementation.

LF 1- 2
Collaborate with schools and park district to establish a “Grow Skokie” program increasing community garden plots and establishing a “market garden” concept supporting garden and urban agriculture training and internship opportunities for youth. Develop program to work with local restaurants, food shelves, or others working directly with food insecure individuals in the community for distribution of food grown in the “market garden.” Explore potential of partnering with Oakton Community College.
GS 3- 1

Establish a tree planting plan to meet the goals of this plan. Prioritize tree replacement programming in neighborhoods based on factors outlined in the Village's Ground Cover study including those with low-income households, vulnerable populations, street and boulevards with less than 30% sidewalk/curb length shade coverage. Include a focus on increasing shade trees areas where people congregate (picnic areas, bus shelters, etc.). See Village's 2022 Ground Cover, Tree Canopy, and Carbon Sequestration Study.
Update existing parking lot tree requirement to a performance based ordinance that increases the amount of pavement to be shaded by trees, solar panels, or a green roof.
HS 3- 2
Strengthen emergency management capacity to prepare for and respond to the impacts of climate change. The Village should prioritize capacity improvements such as training and equipment to address risks exacerbated by climate change. Emergency management should be equipped to address the possibility of multiple emergencies at the same time, such as the combination of wildfire smoke coupled with extreme heat and local brush fires.
HS 4- 1
LF 3- 1
Conduct a detailed Food Security Assessment to determine food insecurity conditions within the community, areas with limited access to full service grocery stores and markets (particularly within areas of higher vulnerable populations), identify areas within the community for improvement, and establish detailed strategies to increase food security community-wide.

Evaluate outreach responsibilities and/or volunteer network to support resilience contact list outreach implementation during times of distress such as during/after extreme weather events, particularly when they involve grid disruption.
EC 1- 2
The existing Economic Development Commission, SEAC or a Green Economy Task Force to conduct a study to identify economic opportunities possible through the successful implementation of the Environmental Sustainability Plan and achievement of its goals, especially those which can provide opportunity for the community’s vulnerable populations.
EC 3- 1
Collaborate with partners to assess and improve the resilience and redundancy in power supply, telecommunications, and broadband networks to protect commerce and public safety in the event of natural or manmade disasters.
This section includes Cross-Cutting Actions which are foundational recommendations that apply to multiple Sectors. The following actions support the long-range implementation of the Environmental Sustainability Plan including: Building Internal Capacity, External Support, and Funding.
CC 1: Continue to build internal capacity for support of environmental sustainability plan implementation.
CC 1- 1
The Village Manager will work with staff to develop annual priorities and implementation workplans that specify implementation tasks, estimated necessary funding and staffing resources needed to support on-going plan implementation. Progress updates will be reported annually to SEAC and Village Board.
All
CC 1- 2
Establish clear guidance and direction for the participation in and support of the Environmental Sustainability Plan implementation actions by all Village of Skokie departments. Encourage continuing education of municipal staff relevant to the Environmental Sustainability Plan, for example, encouraging traffic planners to earn continuing education credits related to bicycle infrastructure.
Fund and support sustainability staffing required to:
•Coordinate, facilitate, or support communication and outreach efforts associated with the sustainability plan.
•Participate in technical resource programs as they are available through county, regional, state, federal, and non-profit provider partners.
All
CC 1- 3
•Support Village of Skokie department managers and staff as they implement plan actions within their service area or area of expertise.
•Convene the internal Village of Skokie Sustainability Team (see CC1-4).
•Ensure the establishment and maintenance of a Village of Skokie Sustainability webpage supporting sustainability resources for the community.
•Coordinate and organize volunteer groups and events.
•Engage Village boards and commissions to ensure the sustainability plan is integrated into their work plans.
•Seek funding opportunities.
CC 1- 4
CC 1- 5
All
CC 1- 6
Establish a Village "Sustainability Team" comprised of staff representatives from all key Village departments. The Sustainability Team should meet regularly to support the initial and on-going prioritization and implementation of annual implementation actions and projects and to support reporting and progress updates. Sustainability Team to request resources, guidance, or assistance, if needed, to achieve planned progress. All
Establish and implement a policy to review existing and future Village of Skokie policy and ordinance changes as well as building and zoning variance requests against the goals, strategies, and actions of this Environmental Sustainability Plan to ensure alignment of changes with this plan. All
Review Environmental Sustainability Plan implementation progress and impacts on a regular basis (1-2 year cycle). Periodically updating the community-wide and municipal operations GHG inventory will be considered. Strategies and actions should be reviewed for implementation progress and for continued appropriateness. Based on the review, adjust, add, and remove detailed Environmental Sustainability Plan actions as appropriate.
*Phasing shown in this plan is preliminary and may evolve through implementation.
CC 2- 1
CC 2: Facilitate external support needed for Environmental Sustainability Plan implementation.
Identify SEAC to act as a primary community member body to support the implementation of the Environmental Sustainability Plan. Commission’s annual work plans should include support of the implementation of the Plan; supporting Village staff in any relevant departments; receiving updates on Village sustainability projects and progress; being provided with opportunity to comment on identification of annual Plan implementation priorities and projects; and providing input on plan adjustments as needed.
Establish a coordinated communication and education campaign supporting the communication and educational needs of each of the Plan sections. The campaign should also look to help community members:
•Understand climate change in general, anticipated impacts, and the function and importance of implementing a Sustainability Plan.
CC 2- 2
•Understand why change at the individual, community, Village, and business level needs to occur.
•The role of individuals, households, and businesses in making change.
•How to make those changes correctly.
•What the benefit/incentive to them might be; for example, articulating that switching to solar energy and or an electric bus fleet might help reduce costs.
All
CC 2- 3
CC 3- 1
CC 3- 2
CC 3- 3
All
CC 3- 4
Work with neighboring communities to share sustainability goals and action items to increase the likelihood that positive regional impacts can be achieved. All
CC 3: Establish sustainable financing and maintain appropriate funding to support the Village’ s Sustainability Plan implementation.
Identify a budget necessary to support projects on an annual basis as per annual implementation plans. All
Utilize no-cost technical assistance offerings as available. All
Consider establishing a policy that requires Village infrastructure projects and capital budgets to incorporate climate risk and vulnerability analysis and adaptation plans to ensure that future spending contributes to resilience and achieving this plan's goals. 1
Consider establishing a policy that accounts for all energy efficiency and renewable energy operational cost savings of Village buildings and fleets. All savings to be invested into a Environmental Sustainability Fund as one source of financing for the Village's environmental sustainability efforts. 1
CC 3- 5 Explore a policy that utility Franchise Fee Income be used as a funding source for sustainability initiatives. 1
CC 3- 6
Explore adopting a tax financing mechanism such as a "resilience penny" property tax increase of $0.01 per $100 of assessed value and dedicate additional funds for climate mitigation and climate adaptation strategies. Funds may be used directly, or may be used as a repayment source for a bond issue. 1
*Phasing shown in this plan is preliminary and may evolve through implementation.

Click here to return to TOC
Green Bonds Specifically targeted for funding environmentally and socially responsible projects in areas such as renewable energy, energy efficiency, clean transportation or responsible waste management.
This memo is intended to provide a starting point for the Village of Skokie in identifying funding solutions for implementation of the Environmental Sustainability Plan initiatives. The optimal funding approach appropriate will fit well within the Village’s existing revenue structure, resources, political opportunities, and limitations.
The following is an overview of a range of funding strategies including bonding, tax, municipal fee structures, state and federal grants, and strategies supporting the private sector.
Where: District of Columbia Water and Sewer Authority along with institutional investors Goldman Sachs Urban Investment Group and Calvert Foundation,
When: 2014
What: Issued a tax-exempt Environmental Impact Bond that utilizes a performance-based contract between a public entity and the private sector where payment is based on performance of Green Infrastructure projects funded. The success of this program led to an expansion of their green bonds program in 2015 and 2016.
Climate Bonds Use-of-proceeds bonds where the issuer promise to the investors that all the raised funds will only go to specified climate-related adaptation or mitigation programs and assets.7
Where: City of Hampton, VA along with Quantified Ventures in partnership with the Chesapeake Bay Foundation
When: 2020
What: Provided the City with a $12 million bond to mitigate chronic flooding in the city. The bond is attached to three projects that will add storage capacity to alleviate the volume of stormwater in low- to moderate income communities.
https://www.worldbank.org/en/ news/feature/2021/12/08/whatyou-need-to-know-about-ifc-s-green -bonds
https://www.dcwater.com/whatsgoing-on/news/dc-waterannounces-successful-sale-350million-green-century-bonds
https://www.climatebonds.net/ files/files/Green%20City% 20Playbook.pdf
https://hampton.gov/ CivicAlerts.aspx?
AID=4714&ARC=9297
Resiliency Bonds
Rebate structure that funds risk reduction by linking insurance premiums to resilience projects. These bonds create incentives for cities to invest in resilience, reducing human and financial costs of catastrophes as a result.
Where: Various cities including the City of Norfolk, VA
When: 2015
What: The RE.invest initiative has partnered with a number of cities on a range of infrastructure projects to provide flood protection, using catastrophe modeling to estimate risk reduction for bond issuance.
https://gca.org/what-are-resiliencebonds-and-how-can-they-protect-us -against-climate-crises/
https://www.refocuspartners.com/ wp-content/uploads/pdf/ RE.invest_Norfolk-City-Report.pdf
Levy additional costs on undesired activities or consumption then reinvest funds in policy objectives
Excise Tax on Fuel
In lieu of a carbon tax, if not politically feasible, a fuel tax can also help raise funds for climate actions with the right support. This tax can be levied on energy providers which will likely pass onto consumers, providing additional incentive to reduce energy use and enhance energy savings potential of projects.
Where: City of Portland, OR
When: 2019
What: Created specific retail tax on larger retailers
Where: Montgomery County, MD
When: 2022
What: Raised a fuel tax on any person or entity transmitting or distributing energy into the County, including delivered fuels and electricity. While the County currently uses this funding for the General Fund (accounts for over 4% of revenue annually), a pending bill would use a small but significant portion of it towards climate actions.
https://www.portland.gov/revenue/ ces
https:// www.montgomerycountymd.gov/ finance/taxes/excise.html
Carbon Tax Add a cost through the City’s own utility to gas delivery and consumption, and allocate those costs to a fund for climate action. Such a tax could also be applicable across other Municipality energy consumption (buildings and transportation) for similar purposes, or extended to a subsect of private consumers such as industry or other high uses.
The EID is operated under a Board with bonding authority, providing a revenue option for specified public purpose projects. Such a district and bonding authority could be created for specific climate action activities, particularly those projects that align with bonded capital, i.e., infrastructure or revenue-generating projects. EIDs may be used to enter into contracts, to buy or lease energy facilities, to increase energy efficiency, and to make it easier and cheaper for energy efficiency and renewable energy businesses to operate in the community
Where: British Columbia, CA
When: 2008
What: Carbon tax applies to the purchase and use of fossil fuels and covers approximately 70% of provincial greenhouse gas emissions.
https://www2.gov.bc.ca/assets/gov/ taxes/sales-taxes/publications/mft-ct -005-tax-rates-fuels.pdf
Where: Bridgeport: CT
Where: 2020
What: Established an Energy Improvement District (EID) to promote the planning, development, and funding of energy-related development.
https://www.bridgeportct.gov/ content/341307/347097/347109.asp x
Establish a policy to apply all future funds generated from Tax Increment Funds to initiatives aligned with the sustainability or climate plan. For municipalities with existing Tax Increment Funds set to sunset the funds generated by as they terminate may be used for initiatives aligning with the municipality’s plan decreasing the need to increase rates elsewhere.
Adopt a property tax increase of $.01 per $100 assessed value dedicated for sustainability and resilience efforts – a “resilience penny” increase. The revenue can be used to directly fund initiatives, or as a repayment source for bond issues. This strategy may be particularly well suited for communities which have not increased property tax rates in many years as it reflects the increased costs and demands placed on municipalities due to emerging resilience needs.
The Village's revenue profile is diverse, with nearly 49% of the General Fund (Operating Budget) revenues come from sources like sales, income, food and beverage, and hotel taxes. The Village’ s total FY23 General Fund revenues are $65,199,046. Included in this for fiscal year 2023 is a Capital Improvement Project (CIP) budget of $28,253,060.*
A number of the Village’s 2023 CIP projects include aspects which already include aspects related to the initiatives and goals of the Environmental Sustainability Plan. To the extent possible, starting with the largest expenditures, all investments should be evaluated and re-oriented to ensure they serve the Village’s sustainability policy goals. Future budgeting policy should incorporate a mechanism or review within the budgeting process to support the alignment of new capital budgets with the Village’s sustainability initiatives.
Where: Miami Beach, FL
Where: 2022
What: Establish policy to use $100 million generated by a Tax Increment Financing (TIF) district that is set to sunset in 2022 for underground stormwater projects.
Where: Norfolk, VA
When: 2015
What: City adopted a $0.01 increase in property tax that generates about $1.8 million a year applied to City sustainability and resilience initiatives.
https://www.miamibeachfl.gov/wp
shorturl.at/hoBRU
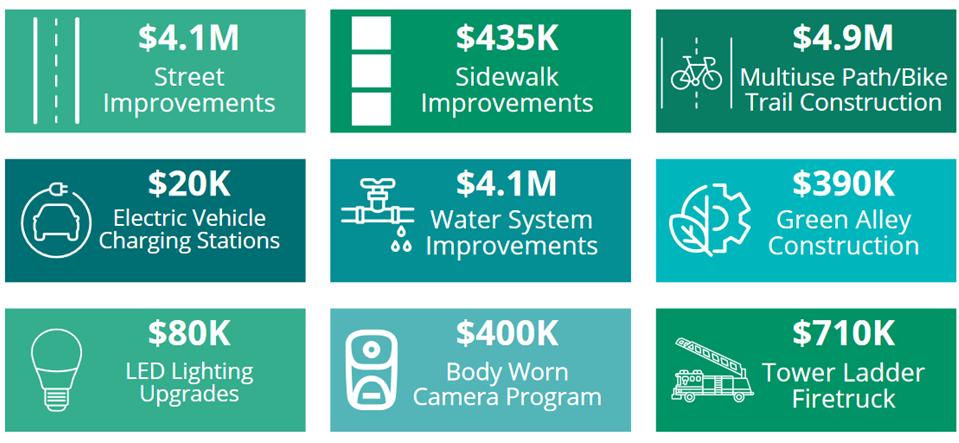
Depending on tax powers of the Municipality, a separate tax or fee could be levied on specific uses such as stormwater fees. The level of fees could be adjusted, or a temporary fee added, to fund additional climate actions - such as providing stormwater credits for installation of green infrastructure, green roofs, etc. This may involve a more aggressive application for state stormwater permits and fee collection capability.
Where: City of Minneapolis, MN
When: 2005
What: Created stormwater utility fee and stormwater credit system.
A Carbon Fund Ordinance establishes a Carbon Fee to be charged to all development projects. A municipality may make exceptions to the fund as appropriate for the community (for example, exemptions for single family residential alterations, new Accessory Dwelling Units, temporary buildings, and/or building area that is not used as conditioned space). The municipality may also establish the fund on a "sliding scale" providing for discounts and credits for projects meeting the community's energy goals. The goal of a Carbon Fund Ordinance is to encourage the implementation of renewable energy and/or energy efficiency in development projects. The money collected from the Carbon Fund Fee can then be used for community-wide greenhouse gas reduction projects.
Where: City of Watsonvill, CA
When: 2014
What: Carbon Fee charged to all development projects with proceeds used to support communit-wide actions.
https://www.minneapolismn.gov/ resident-services/utility-services/ stormwater/
https://www.minneapolismn.gov/ resident-services/utility-services/ stormwater/residential-stormwatercredits/
https:// www.cityofwatsonville.org/1765/ Carbon-Fund-Ordinance
Establish a policy to expend franchise fee revenue on projects and initiatives associated with the municipality's sustainability or climate plan. Policy may also include an incremental increase in the franchise fee in support of the increased renewable energy and energy efficiency initiatives of the municipality. Alternatively, some municipalities are able to use the franchise fee negotiation to directly leverage increased renewable energy service from the electric utility provider (see City of Ann Arbor example: shorturl.at/myHK1 )
Where: City of Minneapolis, MN
When: 2017
What: Increased its existing franchise fee on utility customers by 0.5 percent, directing the fee revenue toward initiatives to reduce energy bills and greenhouse gas emissions of the city’ s residents and businesses.
https://energynews.us/2017/09/12/ utility-fee-increase-in-minneapoliscould-help-fund-efficiency-outreach/
There are a number of state and federal funding opportunities that support sustainability, resilience, and climate initiatives for local governments. Many of the grant opportunities seek to directly fund relative strategies like improved energy efficiency, renewable energy, low/ no emission vehicle adoption and infrastructure, and climate resilience. In addition, a number of long-standing grants like those from the US Department of Transportation, or the US EPA Brownfields Grant do not fund sustainability and climate initiatives directly but can indirectly support these projects as the grant’s goals are well aligned.
Grant funding can often be used to support the establishment of a municipal program, resource, or even staffing position. Unlike municipal tax or fee structure strategies, however, grants do not provide a long-term or permanent funding solution. Consequently, grants may best be viewed as a project-specific funding source, or in conjunction with other funding strategies when supporting long-term initiatives.

In January 2021, President Biden signed Executive Order 14008 –Tackling the Climate Crisis at Home and Abroad. The executive order established Justice40 as a whole-of-government approach to grant funding. Through this initiative, grants from the federal government are guided to ensure 40% of benefits flow to disadvantaged communities. For communities with one or more area designated as qualifying for Justice40 consideration are likely to have improved competitiveness for grant awards.
According to the Climate and Economic Justice Screening Tool, the Village of Skokie may have portions of the community qualifying for Justice40 consideration. The tool, created by the White House Council on Environmental Quality, uses publicly-available, nationally-consistent datasets to identify disadvantaged communities. For a detailed description of the methodology used go here:
https://screeningtool.geoplatform.gov/en/methodology#4.22/42.84/-88.95
See the map to the right shows the areas designated as qualifying for this consideration in the Village of Skokie:
This review is intended to illustrate a few high profile and important recent funding laws that have or will be resulting in significant grant opportunities of which municipalities with sustainability and climate plans can take advantage. The grant examples illustrated here are far from exhaustive. We recommend the municipality subscribe to new grant opportunities through Grants.gov and review availability on a regular basis:
https://www.grants.gov/help/html/help/Connect/ SubscribeToAllNewOpportunities.htm
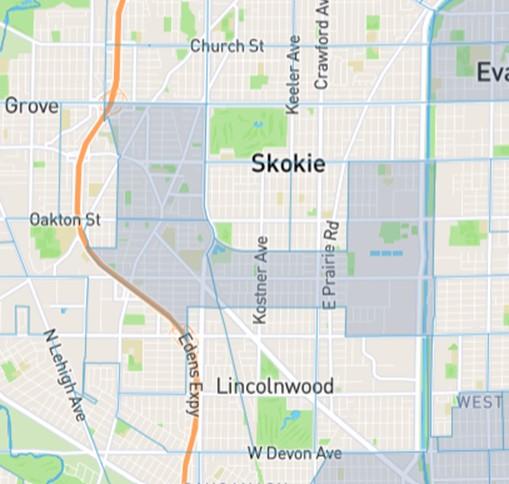
The Inflation Reduction Act (IRA) was signed into law by President Joe Biden on August 16, 2022. The law, as passed, authorizes $391 billion in spending on energy and climate change. The funding priorities include investment in climate change mitigation and adaptation, incentives for renewable energy installations and manufacturing, electric vehicle infrastructure, and home energy efficiency.
The law represents the largest investment into addressing climate change in United States history. According to several independent analyses, the law is projected to reduce 2030 U.S. greenhouse gas emissions to 40% below 2005 levels. The chart to the right shows the breakdown of the IRA spending budget (in $ billions):
IRA funds that will support municipal sustainability and climate action includes:
• $27 billion to fund the Greenhouse Gas Reduction Fund, a national green and to help municipalities start their own green banks.
• $250 million in grants and technical assistance to support municipalities in implementing their sustainable procurement initiatives.
• $5 billion for greenhouse gas air pollution reduction planning and implementation grants.
• $4.75 billion in competitive implementation grants awarded to states, air pollution control agencies, municipalities, or tribes to reduce overall air pollution .
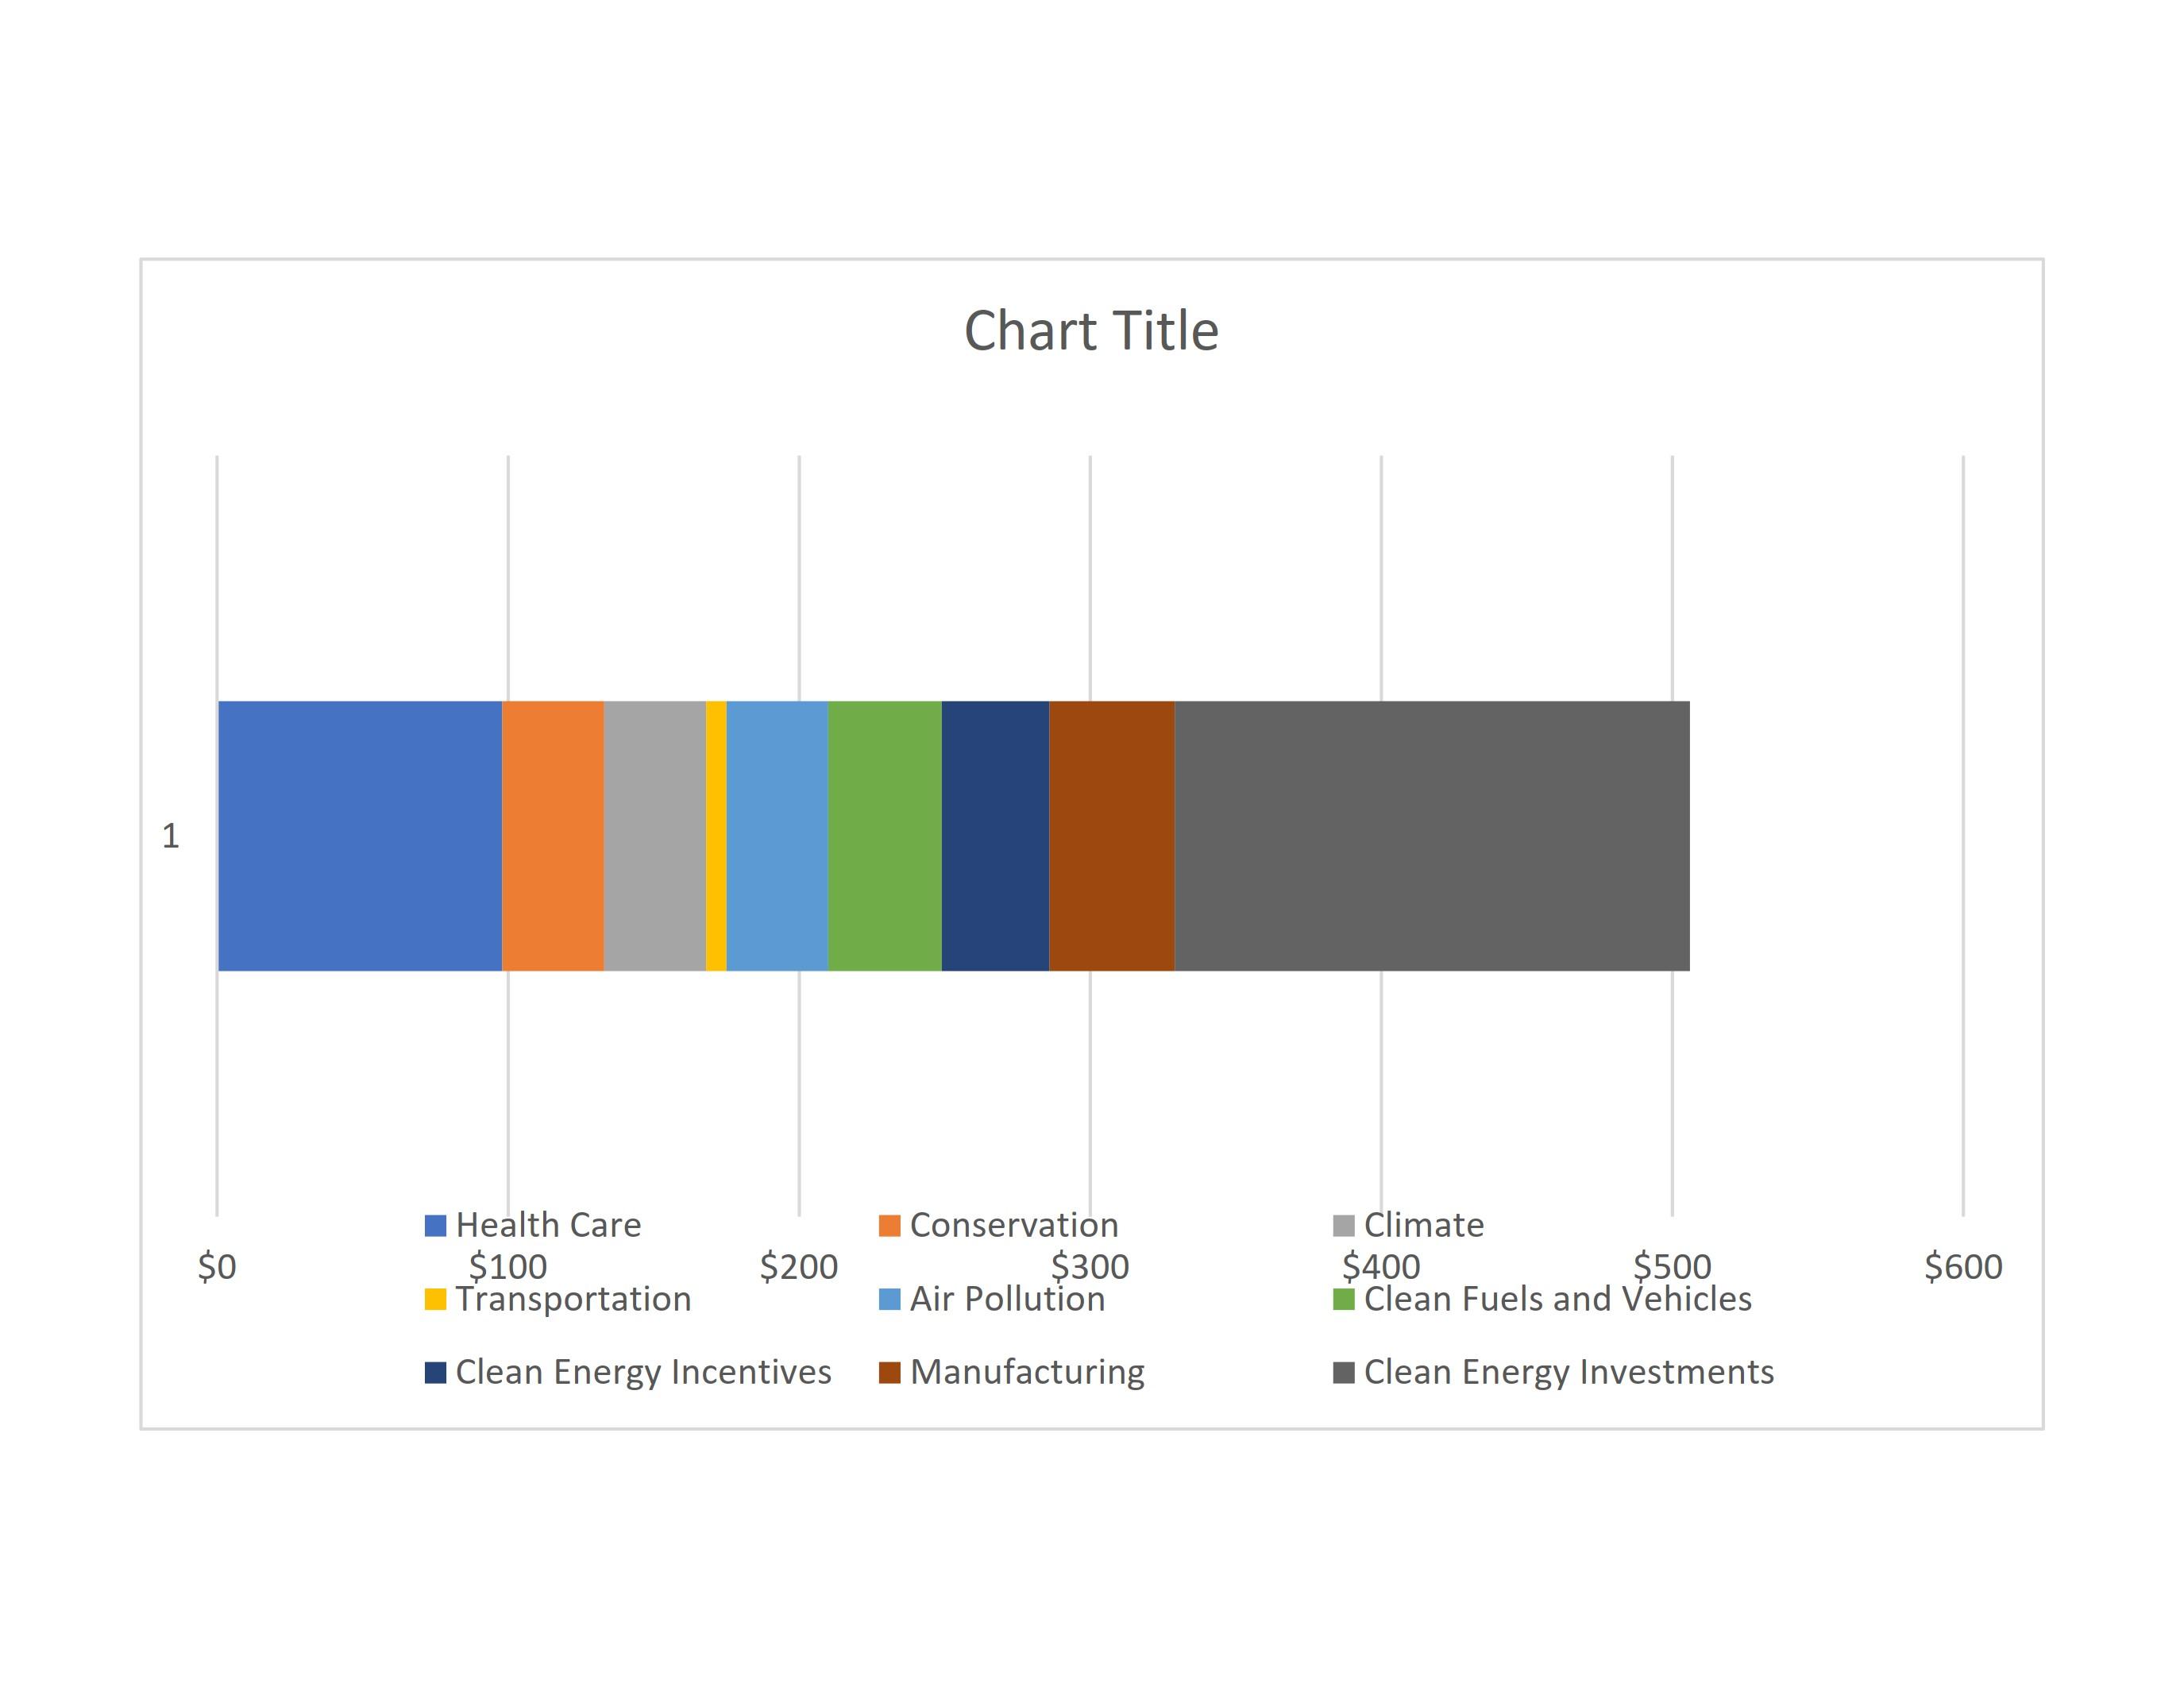
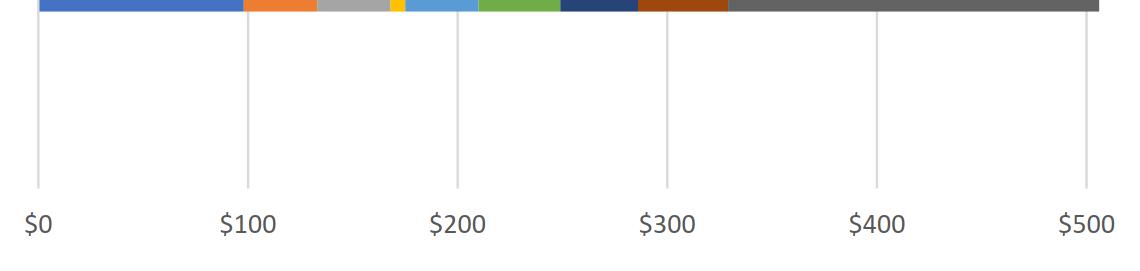
adoption of latest building energy codes.
• $1.8 billion in grants for construction projects to improve walkability, safety, and affordable transportation access.
• $1 billion in rural energy grants supporting infrastructure and providing technical assistance.
• $500 million in biofuel infrastructure and agriculture product market expansion grants.
The Infrastructure Investment and Jobs Act (IIJA), aka Bipartisan Infrastructure Law (BIL), was signed into law by President Biden on November 15, 2021. The law authorizes $1.2 trillion for transportation and infrastructure spending with $550 billion of that figure going toward “ new” investments and programs. Funding from the IIJA is expansive in its reach, addressing energy and power infrastructure, all modes of transportation, water, environmental remediation, public lands, broadband and resilience. Some of the new programs funded by the bill could provide the resources needed to address a variety of infrastructure needs at the local level. The chart to the right shows the breakdown of the $550 billion budgeted in the IIJA for new investments (in $billions):
Cities, towns and villages with a population of at least 35,000 are eligible to apply to and receive grants directly from the U.S. Department of Energy (DOE). Funding is also available from this grant through state managed programs. Municipal efforts this grant can support include:
• Developing and implementing an energy efficiency and conservation strategy
• Conducting residential and commercial building energy audits
• Establishing financial incentive programs for energy efficiency improvements
• Developing and implementing energy efficiency and conservation programs for buildings and facilities
• Developing and implementing programs to conserve energy used in transportation (e.g. flex time for employees; satellite work centers; zoning guidelines or requirements that promote energy efficient development; infrastructure, such as bike lanes, pathways and pedestrian walkways; and synchronized of traffic signals)
• Developing and implementing building codes and inspection services to promote building energy efficiency
• Developing, implementing and installing on or in any government building onsite renewable energy technology that generates electricity from renewable resources, such as solar and wind energy, fuel cells and biomass
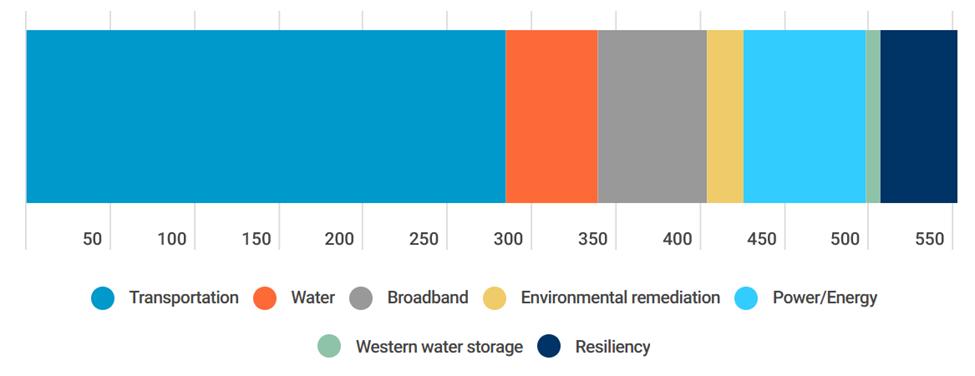
The Rebuilding American Infrastructure with Sustainability and Equity, or RAISE Discretionary Grant program, is one of several ways communities can secure funding for projects under the Bipartisan Infrastructure Law’ s competitive grant programs. The grant is available for planning and capital investments that support roads, bridges, transit, rail, ports, or intermodal transportation.
The SMART Grants Program funds purpose-driven innovation to build data and technology capacity and expertise for state, local, and tribal governments. The focus of the grant is to support demonstration projects focused on advanced smart community technologies and systems in order to improve transportation efficiency and safety. Eligible projects fall into a broad range of categories including Safety and reliability; equity and access; climate and resiliency; and technology integration. The grant has $100 million appropriated annually for fiscal years (FY) 2022-2026.
example grant uses:
https://www.transportation.gov/grants/smart/smart-illustrative-use-cases

The Surface Transportation Block Grant program (STBG) provides flexible funding that may be used by States and localities for projects to preserve and improve the conditions and performance on any federal-aid highway, bridge and tunnel projects on any public road, pedestrian and bicycle infrastructure, and transit capital projects, including intercity bus terminals.
The IIJA provides $2.5 billion for competitive grants. The U.S. Department of Transportation will administer the competitive grants for installation of electric vehicle charging infrastructure, hydrogen fueling infrastructure, propane fueling infrastructure, or natural gas fueling infrastructure that is directly related to the charging or fueling of a vehicle. The competitive grants are divided into two categories, Community Charging and Corridor Charging. Eligible entities include state or political subdivision of a state, metropolitan planning organization, local government, special purpose district or public authority with a transportation function, indian tribe, and territory. Grants available under this program include:
Community Grants providing $1.25 billion to install electric vehicle charging and alternative fuel in locations on public roads, schools, parks, and in publicly accessible parking facilities. These grants will prioritize rural areas, low-and moderate-income neighborhoods, and communities with low ratios of private parking, or high ratios of multiunit dwellings.
Corridor Grants providing $1.25 billion to deploy publicly available electric vehicle charging and hydrogen/propane/natural gas fueling infrastructure along designated alternative fuel corridors.
In the Village of Skokie, I-94 is a designated corridor.
To be eligible for funding, EV infrastructure under the NEVI Program and the competitive Corridor Charging Grant Program must be located on a designated Alternative Fuel Corridor.
In the Village of Skokie, I-94 is a designated corridor.
The Clean Energy Jobs Act (CEJA) is a comprehensive climate and energy bill that centers equity and puts Illinois on a track to achieve 100 percent renewable energy by 2050. The Act obligates the Commission to take various actions to implement new programs, initiatives and directives to further the state’s goals of transitioning the state to 100% clean energy; supporting a responsible transition away from carbon-intensive power generation; increasing public participation in regulatory matters; and encouraging further diversity and inclusion within the renewable energy industry. CEJA includes a number of funding approaches that may support municipal initiatives including:
Publicly funded green banks to spur investment for renewables, energy efficiency and other projects, especially in communities that have been underrepresented in the clean energy economy. The Illinois Climate Bank will blend public and private capital to fund the upfront cost of clean energy improvement projects across the state.
will focus on equitable lending and supporting clean energy projects in low income and marginalized communities
Jobs and Environmental Justice Grant Program. DCEO to create and administer a program that provides upfront capital to support the development of projects, businesses, community organizations, and jobs creating opportunity for historically disadvantaged populations, and to provide seed capital to support community ownership of renewable energy projects (including community solar). Annual funding: up to $34M.
The Illinois EPA Office of Energy announces a Notice of Funding Opportunity (NOFO) for availability of funds from the Energy Efficiency Trust Fund (EE Trust Fund). The EE Trust Fund was established to benefit residential electric customers through projects determined to promote energy efficiency in the State of Illinois. Funding is available to public housing authorities, units of local government (municipalities, counties, or townships), or nonprofit organizations for implementation of energy efficiency improvements in single or multi-family residential properties.
Illinois Department of Commerce and Economic Opportunity (DCEO)
Community Development Block Grant Program (CDBG)
Public Infrastructure -Improve public infrastructure and eliminate conditions detrimental to public health, safety, and public welfare Housing Rehabilitation Program - Improve housing by rehabilitating and retrofitting homes
Illinois Environmental Protection Agency (IEPA) Grants
Green Infrastructure Grant Opportunities - Provides funding opportunities for projects to construct green infrastructure best management practices (BMPs) that prevent, eliminate, or reduce water quality impairments by decreasing stormwater runoff into Illinois’ rivers, streams, and lakes. BMPs may be located on both public or private land
Nonpoint Source Grants - Available to local units of government and other organizations to protect water quality in Illinois. Projects must address water quality issues relating directly to nonpoint source pollution.
Driving a Cleaner Illinois - funding for various types of diesel emission reduction projects involving on-road vehicles, off-road equipment, and electric charging.
Illinois Department of Transportation (IDOT)
Safe Routes to Schools Program (SRTS) - SRTS uses a multidisciplinary approach to improve conditions for students who walk or bike to school. SRTS funds infrastructure and non-infrastructure improvements. Projects are funded at 80 percent with a 20 percent local match required.
Illinois Transportation Enhancement Program (ITEP) - Additional state funding is being set-aside for projects in the categories of bike and pedestrian facilities as well as the conversion of abandoned railroad corridors to trails. Local agencies may be eligible for state funds to be used towards their match of federal funds.
Illinois Emergency Management Agency (IEMA)/(FEMA)
Hazard Mitigation Assistance Grants (HMA)
Building Resilient Infrastructure and Communities (BRIC) - Support states, local communities, tribes and territories as they undertake hazard mitigation projects, reducing the risks they face from disasters and natural hazards.
Illinois Department of Natural Resources (IDNR)
Open Space Lands Acquisition and Development Grant -provides funding assistance to local government agencies for acquisition and/or development of land for public parks and open space.
Federal Land and Water Conservation Fund (LWCF) – federal grant program managed by State of Illinois that provides up to 50% funding assistance to eligible, local units of government to acquire land for public outdoor recreation areas.
Illinois Bicycle Path Program – Provides grants to eligible local governments for projects that develop or rehabilitate bike paths and/or acquire land for bike path development.
Strategies focusing on support of sustainability and climate action within the private sector increase the depth of action within a community by leveraging public and private investments.
Property Assessed Clean Energy (PACE) programs allow a municipality to lend its tax collection enforcement power to a public funder, giving them additional assurance when lending for a specified purpose or investment. PACE has been used for energy upgrades in buildings, transportation upgrades, and resiliency investments. PACE for Commercial entities is a more straightforward program. Residential programs come with additional challenges due to lien priority and secondary mortgage market.
Example Projects Links
Where: Columbus, OH
When: 2020
What: The latest draft of the City of Columbus Climate Action Plan proclaims the City will receive $250 million in average annual PACE investments to support its plan’s goals, and to establish a green bank by 2025.21
Supports energy project needs with projected cost savings, such as energy efficiency projects or where other fuel costs can be reduced. The fund will be replenished and used for additional projects over time, ideally, under an energy performance contract (working with a third party to manage energy use for savings). Funding will consider future reduced operations and maintenance, energy savings, insurance savings, and even certain non-energy benefits in the costsavings analysis to determine project eligibility. However, tangible financial savings are required to replenish the fund.
Green Bank Green banks help fund improvements in buildings and transportation, as well as other resiliency measures such as flood prevention, essentially anything that could be categorized as a public benefit in the legislation. Green banks can come in various forms from a department within the state or municipality, or a separate nonprofit.24
Where: Montpelier, VT
When: 2018
What: Provided $20,000 from its Reserve Fund as initial seed money for their Net Zero Revolving Loan Fund, with a $10,000 match from their partners with Efficiency Vermont. The City tracks savings from sustainability projects and reinvests part of those savings for subsequent projects and pays marginal costs of energy improvements within larger capital projects.
https://www.columbus.gov/ sustainable/cap
Where: Ann Arbor, MI
When: 2021
What: The City’s Climate Action Plan intends to create a $1 million loan loss reserve fund to provide credit enhancements for residents with lower credit scores and expand capacities to undertake energy efficiency and renewable energy improvements to low-income residents.
https://www.vtenergydashboard.org/ stories/montpelier-launches-revolving -loan-fund-for-energy-saving-projects
https://www.a2gov.org/departments/ sustainability/Documents/A2Zero% 20Climate%20Action%20Plan% 20_3.0.pdf
https://coalitionforgreencapital.com/
Once municipalities have reviewed these and other options they can identify, they should review the potential options to determine those which are likely to be the best fit for the community. Considerations the municipality may want to review potential strategies against include: Alignment with Need, Economic Impact, Community Acceptance, and Ability to Implement.
After the initial review of potential funding options, the municipality should model the funding potential of those strategies that best align with the community’s goals. Modeling should include anticipated revenue generated, capacity to support the need for which it is being raised, and potential cash flow impacts. This assessment may also benefit from a benchmarking review against peer communities to understand how the municipality’s resulting taxes or fees to users compare to the region.
Next the municipality should perform a policy and legal analysis of the potential strategy. This analysis should identify what, if any, authority considerations might need to be addressed. Policy impacts should be identified and recommended policy modifications should be drafted.
How much revenue is the strategy, or combination of strategies, likely to raise? Will it be enough to support the need?
Will the funding strategy, or combination of strategies, be capable of being sustained through the timeline required to support the need?
Might the strategy have an impact on local GDP (increase or decrease)?
Might the strategy leverage or attract investments or other economic benefits?
How might the strategy increase or decrease the community's competitiveness or attractiveness to residents or businesses?
Lastly, the municipality should engage the community. The level of engagement and communication needed will, of course, vary greatly depending on the strategy. The appropriate level of engagement should be identified and an engagement plan and schedule should be formed and implemented.
How visible is the magnitude of change related to the strategy?
Does the revenue approach create positive behavior change supporting plan goals, or have clear public benefit?
Would the resulting level of fees or expenses be significantly higher or lower than regional benchmarks?
Is the municipality able to be technically capable and ready to implement the strategy within the needed timeframe?
Does the strategy require other resources? If so, are those within the municipality's capacity?
Is the strategy compatible with the broader municipal strategic goals?
To support the Village of Skokie planning team members, the paleBLUEdot team assembled the Sustainability Baseline Study. This document provided a review of a wide range of community wide metrics, data, and comparisons against regional peer communities for each of the climate action plan sectors included in this report. The document also included preliminary sector specific draft strategic goal recommendations for the Environmental Sustainability Plan planning team to consider, discuss, and revise at the beginning of the planning team effort.
Click on the link below to access the document:
https://view.publitas.com/palebluedot/skokiesustainability-baseline-assessment/
At the beginning of the planning effort, the paleBLUEdot team developed a Climate Vulnerability Assessment for the Village of Skokie. The assessment included the identification of vulnerable populations within the community and possible impacts and risks associated with projected climate change for the region. paleBLUEdot mapped the vulnerable populations within the community as well as existing infrastructure and resources which may be capable of supporting climate adaptation strategies.
Click here to return to TOC
These assessments provided a basis for understanding vulnerabilities and resources which supported the decision making process needed for identifying and prioritizing climate adaptation measures to be included in the final plan. The Assessment focused on community vulnerabilities with a particular focus on climate vulnerable populations to ensure all populations benefit from proposed implementation measures.
Click on the link below to access the document:
https://view.publitas.com/palebluedot/skokieclimate-vulnerability-assessment-may-2022/
Using the Village’s previously completed 2020 GHG inventory, paleBLUEdot compiled a GHG emission business-as-usual forecast to project future community GHG emissions without further action. This effort provided the basis for the GHG emissions reduction modeling of strategies included in this report. The report included community-wide emissions comparisons against communities within the State and region.
Click on the link below to access the document:
https://view.publitas.com/palebluedot/skokiecommunity-greenhouse-gas-emissionsprojections/
paleBLUEdot conducted a baseline assessment of community-wide ground cover and tree canopy extent. The study identified ground cover conditions (grass, water, wetland, tree canopy) community-wide as well as by neighborhood/census tract. Based on the groundcover data, calculations were made for annual carbon sequestration rates, carbon stock, tree canopy/green space economic value, and pollution absorption rates (CO, O3, NO2, SO2, particulate pollution).
Included in this study was an assessment of community-wide heat island characteristics and conditions. The study identified impervious surface conditions and coverage (sidewalks, roadway, parking, and building) and compiled data in subcategories of light reflective and light absorbent conditions. Baseline calculations were made for overall heat island contribution coefficient by neighborhood
Click on the link below to access the document:
https://view.publitas.com/palebluedot/skokieground-cover-heat-island-and-carbonsequestration-study/
In support of development of effective renewable energy goalsetting and to establish strategies addressing renewable energy development, paleBLUEdot conducted a Community-Wide solar pv potentials study including economic and environmental benefits. This effort included:
1) Collect community-wide satellite data (NREL, NOAA, and NASA data).
2) Determine building roof stock characteristics and solar suitable buildings, calculate total suitable areas by roof configuration/orientation.
3) Calculate total rooftop solar capacity and annual energy generation by roof configuration/orientation.
4) Identify cost efficient annual energy generation potential.
5) Research solar market at national, State and regional levels. Identify low, medium, and high solar market absorption rates and community-wide solar pv goals.
6) Identify environmental and economic benefit of solar including economic development and job creation potential. (NREL JEDI model)
7) Develop City-Wide Renewable Solar Energy Potentials report.
Click on the link below to access the document:
https://view.publitas.com/palebluedot/skokierenewable-potentials-study/
Click here to return to TOC
To the right are infographics developed during the Climate Action Plan planning effort in support of the City’ s communications.
Click on the link below to access the infographics: https://palebluedot.llc/skokie-sustainability-infographics
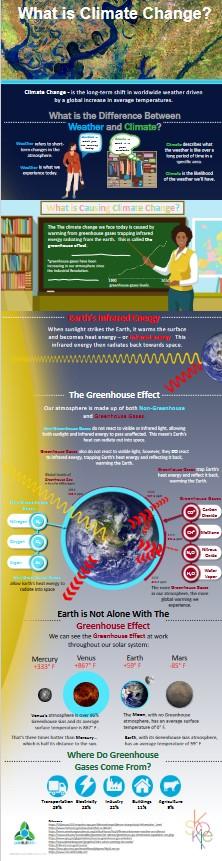

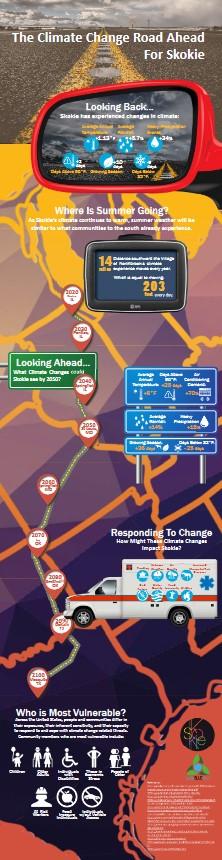

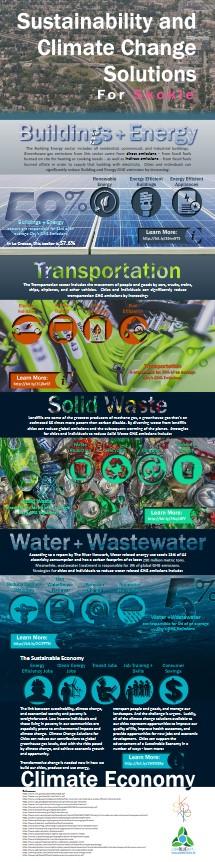

The following document the calculations and source references used for estimating the potential cumulative community-wide cost savings of the actions included in the Environmental Sustainability Plan
VMT Reductions (public transit, bike, walk, etc)
Formula:
Cumulative vehicle miles saved x Average vehicle operation cost per mile = Gross VMT savings
VMT saved (year 10)31,501,687
Cumulative vehicle miles saved:141,757,591
1 Average vehicle operating cost per mile:$0.688
Gross VMT savings$97,529,223
1 Savings per VMT based on AAA estimates
https://exchange.aaa.com/automotive/driving‐costs/#.YGUQZD9OlPY ,
https://www.slashgear.com/aaa‐says‐it‐costs‐about‐74‐cents‐per‐mile‐to‐drive‐23496316/
https://www.thesimpledollar.com/save‐money/is‐it‐really‐cheaper‐to‐ride‐the‐bus/
Increased Public Transit Use (commuter)
Formula:
Cumulative increased public transit mileage x Average public transit cost per mile (commuter) = Increased spending on public transit
Increased public transit miles (year 10)9,317,400
Cumulative increased public transit miles:41,928,313
2 Average public transit cost per mile $0.088 Increased spending on public transit$3,690,873
2 Cost per commuter public transit mile calculated using cost of monthly transit pass divided by average monthly commuter miles.
https://www.census.gov/programs‐surveys/sis/resources/data‐tools/quickfacts.html https://www.transitchicago.com/passes/
EV and Alt Fuel Conversions
Formula:
Cumulative VMT converted to EV/alt fuel x Average vehicle operation cost savings per mile = Gross EV VMT savings ‐ Gross EV purchase spending difference = Net EV VMT Savings
VMT converted to EV/Alt fuel (year 10)177,454,362
Cumulative VMT converted to EV/alt fuel798,544,629
3 Average fuel savings per mile:$0.190
4 Average vehicle maintenance savings per mile:$0.040
Gross EV VMT savings $183,329,905
5 Spending difference per vehicle on EV purchase vs ICE purchase (anualiz ‐$1,120.600 New electric vehicle purchases8,762
Gross EV purchase spending difference ‐$44,185,944
Net EV VMT savings$139,143,962
3 Fuel Savings per VMT based on average reported gasoline costs (https://gasprices.aaa.com/state‐gas‐price‐averages/) divided by current average MPG (Federal Highway Administration: https://www.fhwa.dot.gov/policyinformation/quickfinddata/qftravel.cfm) compared against average fuel cost per mile using current kWh rate (https://www.electricitylocal.com/ ) and average kWh/100 mile data (https://www.fueleconomy.gov/feg/PowerSearch.do?action=noform&path=1&year1=2017&year2=2019&vtype=Electric)
4 Maintenance savings per mile based on US Department of Energy FOTW #1190, June 14, 2021: Battery‐Electric Vehicles Have Lower Scheduled Maintenance Costs than Other Light‐Duty Vehicles: https://www.energy.gov/eere/vehicles/articles/fotw‐1190‐june‐14‐2021‐battery‐electric‐vehicles‐have‐lower‐scheduled
5 Average EV purchase price increse per vehicle on Kelly Blue Book average EV purchase price compared to average gasoline vehicle purchase price (https://mediaroom.kbb.com/2021‐05‐18‐Average‐New‐Vehicle‐Prices‐Continue‐to‐Climb,‐up‐2‐2‐Year‐Over‐Year‐for‐April‐2021,‐According‐to‐Kelley‐Blue‐Book ) divided by assumed average lifespan of 10 years
Formula:
Transportation sector savings ‐ Transportation sector cost increases = Potentail Total Cumulative Transportation Cost Savigns
Transportation Sector Savings
Gross VMT savings$97,529,223
Gross EV VMT savings $183,329,905
Total Gross Transportation Savings $280,859,128
Transportation Sector Cost Increases
Increased spending on public transit ‐$3,690,873
Gross EV purchase spending difference ‐$44,185,944
Total Gross Transportation Cost Increases ‐$47,876,816
Potentail Total Cumulative Transportation Cost Savings $232,982,313
Notes Energy ‐ Residential
Residential Savings ‐ grid electricity to solar
Formula:
Cumulative kWh converted to solar x Average cost savings per kWh = Residential solar savings
Residential kWh converted (year 10)13,909,239
Cumulative residential kWh converted62,591,576
6a
Average solar cost savings per solar kWh$0.057
Average solar installation cost per KW$2,740.00
7 Average kWh produced annually per solar pv KW installed1,287
Estimated installed solar PV KW installed (year 10)10,807
Estimated total solar installation costs$29,612,521.327
8 Est average lifespan kWh produced per solar pv KW installed38,429
8 Estimated cumulative lifespan kWh produced415,321,184
9 Estimated value of cumulative lifespan kWh produced$57,614,004.651
Average solar cost savings per kWh produced$0.067
Residential solar savings$3,561,461
6 Recent average cost per KW is 1000x the per watt cost reported by Solar Reviews https://www.solarreviews.com/solar‐panel‐cost/minnesota
7 Calculations are based on the geographic energy production factor (https://www.nrel.gov/docs/fy04osti/35297.pdf) multiplied by an average performance ratio of 78% ( https://www.nrel.gov/docs/fy13osti/57991.pdf )
8 Based on an assumed average useful life of 32.5 years according to NREL research (https://www.nrel.gov/analysis/tech‐footprint.html) with an average degradation rate of 5% (https://www.nrel.gov/state‐local‐tribal/blog/posts/stat‐faqs‐part2‐lifetime‐of‐pv‐panels.html)
9 Svings per kWh based on average electricity cost per kWh (https://www.electricitylocal.com/) calculated to year 10 using an average electrical cost inflation of 2% annually
Residential Savings ‐ community solar
Formula:
Cumulative kWh converted to community solar x Average cost savings per kWh = Residential community solar savings
Residential kWh converted (year 10)0
Cumulative residential kWh converted0
10 Average solar cost savings per kWh$0.011
Residential solar savings$0
10 The average cost savings per kWh of community solar subscription is estimated at 10%.
Residential
Formula:
Residential solar savings + Residential community solar savings + Residential electrical efficiency savings + Residential natural gas energy efficiency savings
‐ Residential increased electrical costs = Potential Total Cumulative Residential Energy Savings
solar savings $3,561,461
Residential community solar savings $0
Residential electrical efficiency savings (net)$1,278,291
Residential natural gas energy efficiency savings (net)$3,174,450
Residential increased electrical costs ‐$3,018,187 Potentail Total Cumulative Residential Energy Savings $4,996,015
Notes Energy ‐ Commercial
Commercial Savings ‐ grid electricity to solar
Formula:
Cumulative kWh converted to solar x Average cost savings per kWh = Commercial solar savings
Commercial kWh converted (year 10)51,503,578
Cumulative residential kWh converted231,766,101
6b
Average solar cost savings per kWh$0.024
Average solar installation cost per KW$1,720.00
7 Average kWh produced annually per solar pv KW installed1,287
Estimated installed solar PV KW installed (year 10)40,018
Estimated total solar installation costs$68,831,510.623
8 Estimated average lifespan kWh produced per solar pv KW installed38,429
8 Estimated cumulative lifespan kWh produced1,537,864,650
9 Estimated value of cumulative lifespan kWh produced$149,784,409.279
Average solar cost savings per kWh produced$0.053
Commercial solar savings$5,555,433
6b Recent average cost per KW is 1000x the per watt cost reported for commercial solar arrays by NREL https://www.nrel.gov/docs/fy21osti/77324.pdf
7 Calculations are based on the geographic energy production factor (https://www.nrel.gov/docs/fy04osti/35297.pdf) multiplied by an average performance ratio of 78% ( https://www.nrel.gov/docs/fy13osti/57991.pdf )
8 Based on an assumed average useful life of 32.5 years according to NREL research (https://www.nrel.gov/analysis/tech‐footprint.html) with an average degradation rate of 5% (https://www.nrel.gov/state‐local‐tribal/blog/posts/stat‐faqs‐part2‐lifetime‐of‐pv‐panels.html)
9 Svings per kWh based on average electricity cost per kWh (https://www.electricitylocal.com/) calculated to year 10 using an average electrical cost inflation of 2% annually
Commercial Savings ‐ community solar
Formula:
Cumulative kWh converted to community solar x Average cost savings per kWh = Commercial community solar savings
Commercial kWh converted (year 10)0
Cumulative commercial kWh converted0
10 Average solar cost savings per solar kWh$0
Commercial solar savings$0
10 The average cost savings per kWh of community solar subscription is estimated at 10%.
Commercial Savings ‐ electrical energy efficiency
Formula:
Cumulative kWh saved from energy efficiency x Average cost per kWh = Gross Commercial electrical energy efficiency savings ‐ Commercial Efficiency Upgrade Costs = Net Commercial Electrical Energy Efficiency Savings
Commercial kWh saved (year 10)50,473,496
Cumulative commercial kWh saved227,130,733
4 Average cost per kWh$0.080
Gross Commercial electrical energy efficiency savings$18,147,746
8 Commercial Electrical Efficiency Upgrade Costs$15,970,016
Net Commercial Electrical Energy Efficiency Savings$2,177,729
4 Energy efficiency savings per kWh saved based on average electricity cost per kWh: https://www.electricitylocal.com/
8 Assumed energy efficiency upgrade costs are calculated assuming an average ROI of12% (https://www.aceee.org/blog/2019/05/existing‐homes‐energy‐efficiency)
Commercial Savings ‐ natural gas energy efficiency
Formula:
Cumulative therms saved from energy efficiency x Average cost per therm = Gross Commercial natural gas energy efficiency savings ‐ Commercial Natural Gas Efficiency Upgrade Costs = Net Commercial Electrical Natural Gas Efficiency Savings
Commercial therms saved (year 10)5,422,560
Cumulative commercial therms saved24,401,518
9 Average cost per therm$0.921
Gross Commercial natrual gas energy efficiency savings$22,473,798
8 Commercial Natural Gas Efficiency Upgrade Costs $19,776,942
Net Commercial Natural Gas Energy Efficiency Savings$2,696,856
9 Energy efficiency savings for natural gas is based on average natural gas cost per therm https://naturalgaslocal.com/
8 Assumed energy efficiency upgrade costs are calculated assuming an average ROI of12% (https://www.aceee.org/blog/2019/05/existing‐homes‐energy‐efficiency)
Commercial Savings ‐ increased electrical expenditures from fuel switching
Formula:
(Cumulative increased kWh from fuel switching + Cummulative increased kWh from electric vehicle charging) x Average cost per kWh = Commercial increased electrical costs
Commercial increased kWh from fuel switching (year 10)14,300,824
Commercial increased kWh from EV charging (year 10)Included in EV calculations
Cumulative increased kWh64,353,709
4 Average cost per kWh$0.080
Commercial increased electrical costs$5,141,861
4 Energy efficiency savings per kWh saved based on average electricity cost per kWh: https://www.electricitylocal.com/
Formula:
Commercial community solar savings$0
Commercial electrical efficiency savings$2,177,729
Commercial natural gas energy efficiency savings$2,696,856
Commercial
Residential savings ‐ Food Waste Reduction
Formula:
and diverted x
savings per ton = Residential food waste savings Residential
Residential food waste savings$25,837,742
Notes Solid
Commercial savings ‐ Solid Waste Reduction
Formula:
= Commercial solid waste savings Participating
The following is a glossary of climate action, resilience, and sustainability terms used in this Environmental Sustainability Plan
ACU is a legal and regulatory term for a small commercial unit that is accessory to the principal residential use on the site.
ADU is a legal and regulatory term for a secondary house or apartment that is accessory to the principal residential use on the site.
Actions are detailed items that should be completed in order to carry out the vision and strategies identified in the plan.
Data on the magnitude of a human activity resulting in emissions or removals taking place during a given period of time. Data on energy use, metal production, land areas, management systems, lime and fertilizer use and waste arisings are examples of activity data. (IPCC)
Adaptation
See “Climate Adaptation or Resilience”
The social, technical skills, and financial capacities of individuals and groups to implement and maintain climate actions.
Aerosols
A collection of airborne solid or liquid particles, with a typical size between 0.01 and 10 micrometer that reside in the atmosphere for at least several hours. Aerosols may be of either natural or anthropogenic origin. Aerosols may influence climate in several ways: directly through scattering and absorbing radiation, and indirectly by acting as cloud condensation nuclei or modifying the optical properties and lifetime of clouds. (IPCC2)
Afforestation
Planting of new forests on lands that historically have not contained forests. (IPCC2)
Air Pollutant
Any man-made and/or natural substance occurring in the atmosphere that may result in adverse effects to humans, animals, vegetation, and/or materials. (CARB)
The term "anthropogenic", in the context of greenhouse gas inventories, refers to greenhouse gas emissions and removals that are a direct result of human activities or are the result of natural processes that have been affected by human activities. (USEPA2)
The gaseous envelope surrounding the Earth. The dry atmosphere consists almost entirely of nitrogen (78.1% volume mixing ratio) and oxygen (20.9% volume mixing ratio), together with a number of trace gases, such as argon (0.93% volume mixing ratio), helium and radiatively active greenhouse gases such as carbon dioxide (0.035% volume mixing ratio) and ozone. In addition, the atmosphere contains the greenhouse gas water vapor, whose amounts are highly variable but typically around 1% volume mixing ratio. The atmosphere also contains clouds and aerosols. (IPCC2)
A baseline is a measurement, calculation, or time used as a basis for comparison. Baseline emissions are the level of emissions that would occur without policy intervention or without implementation of a project. Baseline estimates are needed to determine the effectiveness of emission reduction programs (also called mitigation strategies).
The starting year for the inventory. Targets for reducing GHG emissions are often defined in relation to the base year.
BAU
See “Business As Usual Forecast”
Biogenic
Produced by the biological processes of living organisms. Note that we use the term "biogenic" to refer only to recently produced (that is non-fossil) material of biological origin. IPCC guidelines recommend that peat be treated as a fossil carbon because it takes a long time to replace harvested peat.
Movements through the Earth system of key chemical constituents essential to life, such as carbon, nitrogen, oxygen, and phosphorus. (NASA)
Biomass
Either (1) the total mass of living organisms in a given area or of a given species usually expressed as dry weight; or (2) Organic matter consisting of or recently derived from living organisms (especially regarded as fuel) excluding peat. Includes products, by-products and waste derived from such material. (IPCC1)
Biomass Waste
Organic non-fossil material of biological origin that is a byproduct or a discarded product. "Biomass waste" includes municipal solid waste from biogenic sources, landfill gas, sludge waste, agricultural crop byproducts, straw, and other biomass solids, liquids, and gases; but excludes wood and wood-derived fuels (including black liquor), biofuels feedstock, biodiesel, and fuel ethanol. Note: EIA "biomass waste" data also include energy crops grown specifically for energy production, which would not normally constitute waste. (EIA)
BIPOC
“Black, Indigenous, and People of Color” this is a term specific to the United States, intended to center the experiences of Black and Indigenous
groups as representative of or shaping the socio-economic dynamics experienced by all people of color.
Operationally defined aerosol species based on measurement of light absorption and chemical reactivity and/or thermal stability; consists of soot, charcoal and/or possible light absorbing refractory organic matter (Charlson and Heintzenberg, 1995, p. 401). (IPCC2)
Carbon sequestered and stored by wetlands and other coastal ecosystems helping to mitigate the effectsof climate change.
The Intergovernmental Panel on Climate Change (IPCC) defines a “business-as-usual” forecast as the level of emissions that would result if future development trends follow those of the past and no changes in policies take place. A BAU forecast assumes that no emission-reduction actions will be undertaken beyond those already in place, mandated by State or Federal policy, or committed to in the base year.
All parts (reservoirs) and fluxes of carbon. The cycle is usually thought of as four main reservoirs of carbon interconnected by pathways of exchange. The reservoirs are the atmosphere, terrestrial biosphere (usually includes freshwater systems), oceans, and sediments (includes fossil fuels). The annual movements of carbon, the carbon exchanges between reservoirs, occur because of various chemical, physical, geological, and biological processes. The ocean contains the largest pool of carbon near the surface of the Earth, but most of that pool is not involved with rapid exchange with the atmosphere. (NASA)
A naturally occurring gas, and also a by-product of burning fossil fuels and biomass, as well as land-use changes and other industrial processes. It is
the principal anthropogenic greenhouse gas that affects the Earth's radiative balance. It is the reference gas against which other greenhouse gases are measured and therefore has a Global Warming Potential of 1. (IPCC2)
A metric used to compare emissions of various greenhouse gases. It is the mass of carbon dioxide that would produce the same estimated radiative forcing as a given mass of another greenhouse gas. Carbon dioxide equivalents are computed by multiplying the mass of the gas emitted by its global warming potential.
An international organization that administers a platform for organizations and cities to publicly disclose their environmental impacts, such as climate risk. CDP is one of the approved disclosure platforms utilized by GCoM.
The release of carbon dioxide into the atmosphere. Primary human sources of the release of carbon dioxide occur from burning oil, coal, and gas for energy use.
A metric measure used to compare the emissions of the different greenhouse gases based upon their global warming potential. Carbon equivalents can be calculated from to carbon dioxide equivalents by multiplying the carbon dioxide equivalents by 12/44 (the ratio of the molecular weight of carbon to that of carbon dioxide). The use of carbon equivalent is declining in GHG inventories.
The amount of carbon by weight emitted per unit of energy consumed. A common measure of carbon intensity is weight of carbon per British thermal unit (Btu) of energy. When there is only one fossil fuel under consideration, the carbon intensity and the emissions coefficient are identical. When there are several fuels, carbon intensity is based on their
combined emissions coefficients weighted by their energy consumption levels. (EIA)
“Carbon neutrality” means annual zero net anthropogenic (human caused or influenced) CO2 emissions by a certain date. By definition, carbon neutrality means every ton of anthropogenic CO2 emitted is compensated with an equivalent amount of CO2 removed (e.g. via carbon sequestration).
A carbon offset is a reduction or removal of emissions of carbon dioxide or other greenhouse gases made in order to compensate for emissions made elsewhere. Offsets are measured in metric tonnes of carbon dioxide-equivalent. Offsets are bought and sold to address direct and indirect emissions associated with an organization’s operations.
A forest, ocean, or other natural environment viewed in terms of its ability to absorb carbon dioxide from the atmosphere.
This refers to the capture of CO2 from the atmosphere and its long term storage in oceans (oceanic carbon sequestration), in biomass and soils (terrestrial carbon sequestration) or in underground reservoirs (geologic carbon sequestration).
Greenhouse gases covered under the 1987 Montreal Protocol and used for refrigeration, air conditioning, packaging, insulation, solvents, or aerosol propellants. Because they are not destroyed in the lower atmosphere, CFCs drift into the upper atmosphere where, given suitable conditions, they break down ozone. These gases are being replaced by other compounds, including hydrochlorofluorocarbons and hydrofluorocarbons, which are greenhouse gases covered under the Kyoto Protocol. (IPCC3)
An alternative to a traditional linear economy (make, use, dispose) in which an economy is a regenerative system where resource input and waste are minimized. This is achieved through long-lasting product design, repair, reuse, remanufacturing, and recycling. Circular economy strategies are often cited as systems level approaches to reducing waste generation through product and system design.
Climate in a narrow sense is usually defined as the "average weather" or more rigorously as the statistical description in terms of the mean and variability of relevant quantities over a period of time ranging from months to thousands or millions of years. The classical period is 30 years, as defined by the World Meteorological Organization (WMO). These relevant quantities are most often surface variables such as temperature, precipitation, and wind. Climate in a wider sense is the state, including a statistical description, of the climate system. (IPCC2)
The capacity of a natural environment to prevent, withstand, respond to, and recover from a disruption. The process of adjusting to new climate conditions in order to reduce risks to valued assets. Adaptation is achieved through actions taken to increase resilience to climate change impacts by reducing vulnerability.
Climate change refers to a statistically significant variation in either the mean state of the climate or in its variability, persisting for an extended period (typically decades or longer). Climate change may be due to natural internal processes or external forcings, or to persistent anthropogenic changes in the composition of the atmosphere or in land use. (IPCC2)
An extreme climate event or condition that can harm human health, livelihoods, or natural resources. It can include abrupt changes to the
climate system such as extreme precipitation, storms, droughts, and heat waves.
Movement of people due to the impacts of climate change on their livelihoods or erosion of quality of life, such as shifts in water availability and crop productivity, or to factors such as sea level rise or storm surge
A quantitative method to simulate interactions of the important drivers of climate including atmosphere,oceans, land, and ice—to develop projections of future climate.
A coherent, internally consistent, plausible description of possible climatic conditions
The potential for consequences where something of value is at stake and where the outcome is uncertain, recognizing the diversity of values. Risk is often represented as probability of occurrence of hazardous events or trends multiplied by the impacts if these events or trends occur. Risk results from the interaction of vulnerability and hazard. (IPCC):
Is the degree to which a system is susceptible to, and unable to cope with, adverse effects of climate change, including climate variability and extremes. Vulnerability is a function of the character, magnitude and rate of climate change and variation to which a system is exposed, its sensitivity, and its capacity to adapt.
Vulnerability = potential impact (sensitivity x exposure) – adaptive capacity (IPCC):
A report used to identify and define the risks posed by climate change and inform adaptation measures needed to combat climate change. Reports
can be about a wide range of fields including food security, poverty analysis, and extreme weather events.
Indirect benefits to the community (e.g., public health, economic, equity) caused by climate adaptation and mitigation strategies, actions, and policies.
Co-generation is an industrial structure, installation, plant, building, or selfgenerating facility that has sequential or simultaneous generation of multiple forms of useful energy (usually mechanical and thermal) in a single, integrated system. (CARB)
CCA programs, also known as “Municipal Power Aggregation” or “Community Power Aggregation”, allow local governments to procure power on behalf of their residents, businesses, and municipal accounts from an alternative supplier while still receiving transmission and distribution service from their existing utility provider. Typically, enabling legislation at the State level is required in order to assemble a CCA program for a community. See EPA’s CCA webpage for more: https://www.epa.gov/green-power-markets/community-choiceaggregation
Combined heat and power is the simultaneous production of both electricity and useful heat for application by the producer or to be sold to other users with the aim of better utilization of the energy used. Public utilities may utilize part of the heat produced in power plants and sell it for public heating purposes. Industries as auto-producers may sell part of the excess electricity produced to other industries or to electric utilities. (IPCC)
See “Community Choice Aggregation”
Solar facilities shared by multiple community subscribers who receive credit on their electricity bills for their share of the power produced. Community solar allows members of a community to share the benefits of solar power on their property without installing it on their own property. Electricity generated by the community solar farm typically costs less than the price from utility companies.
A “complete street” is a design approach that requires streets to be designed to support safe, convenient and comfortable travel and access for users of all ages and abilities regardless of their mode of transportation.
Consistency means that an inventory should be internally consistent in all its elements over a period of years. An inventory is consistent if the same methodologies are used for the base and all subsequent years and if consistent data sets are used to estimate emissions or removals from sources or sinks. (IPCC)
A type of air emission monitoring system installed to operate continuously inside of a smokestack or other emission source. (CARB)
Roof surfaces designed to reflect radiation from the sun, reducing heat transfer into the building or the building’s surrounding area.
Pavement surfaces designed to reflect radiation from the sun, reducing heat transfer into the road’s surrounding area.
An air pollutant for which acceptable levels of exposure can be determined and for which an ambient air quality standard has been set. Examples
include: ozone, carbon monoxide, nitrogen dioxide, sulfur dioxide, and PM10 and PM2.5. The term "criteria air pollutants" derives from the requirement that the U.S. EPA must describe the characteristics and potential health and welfare effects of these pollutants. The U.S. EPA and CARB periodically review new scientific data and may propose revisions to the standards as a result. (CARB)
Those practices or processes that result in the change of forested lands to non-forest uses. This is often cited as one of the major causes of the enhanced greenhouse effect for two reasons: 1) the burning or decomposition of the wood releases carbon dioxide; and 2) trees that once removed carbon dioxide from the atmosphere in the process of photosynthesis are no longer present and contributing to carbon storage. (UNFCC)
A general classification for one of the petroleum fractions produced in conventional distillation operations. It includes diesel fuels and fuel oils. Products known as No. 1, No. 2, and No. 4 diesel fuel are used in onhighway diesel engines, such as those in trucks and automobiles, as well as off-highway engines, such as those in railroad locomotives and agricultural machinery. Products known as No. 1, No. 2, and No. 4 fuel oils are used primarily for space heating and electric power generation. (EIA)
Contributions of ecosystems to human well-being. For example, ecosystems produce resources used byhumans such as clean air, water, food, open space, flood control, climate mitigation, and other benefits.
The release of a substance (usually a gas when referring to the subject of climate change) into the atmosphere. (USEPA1)
A coefficient that quantifies the emissions or removals of a gas per unit activity. Emission factors are often based on a sample of measurement data, averaged to develop a representative rate of emission for a given activity level under a given set of operating conditions. (IPCC)
An estimate of the amount of pollutants emitted into the atmosphere from major mobile, stationary, area-wide, and natural source categories over a specific period of time such as a day or a year. (CARB)
The weight of a pollutant emitted per unit of time (e.g., tons / year). (CARB)
An Energy Tariff, or utility tariff, governs how an energy provider (electric or natural gas) charges the customer for their energy and natural gas usage. Electric and natural gas vendors must submit their tariffs to the government for approval.
The fair treatment and meaningful involvement of all people regardless of race, color, national origin, or income with respect to the development, implementation and enforcement of environmental laws, regulations and policies
The state or quality of being just and fair in the way people are treated. Equity recognizes that each person has different circumstances and allocates the exact resources and opportunities needed to reach an equal outcome. According to the World Health Organization, Equity is “the absence of avoidable or remediable differences among groups of people, whether those groups are defined socially, economically, demographically or geographically” while the US Center for Disease Control defines Equity as “when everyone has the opportunity to be as healthy as possible.”
Within the context of climate change, climate equity means both protection from climate change and environmental hazards as well as access to climate resilience and environmental benefits for all, regardless of income, race, and other characteristics.
Estimation is the assessment of the value of an unmeasurable quantity using available data and knowledge within stated computational formulas or mathematical models.
F Fluorocarbons
Carbon-fluorine compounds that often contain other elements such as hydrogen, chlorine, or bromine. Common fluorocarbons include chlorofluorocarbons (CFCs), hydrochlorofluorocarbons (HCFCs), hydrofluorocarbons (HFCs), and perfluorocarbons (PFCs). (UNFCC)
Either (1) Raw materials, such as limestone, dolomite, lime, and silica sand, which are used to reduce the heat or other energy requirements of thermal processing of minerals (such as the smelting of metals). Fluxes also may serve a dual function as a slagging agent. (2) The rate of flow of any liquid or gas, across a given area; the amount of this crossing a given area in a given time. (e.g., "Flux of CO2 absorbed by forests"). (IPCC)
Geologic deposits of hydrocarbons from ancient biological origin, such as coal, petroleum and natural gas.
Fuel combustion is the intentional oxidation of materials within an apparatus that is designed to provide heat or mechanical work to a process, or for use away from the apparatus. (IPCC)
Fugitive emissions are unintentional leaks emitted from sealed surfaces,
such as packings and gaskets, or leaks from underground pipelines resulting from corrosion or faulty connections.
G
It is the process of injecting CO2 from a source, such as coal-fired electric generating power plant, through a well into the deep subsurface. With proper site selection and management, geologic sequestration could play a major role in reducing emissions of CO2. Research efforts to evaluate the technical aspects of CO2 geologic sequestration are underway. (USEPA4)
See “Greenhouse Gas”
Global warming is an average increase in the temperature of the atmosphere near the Earth's surface and in the troposphere, which can contribute to changes in global climate patterns. Global warming can occur from a variety of causes, both natural and human induced. In common usage, "global warming" often refers to the warming that can occur as a result of increased emissions of greenhouse gases from human activities. Also see Climate Change (USEPA1)
An index, based upon radiative properties of well-mixed greenhouse gases, measuring the radiative forcing of a unit mass of a given well-mixed greenhouse gas in the present-day atmosphere integrated over a chosen time horizon, relative to that of carbon dioxide. The GWP represents the combined effect of the differing times these gases remain in the atmosphere and their relative effectiveness in absorbing outgoing thermal infrared radiation. The Kyoto Protocol is based on GWPs from pulse emissions over a 100-year time frame. (IPCC2)
GCoM is the largest global alliance for city climate leadership, built upon the commitment of over 10,000 cities and local governments. The
alliance’s mission is to mobilize and support climate and energy action in communities across the world.
Green Streets
A “green street” is a stormwater management approach that incorporates vegetation, soil, and engineered systems to slow, filter, and cleanse stormwater runoff from impervious surfaces.
Greenhouse Effect
Trapping and build-up of heat in the atmosphere (troposphere) near the earth's surface. Some of the heat flowing back toward space from the earth's surface is absorbed by water vapor, carbon dioxide, ozone, and several other gases in the atmosphere and then reradiated back toward the earth's surface. If the atmospheric concentrations of these greenhouse gases rise, the average temperature of the lower atmosphere will gradually increase. (UNFCC)
Global Protocol for Community-Scale Greenhouse Gas Emissions
Inventories:
A robust, transparent and globally-accepted framework that cities and local governments can use to consistently identify, calculate and report on city greenhouse gas emissions.
Greenhouse Gas
Greenhouse Gas (GHG) is any gas that absorbs infrared radiation in the atmosphere. Greenhouse gases include, but are not limited to, water vapor, carbon dioxide (CO2), methane (CH4), nitrous oxide (N2O), hydrochlorofluorocarbons (HCFCs), ozone (O3), hydrofluorocarbons (HFCs), perfluorocarbons (PFCs), and sulfur hexafluoride (SF6). (UNFCC)
Greenhouse Gas Reduction
Actions taken to reduce the number and severity of potential future climate impacts compared to un-checked greenhouse gas emissions.
Green Infrastructure
An approach to managing precipitation by reducing and treating stormwater at its source while delivering environmental, social, and economic benefits. Stormwater runoff can carry trash, bacteria, and other pollutants and is a major cause of water pollution in urban areas.
Green Roof
A green roof is a layer of vegetation planted over a waterproofing system that is installed on top of a flat or slightly–sloped roof. Green roofs are also known as vegetative or eco–roofs. They fall into three main categories extensive, intensive, and semi–intensive. Green roofs have been shown to decrease heat island contributions of buildings and decrease stormwater runoff while increasing overall vegetative land coverage.
A green wall is similar to a green roof but applied to exterior wall surfaces.
The sum of gross value added, at purchasers' prices, by all resident and non-resident producers in the economy, plus any taxes and minus any subsidies not included in the value of the products in a country or a geographic region for a given period, normally one year. It is calculated without deducting for depreciation of fabricated assets or depletion and degradation of natural resources. (IPCC3)
Water that occurs beneath the water table in soils and geologic formations that are fully saturated.
H
Halocarbons
A collective term for the group of partially halogenated organic species, including the chlorofluorocarbons (CFCs), hydrochlorofluorocarbons (HCFCs), hydrofluorocarbons (HFCs), halons, methyl chloride, methyl bromide, etc. Many of the halocarbons have large Global Warming Potentials. The chlorine and bromine-containing halocarbons are also involved in the depletion of the ozone layer. (IPCC2)
The potential occurrence of a natural or human-induced physical event that may cause loss of life, injury,or other health impacts, as well as damage and loss to property, infrastructure, livelihoods, service provision, and environmental resources.
A heat island is an urban or large-scale area characterized by temperatures higher than those of the surrounding due to human activities. The difference in temperature between urban and less-developed rural areas has to do with how well the surfaces in each environment absorb and hold heat. See also “Micro Heat Island”
Strictly defined as molecules containing only hydrogen and carbon. The term is often used more broadly to include any molecules in petroleum which also contains molecules with S, N, or O An unsaturated hydrocarbon is any hydrocarbon containing olefinic or aromatic structures. (IPCC)
Compounds containing only hydrogen, fluorine, and carbon atoms. They were introduced as alternatives to ozone depleting substances in serving many industrial, commercial, and personal needs. HFCs are emitted as byproducts of industrial processes and are also used in manufacturing. They do not significantly deplete the stratospheric ozone layer, but they are powerful greenhouse gases with global warming potentials ranging from 140 (HFC-152a) to 11,700 (HFC-23). (USEPA1)
A membership organization for local governments to pursue reductions in carbon pollution and improvements in advancing sustainable urban development. ICLEI’s members and team of experts work together through peer exchange, partnerships and capacity building to create systemic change for urban sustainability.
An effect of climate change on the structure or function of a system: for example, environmentalconsequences of climate change, such as extreme heat waves, rising sea levels, or changes inprecipitation resulting in flooding and droughts.
The IPCC was established jointly by the United Nations Environment Programme and the World Meteorological Organization in 1988. The purpose of the IPCC is to assess information in the scientific and technical literature related to all significant components of the issue of climate change. The IPCC draws upon hundreds of the world's expert scientists as authors and thousands as expert reviewers. Leading experts on climate change and environmental, social, and economic sciences from some 60 nations have helped the IPCC to prepare periodic assessments of the scientific underpinnings for understanding global climate change and its consequences. With its capacity for reporting on climate change, its consequences, and the viability of adaptation and mitigation measures, the IPCC is also looked to as the official advisory body to the world's governments on the state of the science of the climate change issue. For example, the IPCC organized the development of internationally accepted methods for conducting national greenhouse gas emission inventories. (USEPA1)
K
A measure of electrical energy equivalent to a power consumption of 1,000 watts for one hour.
The Kyoto Protocol to the United Nations Framework Convention on Climate Change (UNFCCC) was adopted in 1997 in Kyoto, Japan, at the Third Session of the Conference of the Parties (COP) to the UNFCCC. It contains legally binding commitments, in addition to those included in the UNFCCC. Countries included in Annex B of the Protocol (most Organisation
for Economic Cooperation and Development countries and countries with economies in transition) agreed to reduce their anthropogenic greenhouse gas emissions (carbon dioxide, methane, nitrous oxide, hydrofluorocarbons, perfluorocarbons, and sulphur hexafluoride) by at least 5% below 1990 levels in the commitment period 2008 to 2012. The Kyoto Protocol entered into force on 16 February 2005. (IPCC2)
Land use refers to the total of arrangements, activities and inputs undertaken in a certain land cover type (a set of human actions). The term land use is also used in the sense of the social and economic purposes for which land is managed (e.g., grazing, timber extraction and conservation). Land use change refers to a change in the use or management of land by humans, which may lead to a change in land cover. Land cover and land use change may have an impact on the surface albedo, evapotranspiration, sources and sinks of greenhouse gases, or other properties of the climate system and may thus have a radiative forcing and/or other impacts on climate, locally or globally. (IPCC2)
Living Streets
A “living street” combines the concepts of complete streets and green streets while putting additional focus on quality of life aspects for City residents.
LULUCF
Acronym for "Land Use, Land Use Change and Forestry", a category of activities in GHG inventories.
M
Megawatt Hour (MWH):
A measure of electrical energy equivalent to a power consumption of 1,000,000 watts for one hour.
Methane (CH4)
A hydrocarbon that is a greenhouse gas with a global warming potential
most recently estimated at 25 times that of carbon dioxide (CO2). Methane is produced through anaerobic (without oxygen) decomposition of waste in landfills, flooded rice fields, animal digestion, decomposition of animal wastes, production and distribution of natural gas and petroleum, coal production, and incomplete fossil fuel combustion. The GWP is from the IPCC's Fourth Assessment Report (AR4).
The tonne (t) or metric ton (MT), sometimes referred to as a metric tonne, is an international unit of mass. A metric ton is equal to a Megagram (Mg), 1000 kilograms, 2204.6 pounds, or 1.1023 short tons.
Micro heat islands are smaller scale hot spots within developed areas which experience higher temperatures than surrounding areas due to how well the surfaces in the location absorb, reflect, and hold heat. These occur in areas such as poorly vegetated parking lots, non-reflective roofs and asphalt roads. Micro urban heat islands are strongly affected by micro climate factors and localized conditions of the built environment. See also “Heat Island”
Common measurement used in GHG inventories. It is equal to a Teragram (Tg).
Mitigation:
Actions taken to limit the magnitude or rate of long-term global warming and its related effects. Climate change mitigation generally involves reductions in human emissions of greenhouse gases.
Sources of air pollution such as automobiles, motorcycles, trucks, off-road vehicles, boats, and airplanes. (CARB)
Mode Share
The percentage of travelers using a particular type of transportation. Modal share is an important component in developing sustainable transport within a city or region because it reveals the level of utilization of various transportation methods. The percentage reflects how well infrastructure, policies, investments, and land-use patterns support different types of travel.
A model is a quantitatively-based abstraction of a real-world situation which may simplify or neglect certain features to better focus on its more important elements. (IPCC)
See “Community Choice Aggregation”
Residential solid waste and some non-hazardous commercial, institutional, and industrial wastes. This material is generally sent to municipal landfills for disposal. (USEPA1)
Non-manmade emission sources, including biological and geological sources, wildfires, and windblown dust. (CARB)
Net Energy Metering (NEM), also known as Net Metering, allows residential and commercial customers who generate their own electricity from solar power to sell the electricity they aren't using back into the grid. The NEM rate schedule (energy tariff) determines how much you are paid for the electricity you sold to the grid. Many states have passed net metering laws. In other states, utilities may offer net metering programs voluntarily or as a result of regulatory decisions. Differences between state legislation, regulatory decisions and implementation policies mean that the mechanism for compensating solar customers varies widely across the country.
Refers to a community, business, institution, or building for which, on an annual basis, all greenhouse gas emissions resulting from operations are offset by carbon-free energy production An NZE building or property is one which generates or offsets all energy consumed. If a City develops a NZE building code, this definition will have to be refined to provide additional guidance on calculating emissions and offsets to achieve netzero emissions.
Conversion of atmospheric nitrogen gas into forms useful to plants and other organisms by lightning, bacteria, and blue-green algae; it is part of the nitrogen cycle. (UNFCC)
Gases consisting of one molecule of nitrogen and varying numbers of oxygen molecules. Nitrogen oxides are produced in the emissions of vehicle exhausts and from power stations. In the atmosphere, nitrogen oxides can contribute to formation of photochemical ozone (smog), can impair visibility, and have health consequences; they are thus considered pollutants. (NASA)
A powerful greenhouse gas with a global warming potential of 298 times that of carbon dioxide (CO2). Major sources of nitrous oxide include soil cultivation practices, especially the use of commercial and organic fertilizers, manure management, fossil fuel combustion, nitric acid production, and biomass burning. The GWP is from the IPCC's Fourth Assessment Report (AR4). O
Ozone, the triatomic form of oxygen (O3), is a gaseous atmospheric constituent. In the troposphere, it is created both naturally and by photochemical reactions involving gases resulting from human activities
(smog). Tropospheric ozone acts as a greenhouse gas. In the stratosphere, it is created by the interaction between solar ultraviolet radiation and molecular oxygen (O2). Stratospheric ozone plays a dominant role in the stratospheric radiative balance. Its concentration is highest in the ozone layer. (IPCC2)
A compound that contributes to stratospheric ozone depletion. Ozonedepleting substances (ODS) include CFCs, HCFCs, halons, methyl bromide, carbon tetrachloride, and methyl chloroform. ODS are generally very stable in the troposphere and only degrade under intense ultraviolet light in the stratosphere. When they break down, they release chlorine or bromine atoms, which then deplete ozone. (IPCC)
A group of human-made chemicals composed of carbon and fluorine only. These chemicals (predominantly CF4 and C2F6) were introduced as alternatives, along with hydrofluorocarbons, to the ozone depleting substances. In addition, PFCs are emitted as by-products of industrial processes and are also used in manufacturing. PFCs do not harm the stratospheric ozone layer, but they are powerful greenhouse gases: CF4 has a global warming potential (GWP) of 7,390 and C2F6 has a GWP of 12,200. The GWP is from the IPCC's Fourth Assessment Report (AR4).
The process by which plants take carbon dioxide from the air (or bicarbonate in water) to build carbohydrates, releasing oxygen in the process. There are several pathways of photosynthesis with different responses to atmospheric carbon dioxide concentrations. (IPCC2)
“People of Color” or “Person of Color” is a general umbrella term that collectively refers to all non-white demographic groups.
Specific points of origin where pollutants are emitted into the atmosphere such as factory smokestacks. (CARB)
A power purchase agreement (PPA), or electricity power agreement, is a contract between two parties; one party generates electricity (the seller) and the other party looks to purchase electricity (the buyer). Individual customers and organizations may enter into PPAs with individual developers or may join together to seek better prices as a group. PPAs can allow longer term commitments to renewable energy as well as a form of “direct” investing in new renewable energy generation.
A program created for financing energy efficiency and renewable improvements on private property. Private property can include residential, commercial or industrial properties. Improvements can include energy efficiency, renewable energy and water conservation upgrades to a building.
Emissions from industrial processes involving chemical transformations other than combustion. (IPCC)
R
A change in the balance between incoming solar radiation and outgoing infrared (i.e., thermal) radiation. Without any radiative forcing, solar radiation coming to the Earth would continue to be approximately equal to the infrared radiation emitted from the Earth. The addition of greenhouse gases to the atmosphere traps an increased fraction of the infrared radiation, reradiating it back toward the surface of the Earth and thereby creates a warming influence. (UNFCC)
Planting of forests on lands that have previously contained forests but that have been converted to some other use. (IPCC2)
The act of renewing tree cover by establishing young trees, naturally or artificially - note regeneration usually maintains the same forest type and is done promptly after the previous stand or forest was removed. (CSU)
Energy resources that are naturally replenishing such as solar, wind, hydro and geothermal energy.
A market-based instrument that represents the property rights to the environmental, social and other non-power attributes of renewable electricity generation. RECs are issued when one megawatt-hour (MWh) of electricity is generated and delivered to the electricity grid from a renewable energy resource. The single largest category of reductions in Evanston’s emissions has been through the purchase of RECs.
Average time spent in a reservoir by an individual atom or molecule. Also, this term is used to define the age of a molecule when it leaves the reservoir. With respect to greenhouse gases, residence time usually refers to how long a particular molecule remains in the atmosphere. (UNFCC)
The ability to anticipate, prepare for, respond to, and recover quickly from climate change hazards with minimum damage to social well-being, the economy, and the environment.
Reservoir
Either (1) a component or components of the climate system where a greenhouse gas or a precursor of a greenhouse gas is stored; or (2) Water bodies regulated for human activities (energy production, irrigation,
navigation, recreation etc.) where substantial changes in water area due to water level regulation may occur. (IPCC)
The process whereby living organisms convert organic matter to carbon dioxide, releasing energy and consuming molecular oxygen. (IPCC2)
The systematic process to improve an existing building’s performance ensuring the building controls are running efficiently and balancing the designed use and the actual use of the building.
The practice of sharing transportation in the form of carpooling or vanpooling. It is typically an arrangement made through a ride-matching service that connects drivers with riders.
S
Scope 1:
Scope 1 includes emissions being released within the city limits resulting from combustion of fossil fuels and from waste decomposition in the landfill and wastewater treatment plant.
Scope 2:
Scope 2 includes emissions produced outside the city that are induced by consumption of electrical energy within the city limits.
Scope 3:
Scope 3 includes emissions of potential policy relevance to local government operations that can be measured and reported but do not qualify as Scope 1 or 2. This includes, but is not limited to, outsourced operations and employee commute.
Common measurement for a ton in the United States. A short ton is equal to 2,000 lbs or 0.907 metric tons. (USEPA1)
Any process, activity or mechanism that removes a greenhouse gas, an aerosol or a precursor of a greenhouse gas or aerosol from the atmosphere. (IPCC2)
The social cost of carbon is a measure of the economic harm from climate change impacts, expressed as the dollar value of the total damages from emitting one ton of carbon dioxide into the atmosphere.
Electromagnetic radiation emitted by the Sun. It is also referred to as shortwave radiation. Solar radiation has a distinctive range of wavelengths (spectrum) determined by the temperature of the Sun, peaking in visible wavelengths. (IPCC2)
Any process, activity or mechanism that releases a greenhouse gas, an aerosol or a precursor of a greenhouse gas or aerosol into the atmosphere. (IPCC2)
Non-mobile sources such as power plants, refineries, and manufacturing facilities which emit air pollutants. (CARB)
Specific statements of direction that expand on the sustainability vision and GHG reduction goals and guide decisions about future public policy, community investment, and actions.
A compound composed of one sulfur and two oxygen molecules. Sulfur dioxide emitted into the atmosphere through natural and anthropogenic processes is changed in a complex series of chemical reactions in the atmosphere to sulfate aerosols. These aerosols are believed to result in
negative radiative forcing (i.e., tending to cool the Earth's surface) and do result in acid deposition (e.g., acid rain). (UNFCC)
A colorless gas soluble in alcohol and ether, slightly soluble in water. A very powerful greenhouse gas with a global warming potential most recently estimated at 22,800 times that of carbon dioxide (CO2). SF6 is used primarily in electrical transmission and distribution systems and as a dielectric in electronics. This GWP is from the IPCC's Fourth Assessment Report (AR4).
It is the process through which carbon dioxide (CO2) from the atmosphere is absorbed by trees, plants and crops through photosynthesis, and stored as carbon in biomass (tree trunks, branches, foliage and roots) and soils. The term "sinks" is also used to refer to forests, croplands, and grazing lands, and their ability to sequester carbon. Agriculture and forestry activities can also release CO2 to the atmosphere. Therefore, a carbon sink occurs when carbon sequestration is greater than carbon releases over some time period. (USEPA3)
Therm:
A unit of measure for energy that is equivalent to 100,000 British Thermal units, or roughly the energy in 100 cubic feet of natural gas. Often used for measuring natural gas usage for billing purposes.
Gaseous organic compounds, including reactive organic gases and the relatively unreactive organic gases such as methane. (CARB)
Transparency
Transparency means that the assumptions and methodologies used for an inventory should be clearly explained to facilitate replication and assessment of the inventory by users of the reported information. The
transparency of inventories is fundamental to the success of the process for the communication and consideration of information. (IPCC)
The trend of a quantity measures its change over a time period, with a positive trend value indicating growth in the quantity, and a negative value indicating a decrease. It is defined as the ratio of the change in the quantity over the time period, divided by the initial value of the quantity, and is usually expressed either as a percentage or a fraction. (IPCC)
Describes the makeup and characteristics of trees within the urban environment. V
A unit used to measure vehicle travel made by private vehicles, including passenger vehicles, truck, vans and motorcycles. Each mile traveled is counted as one vehicle mile regardless of the number of persons in the vehicle.
Vision Zero:
Vision Zero is a strategy to eliminate all traffic fatalities and severe injuries, while increasing safe, healthy, equitable mobility for all.
https://visionzeronetwork.org/
The degree to which a system is susceptible to or unable to cope with, adverse effects of climate change. Vulnerability consists of the following:
• Exposure: The presence of people, ecosystems, or assets in places and settings that could beadversely affected by climate change impacts
• Sensitivity: The degree to which people, ecosystems, or assets are affected by climate change
• Adaptive capacity: The ability of assets, systems or people to adjust to an adverse impact
The most abundant greenhouse gas; it is the water present in the atmosphere in gaseous form. Water vapor is an important part of the natural greenhouse effect. While humans are not significantly increasing its concentration, it contributes to the enhanced greenhouse effect because the warming influence of greenhouse gases leads to a positive water vapor feedback. In addition to its role as a natural greenhouse gas, water vapor plays an important role in regulating the temperature of the planet because clouds form when excess water vapor in the atmosphere condenses to form ice and water droplets and precipitation. (UNFCC)
Atmospheric condition at any given time or place. It is measured in terms of such things as wind, temperature, humidity, atmospheric pressure, cloudiness, and precipitation. In most places, weather can change from hour-to-hour, day-to-day, and season-to-season. Climate in a narrow sense is usually defined as the "average weather", or more rigorously, as the statistical description in terms of the mean and variability of relevant quantities over a period of time ranging from months to thousands or millions of years. The classical period is 30 years, as defined by the World Meteorological Organization (WMO). These quantities are most often surface variables such as temperature, precipitation, and wind. Climate in a wider sense is the state, including a statistical description, of the climate system. A simple way of remembering the difference is that climate is what you expect (e.g. cold winters) and 'weather' is what you get (e.g. a blizzard). (USEPA1)
A vehicle that does not emit harmful emissions during operation. Harmful emissions can have a negative impact on human health and the environment. Electric (battery-powered) cars, electric trains,
hydrogen-fueled vehicles, bicycles, and carriages are considered to produce zero emissions.
The conservation of all resources by means of responsible production, consumption, reuse, and recovery of products, packaging, and materials without burning and with no discharges to land, water, or air that threaten the environment or human health.
The following are source and additional information references used in this Environmental Sustainability Plan
Click here to return to TOC
Executive Summary
1 University of Reading, Show Your Stripes: https://showyourstripes.info/
2 Village of Skokie Climate Vulnerability Assessment: https://view.publitas.com/palebluedot/skokie-climatevulnerability-assessment-may-2022/
3 U.S. Global Change Research Program, National Climate Assessment: https://nca2018.globalchange.gov/chapter/14/
4 REN21, Is Renewable Energy the Definition of Resilience: https://www.ren21.net/renewable-energy-resilient/
5 Generation180, Clean Energy is a Massive Job Creator: https://generation180.org/clean-energy-is-a-massive-job-creator/
6 United Nations Environmental Programme, Emissions Gap Report November 2019: https://www.unep.org/resources/emissions-gapreport-2019
3 World Health Organization Building Capacity on Climate Change for Human Health Toolkit: https://www.who.int/activities/buildingcapacity-on-climate-change-human-health/toolkit/cobenefits
4 United Nations Economic Commission for Europe: https://unece.org/DAM/Sustainable_Development_No._2__Final__Dr aft_OK_2.pdf
5 Bollen, J. et al. (2009), Co-benefits of Climate Change Mitigation Policies: Literature Review and New Results, https://www.oecd-ilibrary.org/economics/co-benefits-of-climatechange-mitigation-policies_224388684356
6 i Parry, I, Veungh, C. and Heine, D. (2014), How Much Carbon Pricing is Countries’ Own Interests? The Critical Role of Co-Benefits;
https://www.imf.org/external/pubs/ft/wp/2014/wp14174.pdf
7 West, J. et al. (2013), Co-Benefits of Mitigating Global Greenhouse Gas Emissions for Future Air Quality and Human Health; https://www.nature.com/articles/nclimate2009
8 Mapping the co-benefits of climate change action to issues of public concern in the UK: a narrative review:
Introduction
1 Estimating the Health-Related Costs of 10 Climate-Sensitive US Events During 2012: https://www.nrdc.org/resources/bitter-pill-highhealth-costs-climate-change
2 Stop Climate Change, Save Lives: https://www.nrdc.org/stopclimate-change-save-lives
https://www.thelancet.com/journals/lanplh/article/PIIS25425196(20)30167-4/fulltext
9 Union of Concerned Scientists, Top 10 Benefits of Climate Action:
https://www.ucsusa.org/resources/top-10-benefits-climate-action
10 Village of Skokie Ground Cover Survey and Carbon Sequestration Study: https://view.publitas.com/palebluedot/skokie-groundcover-heat-island-and-carbon-sequestration-study
11 US EPA, Benefits of Global Action; https://www.epa.gov/sites/default/files/201506/documents/cirareport.pdf
12 US Climate Resilience Toolkit Climate Explorer: https://toolkit.climate.gov/tool/climate-explorer-0
13 U.S. Global Change Research Program, Climate Science Special Report: https://science2017.globalchange.gov/
14 University of Michigan Climate Center, Cities Impacts and Adaptation Tool (CIAT): http://grahammaps.miserver.it.umich.edu/ciat/home.xhtml
15 US National Oceanic and Atmospheric Administration, National Centers For Environmental Information, Climate Data Online: https://www.ncdc.noaa.gov/cdo-web/
16 Goldman School of Public Policy at the University of California Berkeley, Estimating Economic Damage from Climate Change in the United States, Solomon Hsiang et al: https://science.sciencemag.org/content/356/6345/1362
17 Village of Skokie Community GHG projections
https://view.publitas.com/palebluedot/skokie-communitygreenhouse-gas-emissions-projections
18 Bureau of Economic Analysis Regional GDP Data: https://apps.bea.gov/iTable/iTable.cfm?reqid=70&step=1&isuri=1&a crdn=5#reqid=70&step=1&isuri=1&acrdn=5
19 IPCC Sixth Assessment Report, Technical Summary: https://www.ipcc.ch/report/ar6/wg1/downloads/report/IPCC_AR6_ WGI_TS.pdf
20 Employment numbers are from US Census Bureau. Most recent data available is for year 2019 and is used in this report for both year 2019 and 2020 accordingly.
https://onthemap.ces.census.gov/
Transportation and Mobility
1 Source: Alltransit https://alltransit.cnt.org/
2 TRB Special Report 298: Driving and the Built Environment: Effects of Compact Development on Motorized Travel, Energy Use, and CO2 Emissions Impacts of Land Use Patterns on Vehicle Miles Traveled Evidence from the Literature
https://www.nap.edu/read/12747/chapter/5#88
3 The Influence of Urban Form on GHG Emissions in the U.S. Household Sector (Lee, S., and Lee, B. 2014 )
https://www.researchgate.net/publication/270952371_The_influenc e_of_urban_form_on_GHG_emissions_in_the_US_household_sector
4 US Census data, https://datausa.io/profile/geo/skokie-il
5 EV Hub: https://www.atlasevhub.com/materials/state-evregistration-data/
6 Alliance for Automotive Innovation:
https://www.autosinnovate.org/resources/electric-vehicle-salesdashboard
7 Village of Skokie Community GHG Inventory, 2020 https://view.publitas.com/palebluedot/skokie-communitygreenhouse-gas-emissions-projections/
8 US Census Bureau: https://www.census.gov/quickfacts/lacrossecitywisconsin
9 Village of Skokie Climate Action Baseline Assessment and Strategic Goal Recommendations report: https://view.publitas.com/palebluedot/skokie-sustainabilitybaseline-assessment/
10 Wisconsin State Farmer:
https://www.wisfarmer.com/story/news/2021/08/30/challengesahead-manufacturers-trying-electrify-farm-vehicles/5657095001/
11 Altenergymag https://www.altenergymag.com/story/2022/01/5emerging-obstacles-with-fleet-electrification-in-2022/36578/
12 US Department of Energy, Alternative Fuels Center; https://afdc.energy.gov/fuels/biodiesel_benefits.html
13 US Department of Energy, Alternative Fuels Center: https://afdc.energy.gov/fuels/emerging_hydrocarbon.html
14 US Energy Information Administration, https://www.eia.gov/energyexplained/biofuels/biodiesel-rd-otherbasics.php
15 University of Michigan Engineering, Renewable Diesel Demonstration Project: https://rddemo.engin.umich.edu/
16 Village of Skokie Climate Action Survey Report
https://view.publitas.com/palebluedot/skokie-cap-survey-report/
17 World Health Organization, “Pedestrian safety: A Road Safety Manual for Decision Makers and Practitioners.”
https://apps.who.int/iris/bitstream/handle/10665/79753/97892415 05352_eng.pdf
18 The League of American Bicyclists, La Crosse Report, 2020
https://bikeleague.org/sites/default/files/bfareportcards/BFC_Fall_2 020_ReportCard_La_Crosse_WI.pdf
19 US Energy Information Administration, Carbon Dioxide Emissions Coefficients:
https://www.eia.gov/environment/emissions/co2_vol_mass.php
20 AAA Average gasoline prices (as of July 2022);
https://gasprices.aaa.com/?state=WI
21 paleBLUEdot “The Carbon Footprint of a Lawn”: https://palebluedot.llc/carbon-copy/2015/7/16/the-carbon-footprintof-a-lawn
22 Edmonds “Emissions Test: Car vs Truck vs Leaf Blower” https://www.edmunds.com/car-reviews/features/emissions-testcar-vs-truck-vs-leaf-blower.html
Land Use and Housing
1 ACEEE Understanding Energy Affordability: https://www.aceee.org/sites/default/files/energy-affordability.pdf
2 US Department of Energy LEAD Tool: https://www.energy.gov/eere/slsc/maps/lead-tool
3 Village of Skokie Climate Action Baseline Assessment and Strategic Goal Recommendations report: https://view.publitas.com/palebluedot/skokie-sustainabilitybaseline-assessment/
4 Village of Skokie Climate Action Baseline Assessment and Strategic Goal Recommendations report: https://view.publitas.com/palebluedot/skokie-sustainabilitybaseline-assessment/
5 TRB Special Report 298: Driving and the Built Environment: Effects of Compact Development on Motorized Travel, Energy Use, and CO2 Emissions Impacts of Land Use Patterns on Vehicle Miles Traveled Evidence from the Literature
https://www.nap.edu/read/12747/chapter/5#88
6 The Influence of Urban Form on GHG Emissions in the U.S. Household Sector (Lee, S., and Lee, B. 2014 )
https://www.researchgate.net/publication/270952371_The_influenc e_of_urban_form_on_GHG_emissions_in_the_US_household_sector
7 National Climate Assessment, Midwest Chapter: https://nca2018.globalchange.gov/chapter/21/
8 Village of Skokie Climate Vulnerability Assessment: https://view.publitas.com/palebluedot/skokie-climate-vulnerabilityassessment-may-2022
9 Village of Skokie Ground Cover Survey and Carbon Sequestration Study: https://view.publitas.com/palebluedot/skokie-groundcover-heat-island-and-carbon-sequestration-study
10 La Crosse County Code Chapter 21 - Erosion Control and Land Disturbances:
https://www.lacrossecounty.org/code/pdf/Chapter%2021%20%20Erosion%20Control%20and%20Land%20Distrubances.pdf
11 US EPA https://www.epa.gov/heatislands
12 US EPA, Climate Change and Heat Islands:
https://www.epa.gov/heatislands/climate-change-and-heat-islands
13 Comparison of impervious surface area and normalized difference vegetation index as indicators of surface urban heat island effects in Landsat imagery. Fi Yuan and Marvin Bauer, February 2007:
https://rs.umn.edu/sites/rs.umn.edu/files/Urban_heat_island Impervious__RSE_paper.pdf
14 Jessel S, Sawyer S and Hernández D (2019) Energy, Poverty, and Health in Climate Change: A Comprehensive Review of an Emerging
Literature. Front. Public Health 7:357. doi: 10.3389/fpubh.2019.00357:
https://www.frontiersin.org/articles/10.3389/fpubh.2019.00357/full #h12
15 George Washington University, Milken Institute of Public Health
https://onlinepublichealth.gwu.edu/resources/how-to-understandenergy-poverty-clean-energy-clean-cooking/
16 Village of Skokie Renewable Energy Potentials Study
https://view.publitas.com/palebluedot/skokie-renewablepotentials-study/
17 Tony G. Reames, Michael A. Reiner, M. Ben Stacey, An incandescent truth: Disparities in energy-efficient lighting availability and prices in an urban U.S. county:
https://www.sciencedirect.com/science/article/abs/pii/S030626191 8302769
18 Portland State University. "Shifts to renewable energy can drive up energy poverty, study finds." ScienceDaily. ScienceDaily, 12 July 2019.
https://www.sciencedaily.com/releases/2019/07/190712151926.ht m
19 Village of Skokie Community GHG Inventory, 2020
https://view.publitas.com/palebluedot/skokie-communitygreenhouse-gas-emissions-projections/
20 NRDC, “Climate Report Confirms Housing Is Essential to Adaptation”: https://www.nrdc.org/experts/sam-whillans/climatereport-confirms-housing-essential-adaptation
21 Housing Matters, “Why Cities Need to Prepare for Climate Migration” https://housingmatters.urban.org/feature/why-citiesneed-prepare-climate-migration
22 Robinson C, Dilkina B, “Modeling migration patterns in the USA under sea level rise” https://doi.org/10.1371/journal.pone.0227436 Buildings and Energy
1 US Department of Energy, Residential Program Solution Center: https://rpsc.energy.gov/energy-data-facts
2 US Census Bureau:
https://www.census.gov/quickfacts/lacrossecitywisconsin
3 State of Minnesota Pollution Control Agency “Top 6 Benefits of High Performance Buildings”
https://www.pca.state.mn.us/sites/default/files/highperformancebrochure.pdf
4 US Department of Energy, Office of Energy Efficiency and Renewable Energy: https://www.energy.gov/eere/buildings/zeroenergy-buildings
5 ACEEE Understanding Energy Affordability:
https://www.aceee.org/sites/default/files/energy-affordability.pdf
6 Jessel S, Sawyer S and Hernández D (2019) Energy, Poverty, and Health in Climate Change: A Comprehensive Review of an Emerging Literature. Front. Public Health 7:357. doi: 10.3389/fpubh.2019.00357:
https://www.frontiersin.org/articles/10.3389/fpubh.2019.00357/full #h12
7 Tony G. Reames, Michael A. Reiner, M. Ben Stacey, An incandescent truth: Disparities in energy-efficient lighting availability and prices in an urban U.S. county:
https://www.sciencedirect.com/science/article/abs/pii/S030626191 8302769
8 Portland State University. "Shifts to renewable energy can drive up energy poverty, study finds." ScienceDaily. ScienceDaily, 12 July 2019.
https://www.sciencedaily.com/releases/2019/07/190712151926.ht m
9 Village of Skokie Community GHG Inventory, 2020
https://view.publitas.com/palebluedot/skokie-communitygreenhouse-gas-emissions-projections/
10 Xcel Energy Building a Carbon-Free Future:
https://www.xcelenergy.com/staticfiles/xe/PDF/Xcel%20Energy%20 Carbon%20Report%20-%20Mar%202019.pdf
11 US Department of Energy, Renewable Energy Certificates: https://www.epa.gov/greenpower/renewable-energy-certificatesrecs
12 Energy Sage, Renewable Energy Credits: https://www.energysage.com/other-clean-options/renewableenergy-credits-recs/
13 Not Used
14 US Census Bureau, ACS 2018 (5-Year Estimates) heating fuel utilization data: https://www.census.gov/acs/www/data/datatables-and-tools/data-profiles/2020/
15 US Energy Information Administration, State of Wisconsin Natural
Gas Consumption data:
https://www.eia.gov/dnav/ng/hist/n3010wi2A.htm
16 Center for Climate and Energy Solutions:
https://www.c2es.org/content/climate-resilience-overview/
17 Taubman College of Architecture and Urban Planning, University of Michigan, “GREEN BUILDING AND CLIMATE RESILIENCE, Understanding impacts and preparing for changing conditions”
https://taubmancollege.umich.edu/pdfs/student_work/planning/gre en_building_climate_resilience.pdf
18 UN Environment Programe “A Practical Guide to Climate-resilient Buildings & Communities”
https://www.unep.org/resources/practical-guide-climate-resilientbuildings
19 BC Housing Research Centre, “Climate Change Resilience for Buildings” https://www.rdh.com/wp-
content/uploads/2021/07/Climate-Change-Resilience-for-BuildingsPrimer.pdf
20 C40, “Reducing climate change impacts on new buildings”
https://www.c40knowledgehub.org/s/article/Reducing-climatechange-impacts-on-new-buildings?language=en_US Waste Management
1 State of Wisconsin DNR, “Wisconsin Waste Reduction and Recycling Law”:
https://dnr.wi.gov/files/pdf/pubs/wa/WA422.pdf
2 Minnesota Chamber of Commerce, WasteWise program:
https://www.mnchamber.com/sites/default/files/Waste%20Wise%2 0Annual%20Report.pdf
3 North Carolina State University Extension, How Your Business Can Cut Costs by Reducing Waste: https://content.ces.ncsu.edu/howyour-business-can-cut-costs-by-reducing-wastes
4 ReFed, A Roadmap To Reduce US Food Waste by 20 Percent: https://www.refed.com/downloads/ReFED_Report_2016.pdf
5 Agency for Toxic Substances and Disease Registry: https://www.atsdr.cdc.gov/hac/landfill/html/ch2.html
6 State of Wisconsin, 2020-2021 Statewide Waste Characterization Study:
https://widnr.widencollective.com/portals/9locxp5m/SolidWasteinW isconsinLandfills
7 US EPA, Cleaning Up Electronic Waste:
https://www.epa.gov/international-cooperation/cleaning-electronicwaste-e-waste
8: Gustav Sandin, Greg M. Peters, Environmental impact of textile reuse and recycling – A review, Journal of Cleaner Production: https://www.sciencedirect.com/science/article/pii/S095965261830 5985
9 Village of Skokie Climate Action Baseline Assessment and Strategic Goal Recommendations report: https://view.publitas.com/palebluedot/skokie-sustainabilitybaseline-assessment/
10 Village of Skokie Community GHG Inventory, 2020
https://view.publitas.com/palebluedot/skokie-community-
greenhouse-gas-emissions-projections/ Water and Wastewater
1 Village of Skokie Community GHG Inventory, 2020
https://view.publitas.com/palebluedot/skokie-communitygreenhouse-gas-emissions-projections/
2 RiskFactor community profile: https://riskfactor.com/city/skokiewi/5540775_fsid/fire
3 Village of Skokie Climate Vulnerability Assessment:
https://view.publitas.com/palebluedot/skokie-climate-vulnerabilityassessment-may-2022
4 Water Research Foundation, Residential End Uses Of Water Version 2 2016:
https://www.waterrf.org/research/projects/residential-end-useswater-version-2
5 National Climate Assessment, Midwest Chapter: https://nca2018.globalchange.gov/chapter/21/
6 National Oceanic and Atmospheric Administration, PrecipitationFrequency Atlas of the U .S . Volume
https://hdsc.nws.noaa.gov/hdsc/pfds/
7 National Academies of Science Engineering and Medicine, “Framing the Challenge of Urban Flooding in the United States, 2019”: https://nap.nationalacademies.org/catalog/25381/framingthe-challenge-of-urban-flooding-in-the-united-states
1 Conner, David & Knudson, William & Hamm, Michael & Peterson, H.. (2008). The Food System as an Economic Driver: Strategies and Applications for Michigan. https://www.researchgate.net/publication/247521128_The_Food_Sy stem_as_an_Economic_Driver_Strategies_and_Applications_for_Mic higan
2 USDA Climate Indicators for Agriculture: https://www.usda.gov/sites/default/files/documents/climate_indica tors_for_agriculture.pdf
3 US Department of Health, Office of Disease Prevention and Health Promotion: https://www.healthypeople.gov/2020/topicsobjectives/topic/social-determinants-health/interventionsresources/food-insecurity
4 Iowa State University Extension and Outreach, Inequities in the Food System: https://www.extension.iastate.edu/ffed/resources2/food-systems-equity/
5 Lengnick, Laura. (2015). The vulnerability of the US food system to climate change. Journal of Environmental Studies and Sciences. https://www.researchgate.net/publication/282499666_The_vulnerab ility_of_the_US_food_system_to_climate_change
6 Cleveland Foundation, ParkWorks, Kent State University Cleveland Urban Design Collaborative, Neighborhood Progress Inc., ClevelandCuyahoga County Food Policy Coalition: https://docs.google.com/viewerng/viewer?url=https://communitywealth.org/sites/clone.communitywealth.org/files/downloads/report-masi-et-al.pdf
7 American Planning Association, Local Food Systems Key to
Healthy, Resilient, Equitable Communities: https://www.planning.org/planning/2021/winter/local-foodsystems-key-to-healthy-resilient-equitable-communities/
8 USDA, Why Should You Care About Food Waste: https://www.usda.gov/foodlossandwaste/why
9 ReFed, A Roadmap To Reduce US Food Waste by 20 Percent: https://www.refed.com/downloads/ReFED_Report_2016.pdf
10 Crippa, M., Solazzo, E., Guizzardi, D. et al. Food systems are responsible for a third of global anthropogenic GHG emissions: https://www.nature.com/articles/s43016-021-00225-9
11 North Carolina State Extension, Research & Benefits of Community Gardens:
https://nccommunitygardens.ces.ncsu.edu/resources3/nccommunitygardens-research/
12 American Community Gardening Association; https://www.communitygarden.org/garden
13 Star Tribune, Community Gardens More Than Triple in Twin Cities: https://www.startribune.com/community-gardens-more-than-triplein-twin-cities/392254821/
14 USDA Food Research Atlas: https://www.ers.usda.gov/dataproducts/food-access-research-atlas/go-to-the-atlas/
15 Hannah Ritchie, You want to reduce the carbon footprint of your food? Focus on what you eat, not whether your food is local; https://ourworldindata.org/food-choice-vs-eating-local
16 USDA 2017 Census of Agriculture, La Crosse County: https://www.nass.usda.gov/Publications/AgCensus/2017/Online_R
esources/County_Profiles/Wisconsin/cp55063.pdf
17 Feeding America, Food Insecurity in The United States: https://map.feedingamerica.org/
18 USDA “Climate Change, Global Food Security, and the U.S. Food System”: https://www.usda.gov/oce/energy-and-environment/foodsecurity
19 Land Trust Alliance, “Manage Agricultural Lands for Climate Change” https://climatechange.lta.org/manage-agricultural-landsfor-climate-change/
20 National Climate Assessment: https://nca2014.globalchange.gov/report/sectors/agriculture
21 American Farmland Trust “Smarter Land Use Planning is Urgently Needed to Safeguard the Land That Grows Our Food” https://farmland.org/new-report-smarter-land-use-planning-isurgently-needed-to-safeguard-the-land-that-grows-our-food/
22 Successful Farming, “ Land use and farming have crucial role to play in avoiding climate catastrophe”: https://www.agriculture.com/news/business/report-land-use-andfarming-have-crucial-role-to-play-in-avoiding-climate-catastrophe
1 Francisco J. Escobedo, Timm Kroeger, John E. Wagner, Urban forests and pollution mitigation: Analyzing ecosystem services and disservices, Environmental Pollution, Volume 159, Issues 8–9, 2011: https://www.sciencedirect.com/science/article/abs/pii/S026974911
1000327
2 T Elmqvist, H Setälä, SN Handel, S van der Ploeg, J Aronson, JN
Blignaut, E Gómez-Baggethun, DJ Nowak, J Kronenberg, R de Groot, Benefits of restoring ecosystem services in urban areas, Current Opinion in Environmental Sustainability, Volume 14, 2015:
https://www.sciencedirect.com/science/article/pii/S187734351500 0433
3 USDA Forest Service, Carbon Storage and Sequestration by Urban Trees in the USA: https://www.nrs.fs.fed.us/pubs/5521
4 US EPA, Using Trees and Vegetation to Reduce Heat Islands:
https://www.epa.gov/heatislands/using-trees-and-vegetationreduce-heat-islands
5 USDA Forest Service, Trees Reduce Building Energy Use in US Cities: https://www.nrs.fs.fed.us/news/release/trees-reducesbuilding-energy-use
6 US EPA, Green Landscaping: Greenacres, a Source Book on Natural Landscaping for Public Officials:
https://archive.epa.gov/greenacres/web/html/chap2.html
7 Fight Climate Change at Home: Landscaping with Native Grasses, Lindsay Ifill: https://www.wildrootsnj.com/ecological-landscapingwith-native-grasses-climate-change/
8 Tallgrass Ontario: Tallgrass Prairie and Carbon Sequestration:
https://tallgrassontario.org/wp-site/carbon-sequestration/
9 US EPA, Climate Change and Heat Islands:
https://www.epa.gov/heatislands/climate-change-and-heat-islands
10 Village of Skokie Climate Vulnerability Assessment:
https://view.publitas.com/palebluedot/skokie-climate-vulnerabilityassessment-may-2022
11 Comparison of impervious surface area and normalized difference vegetation index as indicators of surface urban heat island effects in Landsat imagery. Fi Yuan and Marvin Bauer, February 2007: https://rs.umn.edu/sites/rs.umn.edu/files/Urban_heat_island Impervious__RSE_paper.pdf
12 Village of Skokie Ground Cover Survey and Carbon Sequestration Study: https://view.publitas.com/palebluedot/skokie-groundcover-heat-island-and-carbon-sequestration-study
13 The Royal College of Psychiatrists “The importance of greenspace for mental health”:
https://www.ncbi.nlm.nih.gov/pmc/articles/PMC5663018/
14 New Scientist, “Green spaces aren’t just for nature – they boost our mental health too”
https://www.newscientist.com/article/mg24933270-800-greenspaces-arent-just-for-nature-they-boost-our-mental-health-too/
15 Her Majesty the Queen in Right of Canada, represented by the Minister of Health, “Commentary Climate change, health and green space co-benefits”
https://www.ncbi.nlm.nih.gov/pmc/articles/PMC6553580/
16 Wallentinus, Hans-Georg “Red-listed forest bird species in an urban environment - Assessment of green space corridors”
https://www.researchgate.net/publication/223470552_Redlisted_forest_bird_species_in_an_urban_environment__Assessment_of_green_space_corridors
Health and Safety
1 Village of Skokie Climate Vulnerability Assessment:
https://view.publitas.com/palebluedot/skokie-climate-vulnerability-
assessment-may-2022
2 National Climate Assessment:
https://nca2018.globalchange.gov/chapter/14/
3 Khatibi, F.S., Dedekorkut-Howes, A., Howes, M. et al. Can public awareness, knowledge and engagement improve climate change adaptation policies?. Discov Sustain 2, 18 (2021).
https://doi.org/10.1007/s43621-021-00024-z
4 O’Neill, B.C., Jiang, L., KC, S. et al. The effect of education on determinants of climate change risks. Nat Sustain 3, 520–528 (2020). https://doi.org/10.1038/s41893-020-0512-y
5 United Nations, Education is Key to Addressing Climate Change:
https://www.un.org/en/climatechange/climate-solutions/educationkey-addressing-climate-change
6 Adaptive Capacity for Climate Change in Canadian Rural Communities, Ellen Wall & Katia Marzall:
https://www.tandfonline.com/doi/abs/10.1080/1354983060078550
6
7 National Oceanic and Atmospheric Administration, PrecipitationFrequency Atlas of the U .S . Volume
https://hdsc.nws.noaa.gov/hdsc/pfds/
8 La Crosse County Code Chapter 21 - Erosion Control and Land Distrubances:
https://www.lacrossecounty.org/code/pdf/Chapter%2021%20%20Erosion%20Control%20and%20Land%20Distrubances.pdf
9 US Interagency Security Committee, “Best Practices & Key Considerations for Enhancing Federal Facility Security and Resilience to Climate-Related Hazards”:
https://www.cisa.gov/sites/default/files/publications/iscenhancing-resilience-climate-hazards-dec-2015-508.pdf
10 US Department of Homeland Security “Integrating Climate Adaptation into the Department to strengthen mission operations and infrastructure” https://www.sustainability.gov/pdfs/dhs-2021cap.pdf Economy
1 Zip Recruiter: https://www.ziprecruiter.com/Salaries/GreenEnergy-Salary
2 CMBC, Green Jobs in Biden’s Infrastructure Bill: What They Could Pay and How to be Eligible: https://www.cnbc.com/2021/04/12/experts-on-green-jobs-inbidens-climate-infrastructure-bill.html
3 US Census, On The Map: https://onthemap.ces.census.gov/
4 America’s New Climate Economy: A Comprehensive Guide To The Economic Benefits Of Climate Policy In The United States: https://files.wri.org/d8/s3fs-public/americas-new-climateeconomy.pdf
5 New Climate Economy, Unlocking The Inclusive Growth Story of The 21st Century: Accelerating Climate Action in Urgent Times: https://newclimateeconomy.report/2018/wpcontent/uploads/sites/6/2018/09/NCE_2018_FULL-REPORT.pdf
6 United Nations, Financing Climate: https://www.un.org/en/climatechange/raising-ambition/climatefinance
7 World Resources Institute, 10 Charts Show the Economic Benefits of US Climate Action: https://www.wri.org/insights/10-charts-showeconomic-benefits-us-climate-action
8 Brookings Institute, Advancing Inclusion Through Clean Energy Jobs: https://www.brookings.edu/research/advancing-inclusionthrough-clean-energy-jobs/
9 The Economist, What is The Economic Cost of Covid-19?: https://www.economist.com/finance-andeconomics/2021/01/09/what-is-the-economic-cost-of-covid-19
10 Swiss Re, World Economy Set to Lose up to 18% GDP From Climate Change if no Action Taken, Reveals Swiss Ri Institute’s Stress-Test Analysis https://www.swissre.com/media/newsreleases/nr-20210422-economics-of-climate-change-risks.html
11 CDP, Major Risk Or Rosy Opportunity; Are Companies Ready For Climate Change?: https://6fefcbb86e61af1b2fc4-
c70d8ead6ced550b4d987d7c03fcdd1d.ssl.cf3.rackcdn.com/cms/re ports/documents/000/004/588/original/CDP_Climate_Change_repor t_2019.pdf?1562321876
12 US Small Business Administration, Office of Advocacy, Small Business GDP 1998-2014:
https://advocacy.sba.gov/2018/12/19/advocacy-releases-smallbusiness-gdp-1998-2014/
13 Federal Reserve Bank of San Francisco, Hunting For Money: US Cities Need A System for Financing Climate Resilience and Adaptation: https://www.frbsf.org/communitydevelopment/publications/community-development-investmentreview/2019/october/hunting-for-money-u-s-cities-need-a-systemfor-financing-climate-resilience-and-adaptation/
14 Center for Climate and Energy Solutions, Two Ways to Help Cities Finance Climate Action: https://www.c2es.org/2016/07/two-waysto-help-cities-finance-climate-action/
15 Village of Skokie Community GHG Inventory, 2020 https://view.publitas.com/palebluedot/skokie-communitygreenhouse-gas-emissions-projections/
16 Bureau of Economic Analysis Regional GDP Data: https://apps.bea.gov/iTable/iTable.cfm?reqid=70&step=1&isuri=1&a crdn=5#reqid=70&step=1&isuri=1&acrdn=5
17 Martinich, J., Crimmins, A. Climate damages and adaptation potential across diverse sectors of the United States: https://www.nature.com/articles/s41558-019-0444-6
18 Reuters, The global race to put a credible price on carbon: https://www.reutersevents.com/sustainability/global-race-putcredible-price-carbon
19 US EPA, Quantifying the Multiple Benefits of Energy Efficiency and Renewable Energy: A Guide for State and Local Governments: https://www.epa.gov/sites/default/files/201807/documents/mbg_1_multiplebenefits.pdf
20 Michael Sivak and Brandon Schoettle, Relative Costs of Driving Electric and Gasoline Vehicles in the Individual U.S. States: http://websites.umich.edu/~umtriswt/PDF/SWT-20181_Abstract_English.pdf
21 World Resources Institute, Putting People at the Center of Climate Action: https://www.wri.org/insights/putting-people-center-climateaction
22 Conner, David & Knudson, William & Hamm, Michael & Peterson,
H.. (2008). The Food System as an Economic Driver: Strategies and Applications for Michigan.
https://www.researchgate.net/publication/247521128_The_Food_Sy stem_as_an_Economic_Driver_Strategies_and_Applications_for_Mic higan
23 OECD Report for the G7 Environment Ministers, Employment Implications of Green Growth: Linking jobs, growth, and green policies; https://www.oecd.org/environment/EmploymentImplications-of-Green-Growth-OECD-Report-G7-EnvironmentMinisters.pdf
We are deeply grateful for the community collaboration and input that went into this plan. Below are some of the main contributors that made the Skokie Environmental Sustainability Plan possible:
Click
Village of Skokie Project Leads
Max Slankard Village of Skokie - Public Works Director
Liz Zimmerman Village of Skokie - Assistant to the Public Works Director
George Van Dusen Mayor
James H. Johnson Trustee
Khem Khoeun Trustee
Ralph Klein Trustee
Alison Pure Slovin Trustee
Keith A. Robinson Trustee
Edie Sue Sutker Trustee
Village of Skokie Sustainable Environment Advisory Commission
Jennifer Grossman Chair
Jim McNelis Vice Chair
Christopher Buccola Commissioner
Andrew D. DeCanniere Commissioner
Michael Gershbein Commissioner
Lisa Gotkin Commissioner
Alma Likic Commissioner
Olivia Mahoney Commissioner
Rick Moskovitz Commissioner
Emily Okallau Commissioner
Robert Render Commissioner
Charles Saxe Commissioner
Planning Team—Community Volunteers and Village Staff
Olivia (Libby) Mahoney Sustainable Environment Advisory Commission (SEAC)
Charmaine C. John Oakton Community College
Mike Charley Village of Skokie - Health and Human Services
Steven Franklin VoS Economic Development Commission
Denise Franklin Village of Skokie Police Department
Alex Franz Village of Skokie - Managers Office
Lauren Grodnicki Go Green Skokie
Jenny Grossman Sustainable Environment Advisory Commission (SEAC)
Corrie Guynn Skokie Park District
Carrie Haberstich Village of Skokie - Planning Division
Cameron Hendricks Village of Skokie - Health and Human Services
Jeff Hoeflich Village of Skokie Fire Department
George Hubchak Beautification and Improvement Commission
Frederick J. Lisiewicz Jr. Beautification and Improvement Commission
Davorka Kirincic Village of Skokie - Neighborhood Services Division
Cesar Marron Sketchbook Brewing Co./Owner
Liz Nelson Village of Skokie - Health and Human Services
Josie Neville Village of Skokie - Public Works
Johanna Nyden Village of Skokie - Community Development Director
Christopher Polinski Village of Skokie Police Department
Russ Rietveld Village of Skokie - Public Works
Joy Rifkin LRS (Lakeshore Recycling Systems)
Rachel Rosenberg Beautification and Improvement Commission
Charlie Saxe Sustainable Environment Advisory Commission (SEAC)
Jeremy Schwartz Skokie Board of Health
Phil Shefren Family Services Commisson
Max Slankard Village of Skokie - Public Works
Mike Stiehl Family Services Commisson
Ann Tennes Village of Skokie Director of Marketing and Communi-
Melissa Versch Village of Skokie - Health and Human Services
Sibyl Yau Skokie Board of Health
Liz Zimmerman Village of Skokie - Public Works
Skokie

Prepared by:
2515 White Bear Ave, A8
Suite 177
Maplewood, MN 55109
Contact:
Ted Redmond
tredmond@paleBLUEdot.llc https://palebluedot.llc/