I SALARY I
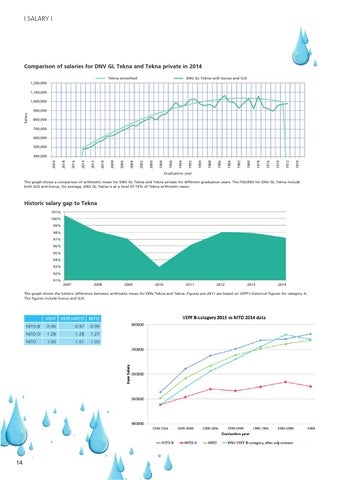
Comparison of salaries for DNV GL Tekna and Tekna private in 2014 Tekna smoothed
DNV GL Tekna with bonus and SUS
1,200,000 1,100,000 1,000,000
Salary
900,000 800,000 700,000 600,000 500,000
1970
1972
1974
1976
1978
1980
1982
1984
1986
1988
1990
1992
1994
1996
1998
2000
2002
2004
2006
2008
2010
2012
2014
2016
2018
2020
400,000
Graduation year The graph shows a comparison of arithmetic mean for DNV GL Tekna and Tekna private for different graduation years. The FIGURES for DNV GL Tekna include both SUS and bonus. On average, DNV GL Tekna is at a level 97.19% of Tekna arithmetic mean.
Historic salary gap to Tekna 101% 100% 99% 98% 97% 96% 95% 94% 93% 92% 91%
2007
2008
2009
2010
2011
2012
2013
2014
The graph shows the historic difference between arithmetic mean for DNV Tekna and Tekna. Figures pre-2011 are based on VEFF’s historical figures for category A. The figures include bonus and SUS.
VEFF VEFF+NITO NITO
14
NITO-B
0.96
0.97
0.99
NITO-D
1.28
1.28
1.27
NITO
1.00
1.01
1.03