
Annual Impact Report


The Chincoteague pony is a breed of feral horse that lives on Assateague Island in Accomack County. Each July, the ponies swim to Chincoteague Island in an event made famous by Marguerite Henry’s novel, Misty of Chincoteague. The event will celebrate its 100th anniversary in 2025.


Ivy Creek Park, Lynchburg
Leadership Message
ONE YEAR INTO THE IMPLEMENTATION of the Innovative Framework for Economic Growth, VEDP is responding to new challenges and opportunities while positioning the whole of Virginia for economic growth.
The Commonwealth leads the pack in developing best-in-class workforce solutions including the Virginia Talent Accelerator Program, which once again earned the top spot in the Business Facilities Customized Workforce Training rankings for 2024. Virginia also continues to make major strides in project-ready site availability as companies jockey for a limited supply of sites across the country, with improved infrastructure and site funding helping to drive the Commonwealth back to the top spot in CNBC’s America’s Top States for Business rankings for 2024.
Virginia is now working to solidify and extend these advantages. With strong support from Governor Glenn Youngkin and the General Assembly, VEDP recently deployed $125 million in matching grants through the Virginia Business Ready Sites Program and secured an additional $75 million focused on megasite development — all strategically focused on building a competitive inventory of project-ready sites for new and expanding businesses while generating a healthy return on investment for the state General Fund. What was already emerging as one of the most advanced site development programs in the country got a further boost in April with the passage of the Virginia Business Ready Expedited Permitting Program, aimed at streamlining permitting timelines for selected economic development sites and projects.
Project wins are following these kinds of investments in VEDP’s capabilities and Virginia’s business climate. Major announcements in FY24 include Amazon’s 1,100-job operations facility in Virginia Beach, Wells Fargo’s 1,100-job expansion in Roanoke County, CoStar’s decision to relocate its headquarters to Arlington County, Framatome’s 515-job expansion in Lynchburg, Northrop Grumman Corporation’s 300-job facility in Waynesboro, and Topsoe’s $400 million facility in Chesterfield County.
Our involvement with companies that choose the Commonwealth doesn’t end when a project gets announced. VEDP’s International Trade division helps both new and experienced exporters enter new overseas markets and expand their international sales, helping to secure more than 13,000 trade-supported jobs for Virginia in FY24. In May, the International Trade team received the “E Star” Award from the U.S. Department of Commerce, the highest honor U.S. exporters and export service providers can receive from the federal government, for the second time.
This report details these accomplishments and other notable VEDP activities in FY24, made possible by the great work and support of our local, regional, and state partners, including Governor Glenn Youngkin, Secretary of Commerce and Trade Caren Merrick, the Virginia General Assembly, members and staff of the Major Employment and Investment (MEI) Project Approval Commission, The Port of Virginia, the Virginia Chamber of Commerce, the Virginia Economic Developers Association, county and city government leaders, and countless other partners across the Commonwealth.
Thank you for your support for VEDP and for economic development in Virginia. Together, we are positioning the Commonwealth for a bright economic future.
WILLIAM H. HAYTER Board Chair FY24
JASON EL KOUBI President and CEO
Who We Are
The Virginia Economic Development Partnership (VEDP) is the state economic development authority for the Commonwealth of Virginia. Created in 1995, VEDP collaborates with local, regional, and state partners to encourage the expansion and diversification of Virginia’s economy. VEDP works to accomplish these objectives through a variety of activities, including marketing and lead generation; business retention, expansion, and attraction; trade development; business intelligence; competitive benchmarking; site development; performance-based incentives; and talent solutions.

Working closely with multiple departments within VEDP, the organization has adopted the following purpose and values to guide efforts to expand and diversify the Virginia economy.
PURPOSE VALUES
Enriching lives, communities, and the Commonwealth through economic development excellence
One VEDP
Working together as a collaborative, supportive team
Distinctive Insight
Cultivating deep expertise and diverse perspectives
Authentic Partnerships
Building strong partnerships based on integrity, authenticity, and respect
Growth Mindset
Embracing continuous improvement with humility and boldness
Results Focus
Competing with the grit to win and the curiosity to learn from our results

TRANSFORMATIONAL GOALS
Working closely with partners, VEDP has adopted five transformational goals for Virginia and VEDP for FY25–29 that reflect stakeholder input, incorporate elements of the innovative framework, and represent the central focus of its work:
1. Robust State Growth
Position Virginia to achieve a growth rate among that of the top 10 states in the U.S.
2. Every Region Wins
Ensure that every region participates in the growth of the Commonwealth
3. Best State Business Climate
Cultivate a leading business climate and sector-specific ecosystems
4. Top State for Talent
Establish Virginia as a top state for talent retention, attraction, development, and alignment
5. Most Innovative, Collaborative, and Effective State EDO
Solidify VEDP’s position as one of America’s top state EDOs through an innovative strategy, collaborative approach, and effective outcomes
Sandy River Outdoor Adventures, Prince Edward County
VEDP Divisions
BUSINESS INVESTMENT
Collaborates with partners to implement lead generation and project management strategies
KNOWLEDGE WORK
Focuses on sector expertise, lead generation, and ecosystem-building activities in the business services, financial services, software, cybersecurity, and aerospace and defense industries
MANUFACTURING
Focuses on sector expertise, lead generation, and ecosystem-building activities in the advanced materials, food and beverage manufacturing, and biopharmaceuticals industries
LOGISTICS
Focuses on sector expertise, lead generation, and ecosystem-building activities in the logistics sector
STRATEGIC PROJECTS AND LEAD GENERATION
Focuses on high-profile engagements and targeted lead generation, both domestically and internationally, and identifies and converts high-potential leads and prospects into project opportunities
ECONOMIC COMPETITIVENESS
Develops strategies to improve the foundations for state, regional, and local economic growth
INTERNATIONAL TRADE
Provides export development programs, services, and grants to help Virginia companies grow their international sales
REAL ESTATE SOLUTIONS
Collaborates with partners to develop a portfolio of Virginia properties that meet the needs of companies
RESEARCH
Conducts in-depth analysis and creates tailored client materials that convey Virginia’s competitive advantages
VIRGINIA TALENT ACCELERATOR PROGRAM
Provides customized recruitment and training solutions that give Virginia a competitive edge in securing business investment projects
REGIONAL TALENT SOLUTIONS AND BUSINESS OUTREACH (RTSBO)
Connects Virginia companies with workforce solutions and collaborates with partners to strengthen relationships with existing businesses
EXTERNAL AFFAIRS
Oversees the budget, legislative, and policy development process; encourages collaboration and coordination among partners
HUMAN RESOURCES
Seeks to hire, retain, and develop the best and the brightest to accomplish VEDP’s mission and goals
VIRGINIA OFFICE OF EDUCATION ECONOMICS (VOEE)
Leverages data to guide educational and workforce policy and practice on the availability, quality, and supply of talent in Virginia
MARKETING AND COMMUNICATIONS
Markets the Commonwealth to raise awareness of Virginia’s advantages for business and to cultivate new leads
INCENTIVES
Reviews, vets, tracks, and coordinates VEDP’s performance-based incentive programs, along with incentive structuring for major projects
FISCAL AND SUPPORT SERVICES
Provides a financial framework for VEDP to accomplish its mission through accounting, budgeting, and procurement
INFORMATION TECHNOLOGY
Supports VEDP’s technology platforms, including a variety of custom tech solutions
VEDP Global Network
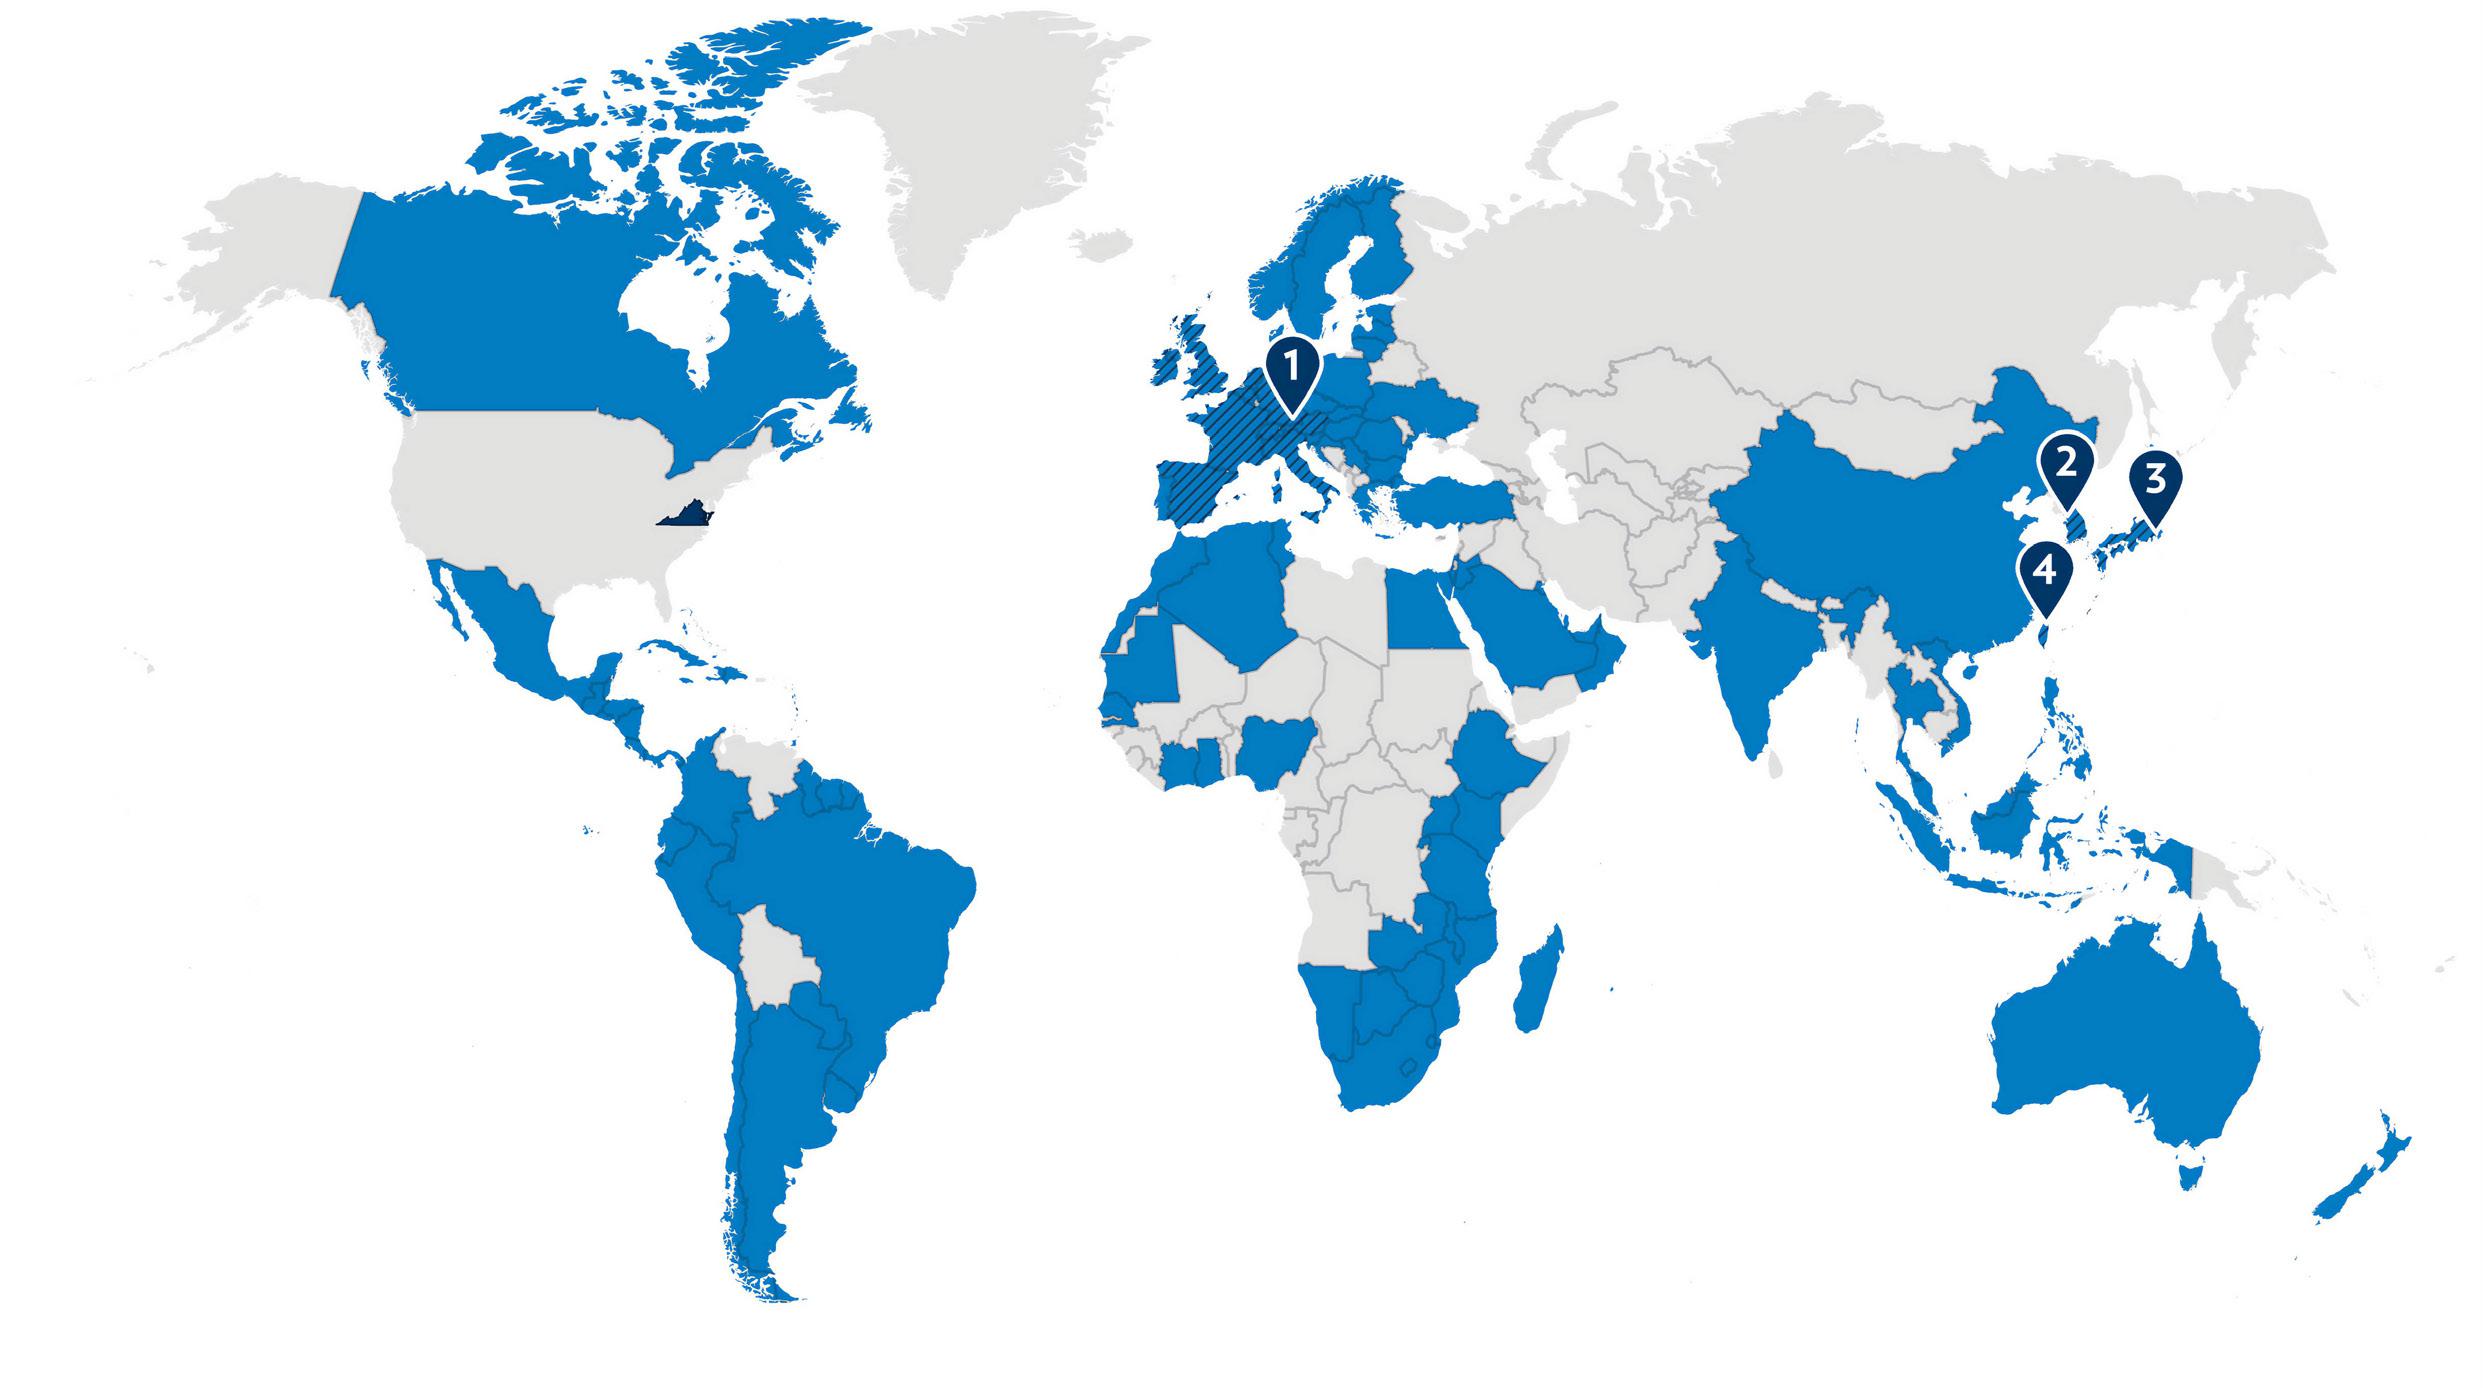
FOREIGN DIRECT INVESTMENT OFFICES
VEDP’s international business investment offices implement lead generation strategies to identify and convert high-potential foreign direct investment leads and prospects into project opportunities for Virginia.
TRADE REPRESENTATION
VEDP’s network of international research consultants covers more than 120 countries around the world. These experts provide in-country market research for Virginia exporters, specific to the needs and opportunities for each company.
Our Partners
VEDP conducts its work in collaboration with hundreds of economic development partners. Core VEDP partners include the Governor and the Administration, the Virginia General Assembly, other state agencies, 17 regional economic development organizations, and more than 100 local economic development partners, utilities, railroads, and trade associations.


STATE COUNCIL OF HIGHER EDUCATION FOR VIRGINIA


VIRG I NIA
Regional Economic Development Organizations


A Strong Year for Business Development in the Commonwealth
In collaboration with local, regional, and state partners, VEDP had a successful FY24 in the first year of implementation of its new Innovative Framework for Economic Growth.
$8.2B
Capital Investment in VEDP-Assisted Project Announcements
VEDP-Assisted Project Announcements 76

8,210
Direct Jobs
Colonial Beach

BUSINESS INVESTMENT:
PARTNER AND CLIENT SATISFACTION
VEDP implements partner and client surveys to assist in evaluating project management effectiveness. The program received high approval in FY24.
Overall average response that VEDP effectively manages economic development projects:
99.8%
Strongly Agree/Agree
INTERNATIONAL TRADE STATS
Virginia’s central location and commitment to expanding its global network make the Commonwealth the key partner for businesses, exporters, and service providers worldwide.
504

Companies participated in VEDP International Trade programs and services in FY24*
*the most companies VEDP International Trade has ever served in a year
$1.5B
Total international sales attributed to VEDP International Trade programs in FY24

13,123
Jobs supported by VEDP’s trade programs in FY24
Virginia’s International Trade Team
Recognized With Nation’s Top Export Award for Second Time
New Point Comfort Lighthouse, Mathews County

INTERNATIONAL TRADE CLIENT SATISFACTION
VEDP’s International Trade division achieved exceptionally high scores for the quality of its programs and services in FY24.
99%
Companies that were “extremely likely” or “likely” to recommend VEDP’s export assistance programs to other Virginia companies
99%
Companies that rated the quality of VEDP International Trade’s export assistance as “excellent” or “above average”
99%
Companies that were “extremely likely” or “likely” to use VEDP International Trade for export assistance in the future
99%
Companies that say VEDP International Trade services helped them work toward achieving their strategic international goals


Existing Business Outreach
VEDP’s Regional Talent Solutions and Business Outreach (RTSBO) team meets with Virginia businesses in collaboration with our local and regional economic development partners to foster relationships with companies that drive Virginia’s economy and highlight existing business needs, particularly around talent. These efforts uncover challenges that might cause businesses to consider relocating, identify potential growth opportunities, and cultivate supplier ecosystems domestically and internationally. Here’s how Virginia’s innovative approach to economic development has driven greater outreach and service delivery to the Commonwealth’s companies.
502
Existing business outreach visits (20% increase from FY23)
570
Consultative services delivered, including 323 connections with partner organizations
69%
Businesses visited had an optimistic business outlook
Virginia Diodes, Inc.,
VIRGINIA JOBS INVESTMENT PROGRAM
The Virginia Jobs Investment Program (VJIP), Virginia’s most frequently used recruitment and training incentive, is a discretionary incentive that provides funding and services to qualifying companies to support new job creation or upskilling in conjunction with new or expanding operations. The cash grant and accompanying services are intended to offset a company’s recruitment and training costs.
249
Client projects supported by the VJIP incentive

71
Localities that had a VJIP-supported project 85%
VEDP-assisted project wins supported by the VJIP incentive
$35.76
Average hourly wage for VJIP projects 4,434
Jobs supported by VJIP projects
$822M
Capital investment for VJIP projects 98%
FY24 VJIP Client Satisfaction Survey respondents “strongly agree” or “agree” that VJIP contributed to their growth and success

Virginia Beach
FEATURES
I’ve never seen [anything] like the Virginia Talent Accelerator Program, and I’ve been to many places around the world to look at facilities…It’s phenomenal.
CARSTEN RASMUSSEN Chief Operations Officer, The LEGO Group


The LEGO Group rendering, Chesterfield County
Talent Accelerator
Inside the Virginia Talent Accelerator Program’s Bespoke Workforce Solutions
WHEN THE LEGO GROUP was considering an East Coast location for their return to manufacturing in the United States, Virginia offered a nearly shovel-ready site in a well-established industrial park in the fast-growing Richmond metro area. But what helped seal the deal was the opportunity to work with the Virginia Talent Accelerator Program, ranked as the No. 1 Customized Workforce Training program by Business Facilities for two years in a row.
The Talent Accelerator team began developing sophisticated recruitment tools for the LEGO Group weeks before the project was announced to help the company leverage the publicity to build its future talent pool. The response was undeniable — thousands of candidates applied within 36 hours, and the pool continues to grow each day as the company continues to hire for the facility in advance of the planned opening in 2027.
The program is a differentiator for Virginia in a competitive national economic development environment and has produced tremendous return on investment, helping secure more than 13,000 jobs since its launch in early 2020. In addition to the LEGO Group, companies as diverse as Haleon (formerly GSK), Rocket Lab, and Tyson Foods have benefited from the program’s world-class training and recruitment solutions, which are fully customized to a company’s unique operations, equipment, standards, and culture. The program’s work, delivered in collaboration with the Virginia Community College System, is delivered by a talented in-house team of video producers, instructional designers, and 3D animators who develop highly customized visual media to expedite recruitment and accelerate new hire learning.
Every Talent Accelerator project begins with an analysis of company processes, job roles, tasks, culture, and existing recruitment and training processes. The process starts with data-driven recruiting campaigns featuring robust advertising and a range of services aimed at generating large pools of qualified candidates for positions at all levels of a company.
Once employees are in place, companies benefit from Talent Accelerator training services that include hands-on training, simulations, broadcastquality videos, illustrated work instructions, instructor-led classroom sessions, animations, and e-learning modules. The Virginia Talent Accelerator Program operates like a military Special Forces unit, a team of talent acquisition and instructional design experts that Virginia deploys across the Commonwealth.
The Talent Accelerator team is hired fresh from the private sector, with deep experience across a wide swath of industries. The technical training they provide is supplemented by modules in organizational development, operational excellence, and leadership. They deliver fully customized proprietary solutions that expedite recruiting and shorten the new hire learning curve.
In addition to delivering fully customized workforce solutions, the Talent Accelerator team provides clients with direct access to the talent generated by Virginia’s world-class universities and community colleges. All program services are provided at no cost to qualified new and expanding companies as an incentive for job creation. All company-specific materials developed during the course of the project become property of the client, and all proprietary information is protected by a nondisclosure agreement.
International Trade
Virginia’s International Trade Team Recognized With Nation’s Top Export Award for Second Time
VEDP’S INTERNATIONAL TRADE PROGRAMS provide direct support to Virginia companies committed to increasing their international export sales as a corporate growth strategy. These services help companies identify potential new markets, develop market entry strategies, and locate possible distributors and representatives for products or services — all at little to no cost to the company.
The team recently received the “E Star” Award from the U.S. Department of Commerce, the highest honor U.S. exporters and export service providers can receive from the federal government, for the second time. U.S. Deputy Under Secretary of Commerce for International Trade Diane Farrell presented the 2024 President’s “E Star” Award to VEDP President and CEO Jason El Koubi and Assistant Vice President of International Trade Lindsey Bertozzi in May.
The “E Star” Award, the nation’s top export honor, is presented to companies and organizations that have made significant contributions over the past four years to expand U.S. business in international markets. VEDP’s International Trade team previously won the “E Star” Award in 2007, and the International Trade team’s recognition in 2024 is a milestone achievement.
“Helping businesses develop the tools to generate sales beyond the U.S. is a catalyst for increased job growth across every region of Virginia,” El Koubi said. “The International Trade team’s work in this area is a key example of how Virginia is leading the way as a top state for business.”
The client companies who participated in VEDP-assisted programs in 2023 reported $1.5 billion in export revenue, which the “E” Awards Committee recognized as a significant contributor to export growth in the United States.
The mission of the International Trade team at VEDP, led by Senior Vice President and Chief Administrative Officer Stephanie Agee, is to increase the number of Virginia companies selling overseas and their volume of international business. VEDP helps both new and experienced exporters enter new international markets.
“It’s a true honor to receive the ‘E Star’ Award, the highest award given to an export promotion organization, and we are thankful to the Department of Commerce for recognizing the contributions of VEDP International Trade to export expansion in both Virginia and the United States,” Agee said. “Providing valuable, actionable resources to assist Virginia companies in growing their international sales is incredibly important to us and we are proud to do this work in support of economic growth throughout the Commonwealth.”

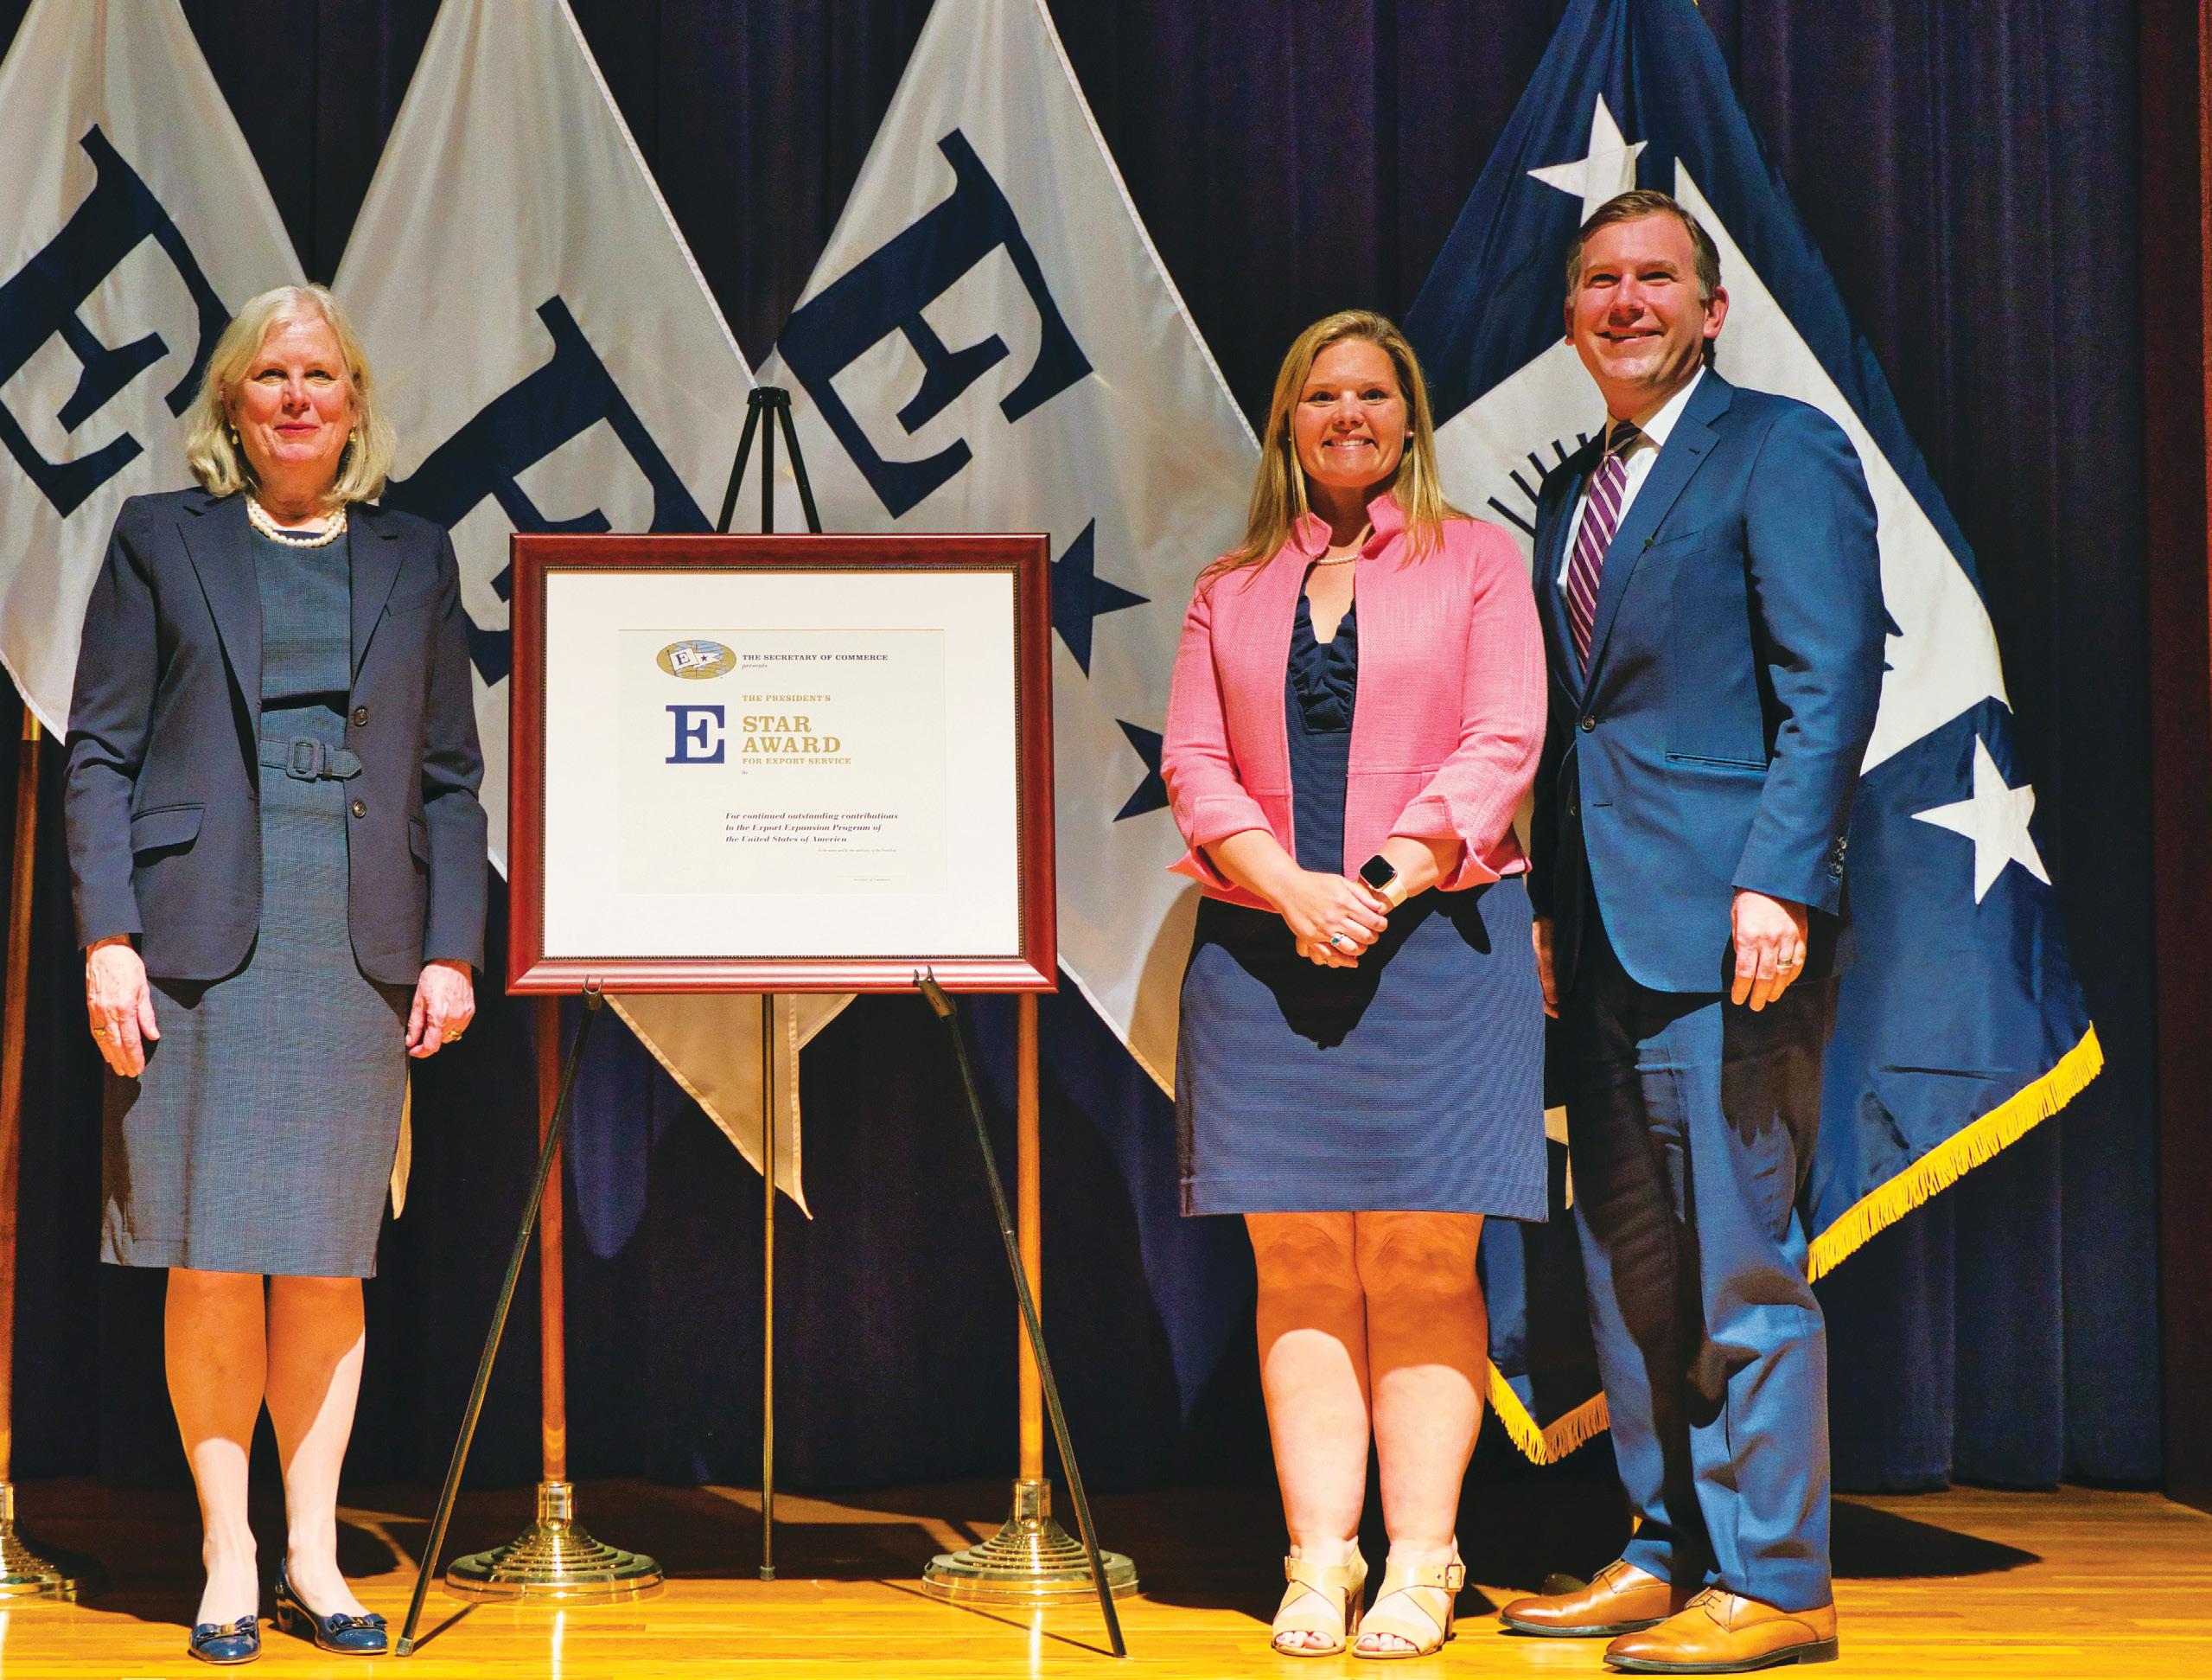
U.S. Deputy Under Secretary of Commerce for International Trade Diane Farrell (left) presented the 2024 President’s “E Star” Award to VEDP Assistant Vice President of International Trade Lindsey Bertozzi (center) and President and CEO Jason El Koubi in May 2024.
VEDP has demonstrated a sustained commitment to export expansion through development of new and innovative education programs to assist Virginia exporters and through the organization’s measurable growth of client companies in 2023.
GINA RAIMONDO
U.S. Secretary of Commerce

Virginia Secretary of Commerce and Trade Caren Merrick (center) joined officials from the Virginia and Taiwan governments to celebrate the opening of VEDP’s Taiwan office.
Foreign Direct Investment
VEDP Bolsters FDI Attraction Efforts With Opening of Taiwan Office
VEDP’S ONGOING EFFORTS to secure foreign direct investment (FDI) in Virginia reached a major milestone in September 2023 with the opening of the Virginia-Taiwan Trade office in Taipei City, aimed at strengthening business relationships between Virginia and foreign companies, including mutual trade and investment initiatives. The Taiwan office is VEDP’s fourth foreign office, in addition to offices in Europe (Germany), Japan, and South Korea.
Taiwan is the fourth fastest-growing source of FDI in the United States, while the U.S. is Taiwan’s second-largest trading partner. Specific to Virginia, Taiwan is the Commonwealth’s ninth-largest export market and 10th-largest import source market. In 2022, Virginia exported $730 million in products to Taiwan while importing $1 billion in goods.
VEDP’s international offices support company executives with the site selection process in the United States, confidentially and free of charge, and ensure that Virginia is on the list of states being considered for new operations in the United States. The new office, along with the existing offices in Europe, Japan, and Korea, will offer
services to assist Taiwanese companies with opportunities in Virginia and bring investment and jobs to the Commonwealth. Virginia is already realizing benefits from having a physical footprint in Taiwan — multiple media requests from within the country show an increased interest in Virginia’s economy on the international stage.
“Taiwan and Virginia share a commitment to innovation, collaboration, and leadership, and the new office will showcase the Commonwealth’s advantages to prospective investors and businesses and expand markets for Virginia products,” said Virginia Secretary of Commerce and Trade Caren Merrick.
Foreign direct investment is a foundational component of the U.S. economy, bringing highquality, skilled jobs to the country. Nationally, jobs at foreign-owned companies pay 7% more than the economy-wide average. More than 1,000 foreignowned companies operate in Virginia, employing more than 200,000 people. VEDP’s Taiwan office helps the Commonwealth’s concerted, government-wide effort to maximize foreign investment and create jobs in Virginia.
FY24 in Brief
VEDP continues to see bipartisan support from administration partners and the General Assembly for its economic development efforts, including historic investments in the Innovative Framework for Economic Growth, the Virginia Business Ready Sites Program, and the Virginia Office of Education Economics (VOEE). Explore the following ways VEDP is continuing to utilize these investments to make Virginia more competitive.
VEDP SECTOR TEAM LEADERS HELP DRIVE SHIFT IN FOCUS
As part of the Innovative Framework for Economic Growth, VEDP created three new sector teams within the organization to prioritize lead generation and ecosystem-building in the sectors with the most predicted growth in the coming years. These sectors include knowledge work, manufacturing, and logistics. Three new vice presidents at VEDP are leading the charge of revolutionizing economic development in the Commonwealth.

TED SNIFFIN
Vice President, Knowledge Work

SNEHA ATWAL
Vice President, Manufacturing
Vice President of Knowledge Work Ted Sniffin leads a team that focuses on sector expertise, lead generation, and ecosystem-building activities in the business services, financial services, software and cybersecurity, and aerospace and defense industries. Prior to joining VEDP, Sniffin served as Managing Director of Global Business Development at Amazon Web Services, where he led global business development for the Worldwide Public Sector business.
Vice President of Manufacturing Sneha Atwal provides primary staff leadership for developing and implementing strategies to promote employment growth within the advanced materials, food processing and manufacturing, and biopharmaceuticals industries in Virginia. Prior to joining VEDP, Atwal served as Global Head of Regulatory Strategy & Emerging Issues with Celanese, a global chemical manufacturer.

ERIC JEHU
Vice President, Logistics
Vice President of Logistics Eric Jehu provides primary staff leadership for developing and implementing strategies to promote employment growth within the logistics industry in Virginia. Before joining VEDP, Jehu served as Vice President of Business Development for Ardent Global Logistics, and served in multiple roles over 17 years at Expeditors International, a top 10 global third-party logistics (3PL) company.

Anthem GO Outside Festival, Roanoke
FY24 in Brief Continued
SOLVING THE EDUCATION AND EMPLOYMENT EQUATION
In FY24, the Virginia Office of Education Economics (VOEE) launched five dashboards specifically tracking education and workforce alignment in the Commonwealth. From identifying which jobs are in the highest demand to curating job postings for new graduates, these dashboards are a powerful resource for higher education institutions across the region. These new tools help VOEE fulfill its mission of providing a unified, consistent source of information and analysis on linkages between education and employment outcomes. The new dashboards include Education and Workforce Alignment, Virginia 2024 High Demand Occupations, Job Posting Analytics Explorer, Virginia Post-Secondary Completion, and Virginia College and Career Outcomes Explorer. Find out more at voee.org

AI’S EMERGING OPPORTUNITY FOR VIRGINIA
As part of Virginia’s proactive efforts related to AI, VEDP produced a report in accordance with an executive order with insights from leading AI researchers, economists, and private-sector companies on Virginia’s competitive position with respect to generative AI, workforce implications, and recommendations on how Virginia can capture economic growth driven by rapidly evolving Gen AI technology.
The research indicated that Virginia is in a strong position to capture growth from AI, but proactive policies should be pursued to prepare the workforce and position the Commonwealth as a leader in Gen AI innovation. Several of Virginia’s target industries will see rapid growth due to AI, including software and cybersecurity, data centers, and technology consulting firms. Virginia ranks third in total AI job postings, ahead of all Southeastern peer states, and has advanced two spots since the original report was published. While insights continue to evolve, the latest analysis indicates that AI tool integration will lead to productivity gains for many occupations.
Commonwealth Crossing Business Centre, Henry County


HISTORIC FUNDING FOR SITE DEVELOPMENT
The Virginia Business Ready Sites Program (VBRSP), which awarded $90 million in development grants in 2023 and is awarding $126 million in 2024, certifies sites in advance by partnering with localities, utilities, and state agencies to assemble permits and approvals to make way for a smooth construction process. Site readiness has been the deciding factor for numerous major recent Virginia wins and was a primary reason Virginia was named America’s Top State for Business by CNBC in 2024. Building on the VBRSP’s success, VEDP worked with the General Assembly and the Governor’s administration to establish the new Virginia Business Ready Expedited Permitting Program to establish the permitting process for transformational economic development projects in Virginia.

Deloitte, Arlington County
New River Community College
Germanna Community College
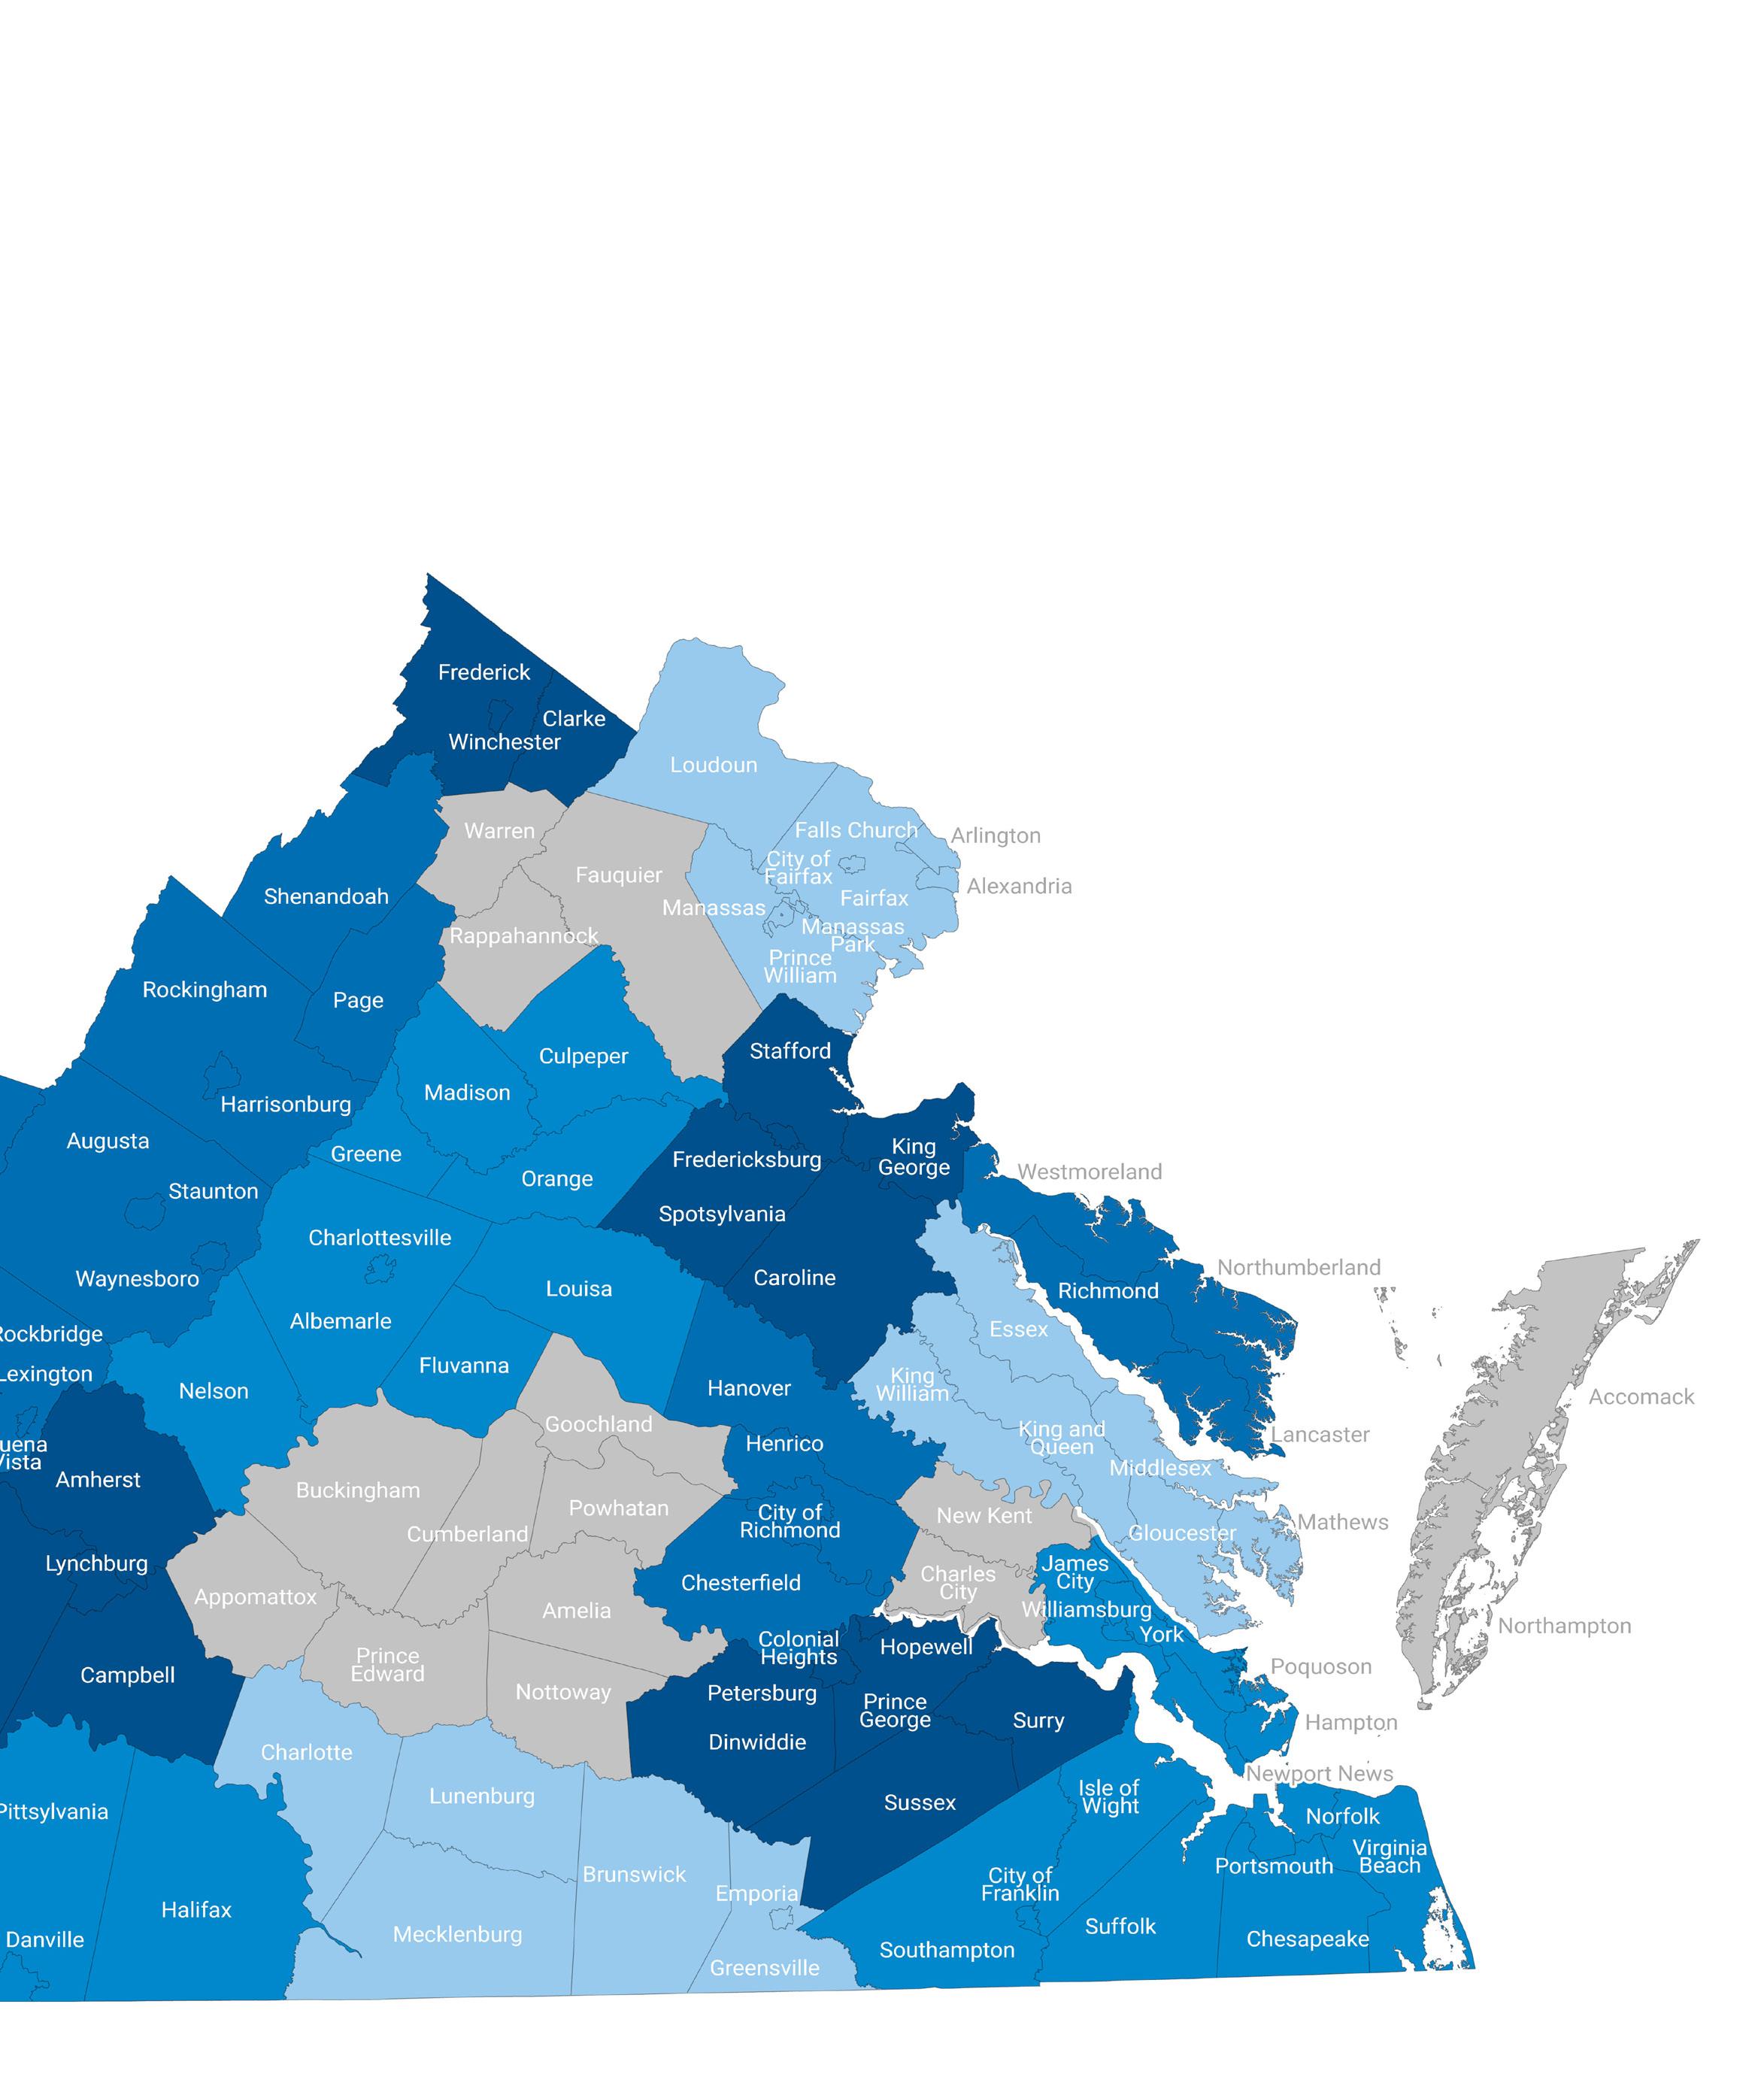
Impact in Virginia
VEDP-assisted projects have added more than 100,000 new direct jobs and $100 billion in capital expenditure in Virginia since the beginning of 2018. Working in collaboration with state, regional, and local economic development partners, VEDP’s economic development activities provide jobs for Virginians and promote economic growth in the Commonwealth.
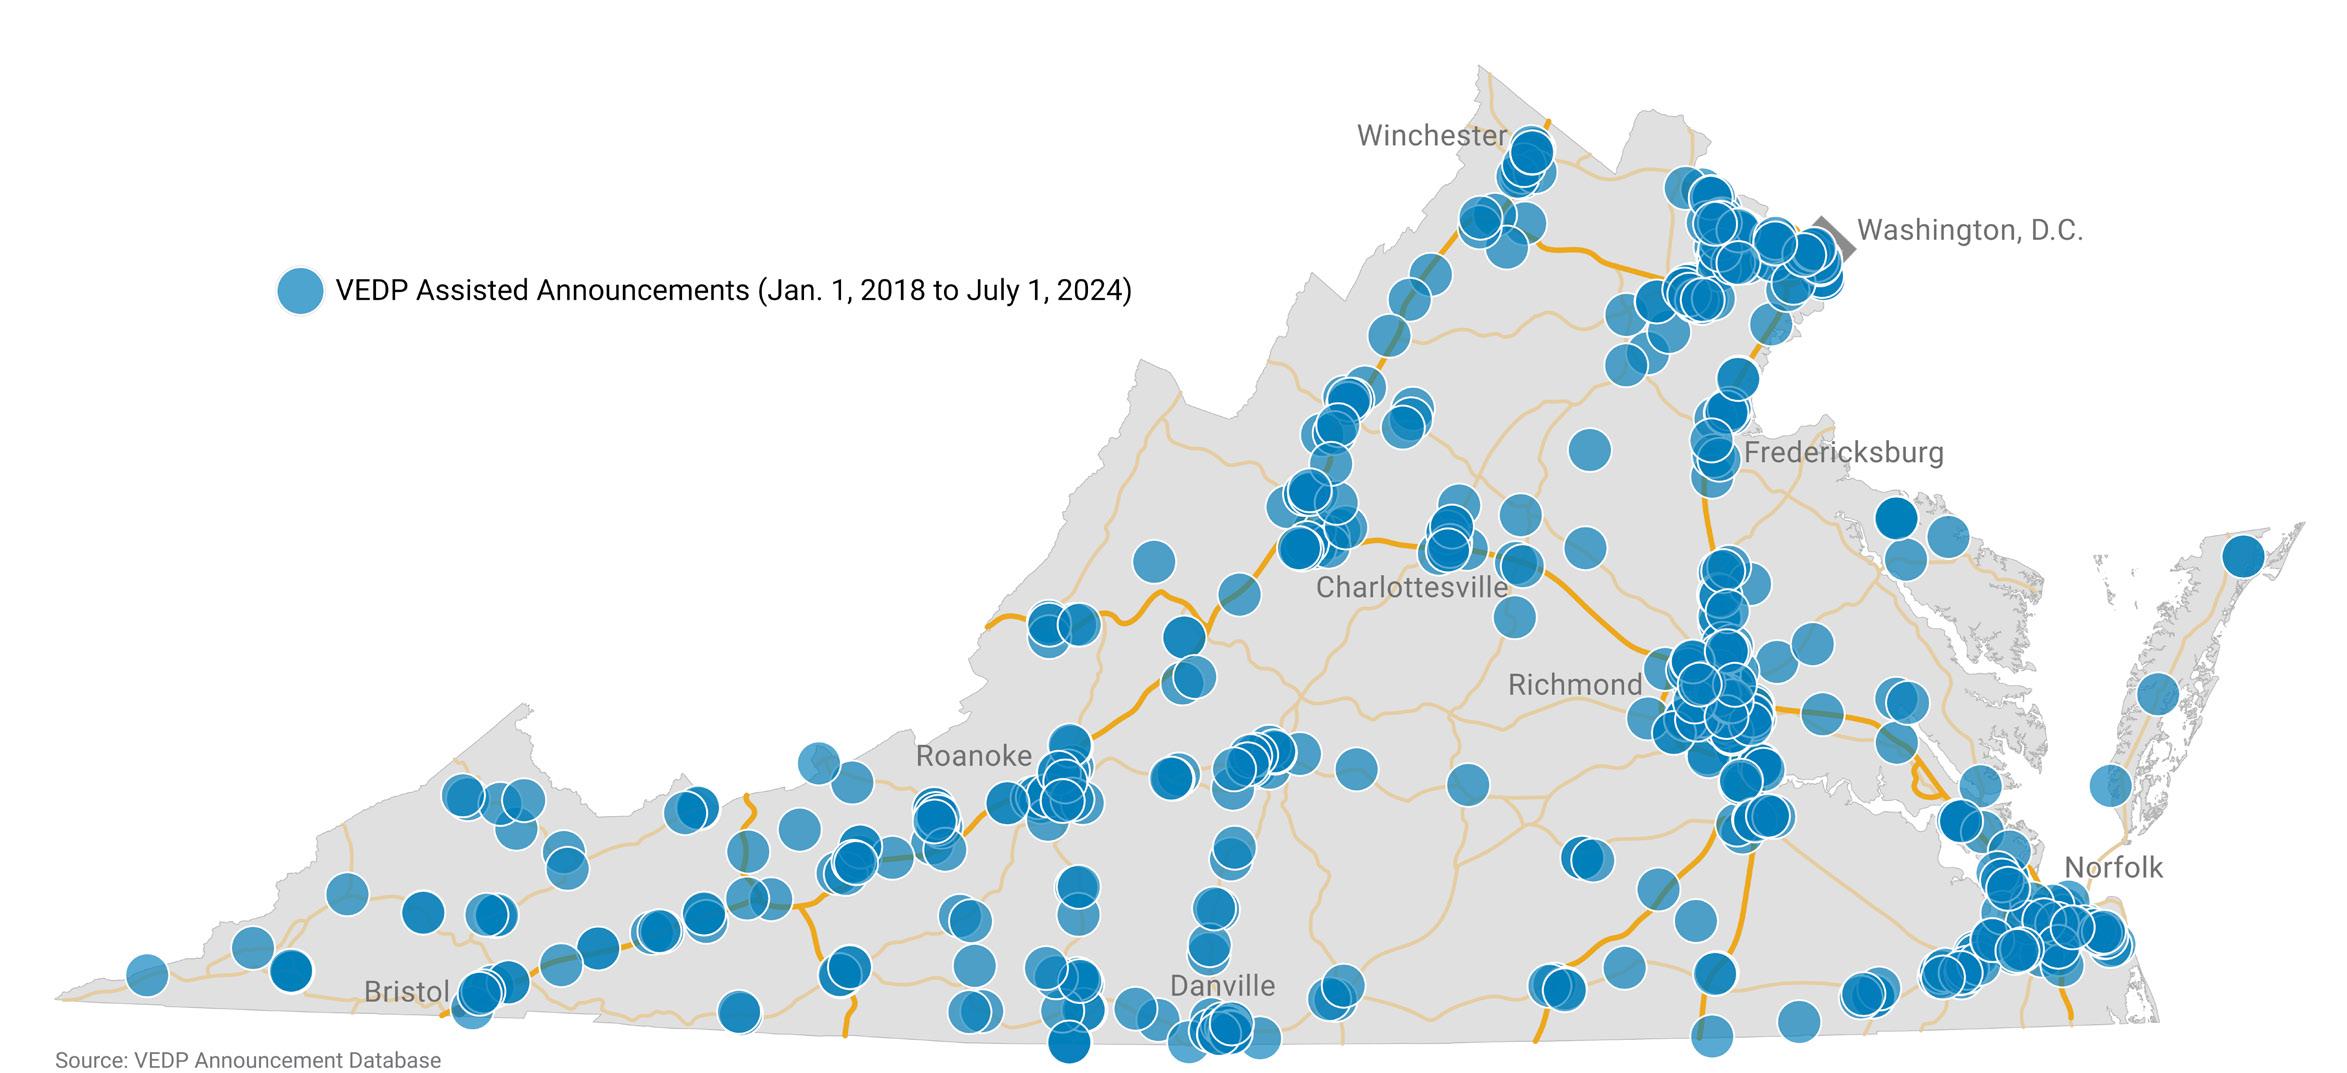

VEDP-Assisted Announcements (Jan. 1, 2018 to July 1, 2024)
620+ Project Wins ~103,000 New Direct Jobs
$103B+ in CapEx 67% Expansions*
*Percentage of projects that are expansion projects

Mack Trucks, Roanoke County
CASE STUDIES
Wells Fargo

Jobs: 1,100 New Jobs
CapEx: $87M
In brief: The expansion is Virginia’s largest ever non-manufacturing project west of the Blue Ridge Mountains.
Banking on Virginia: Wells Fargo Expansion to Create 1,100 New Jobs in the Roanoke Region
VIRGINIA’S BANKING BOOST
WELLS FARGO & COMPANY is a leading financial services company that has approximately $1.9 trillion in assets, proudly serves one in three U.S. households and more than 10% of small businesses in the United States, and is a leading middle-market banking provider in the United States.
Wells Fargo provides a diversified set of banking, investment, and mortgage products and services, as well as consumer and commercial finance, through four reportable operating segments: consumer banking and lending, commercial banking, corporate and investment banking, and wealth and investment management. Wells Fargo ranked No. 47 on Fortune’s 2023 rankings of America’s largest corporations.
In 2023, the team at Wells Fargo realized exponential growth was on the horizon and began seeking the right location to enhance and expand its customer service experience. Wells Fargo first established its customer support operation in Roanoke County in 2008 and had firsthand knowledge of the region’s strong pool of talent that could support an expansion of this magnitude.
THE VIRGINIA SOLUTION INVESTING IN A PRODUCTIVE COMMUNITY
The Roanoke Region of Virginia is the largest metropolitan area in western Virginia. The workforce ranges beyond the boundaries of the region, comprising a total labor pool of more than 300,000 people. There are 25 colleges and universities and more than 100,000 undergraduate and graduate students within a 60-minute radius of the region, ensuring a stable long-term workforce pipeline. With a cost of living below the national average, a diverse arts and cultural community, and nationally recognized outdoor recreation, the Roanoke Region easily attracts and retains talent. The Virginia Employment Commission estimates that employment in the region will increase through 2028, which means an increase in skilled job seekers and businesses seeking workers.
A deep bench of talent ensures that businesses like Wells Fargo will find a ready workforce for growing Virginia operations. The company was already one of the largest private employers in Roanoke County, and was confident that its successful operation could become an even larger hub.
Nuclear Energy Powerhouse Doubles Down on Virginia: Framatome Expands in Lynchburg
FOR MORE THAN 60 YEARS, Framatome, Inc., an international leader in nuclear energy, has called Virginia home. The company, once part of Babcock & Wilcox (B&W), first became one of the Lynchburg Region’s leading employers in 1956 when it opened a plant to manufacture nuclear fuel elements, cores, and other reactor parts. It was the first privately financed nuclear facility built in the United States.
France-based Framatome ANP and B&W became partners in the commercial nuclear fuel business in 1987, followed in 1989 by another partnership providing technical services to the nuclear power industry. Framatome ANP acquired total interest in these joint ventures in 1993.
During the company’s decades-long tenure in Lynchburg, Framatome has time and again chosen Virginia as the location to expand its business. In 2018, Framatome announced the relocation of its North American headquarters from Charlotte, N.C., to the City of Lynchburg. When demand surged for servicing existing nuclear power plants and developing solutions for advanced and small modular reactors, Framatome turned to its reliable, long-term business partner, Virginia, for expansion, announcing plans to expand its Lynchburg facilities in 2023 to meet increasing demand.
THE VIRGINIA SOLUTION INNOVATION AT HOME
Framatome is known for its innovative solutions and high-value technology. Framatome and Virginia have that in common, as innovation is at the heart of how Virginia does business. Ranked No. 1 for education by CNBC, Virginia’s stellar universities and school systems provide a best-in-class talent pipeline to ensure companies find a ready workforce eager to fulfill new roles.
In addition, the Virginia Talent Accelerator Program, ranked the No. 1 Customized Workforce Training program in the U.S. in 2023 and 2024 by Business Facilities, develops innovative recruitment and training solutions that accelerate a new facility’s startup. Every solution is fully customized to each client’s unique talent needs, processes, and culture, and offered at no cost to expanding companies like Framatome.
The Virginia community that has made Framatome successful in the U.S. for more than six decades was a major factor in Framatome’s decision to expand in the region. Virginia is America’s Top State for Business according to CNBC because of the partnerships like the one between the City of Lynchburg and Framatome. Whether it be through periods of economic growth or financial uncertainty, the Lynchburg Region has continued to provide a strong workforce pipeline for Framatome to thrive.
EXPONENTIAL GROWTH
The nuclear sector has grown exponentially over the past five years, representing nearly 40,000 jobs in the U.S. in 2023. Virginia has strong growth in all key subsectors that supply materials and products to the nuclear industry. In all identified critical subsectors, Virginia is growing even faster than the nation overall. In some of these sectors, Virginia’s growth outpaces the national average by a large margin. For example, in the inorganic chemicals manufacturing industry, Virginia’s job growth is nearly 60 points ahead of the industry’s growth across the United States.
In December 2023, Framatome announced plans to invest $49.4 million to expand, modernize, and enhance its facilities in the City of Lynchburg to meet increased demand. Virginia successfully competed with North Carolina and Pennsylvania for the project, which is creating 515 new jobs.

Framatome
Jobs: 515 New Jobs CapEx: $49.4M
In brief: Framatome first came to Virginia through an acquisition in 1989 and moved its U.S. headquarters from North Carolina to Lynchburg in 2018. The company announced a $49.4 million expansion in 2023.
Press Glass

Jobs: 335 New Jobs
CapEx: $155.2M
In brief: Press Glass’s expansion at Commonwealth Crossing marks the largest single capital investment by a business in Henry County history.
Virginia: The Clear Choice for Press Glass
PRIMED FOR EXPANSION
POLAND-BASED PRESS GLASS, INC., the largest independent glass fabricator in Europe, first announced its Virginia location in 2018. That investment to build a manufacturing facility in Henry County created 212 new jobs for local citizens. By 2023, the company was ready to expand its U.S. operation to meet the increasing demand for its state-of-the-art glass products.
Press Glass’s handiwork can be admired all over the world. From Oslo’s Barcode to the skyscrapers of New York, Press Glass has made a name for itself as a leading glass manufacturer for industrial projects worldwide. Headquartered in Konopiska, Poland, Press Glass was founded in 1991 and has 15 factories in Europe and the United States. As the largest independent flat glass processing operation in Europe, the company processes glass for fabricators of windows and doors, facades, and interior glass constructions.
After nearly five years at its manufacturing location in Henry County, Press Glass knew it was preparing for a major expansion. The company needed space for an additional 360,000-sq.-ft. building to bolster its U.S. presence, access to a premier talent base, and an advantageous location with robust infrastructure to manufacture glass for the commercial construction industry. Virginia delivered.
THE VIRGINIA SOLUTION CUTTING-EDGE TALENT
Southern Virginia is a region built on manufacturing that delivers strategic access to markets, a skilled talent pool, and innovative, targeted workforce training. Business in Henry County thrives on a community built on a strong work ethic, which was a major factor in the decision for Press Glass. The company had spent years contributing to the region’s thriving manufacturing sector, and seized the opportunity to solidify that relationship. Southern Virginia is located along the Virginia-North Carolina line at the foothills of the Blue Ridge Mountains. An excellent highway system coupled with easy access to interstates make the region extremely well-suited to reach Mid-Atlantic markets and international shipping facilities. The region offers a direct route to the The Port of Virginia’s Hampton Roads facilities, and from there, the Atlantic Ocean.
One in every five people employed in Martinsville-Henry County work in manufacturing. This powerhouse pipeline for talent delivered experienced employees for Press Glass in 2018, and helped win the project for Virginia in 2023.
Our clients have trusted us and recognized the high quality of Press Glass products, so the expansion of the factory in Ridgeway is a natural step to increase the availability of our offerings and strengthen our position in the American market. Administration of Governor Glenn Youngkin | Martinsville-Henry County Economic Development Corporation Henry County | Virginia Department of Housing and Community Development
MACIEJ MIGALSKI President, Press Glass, Inc.
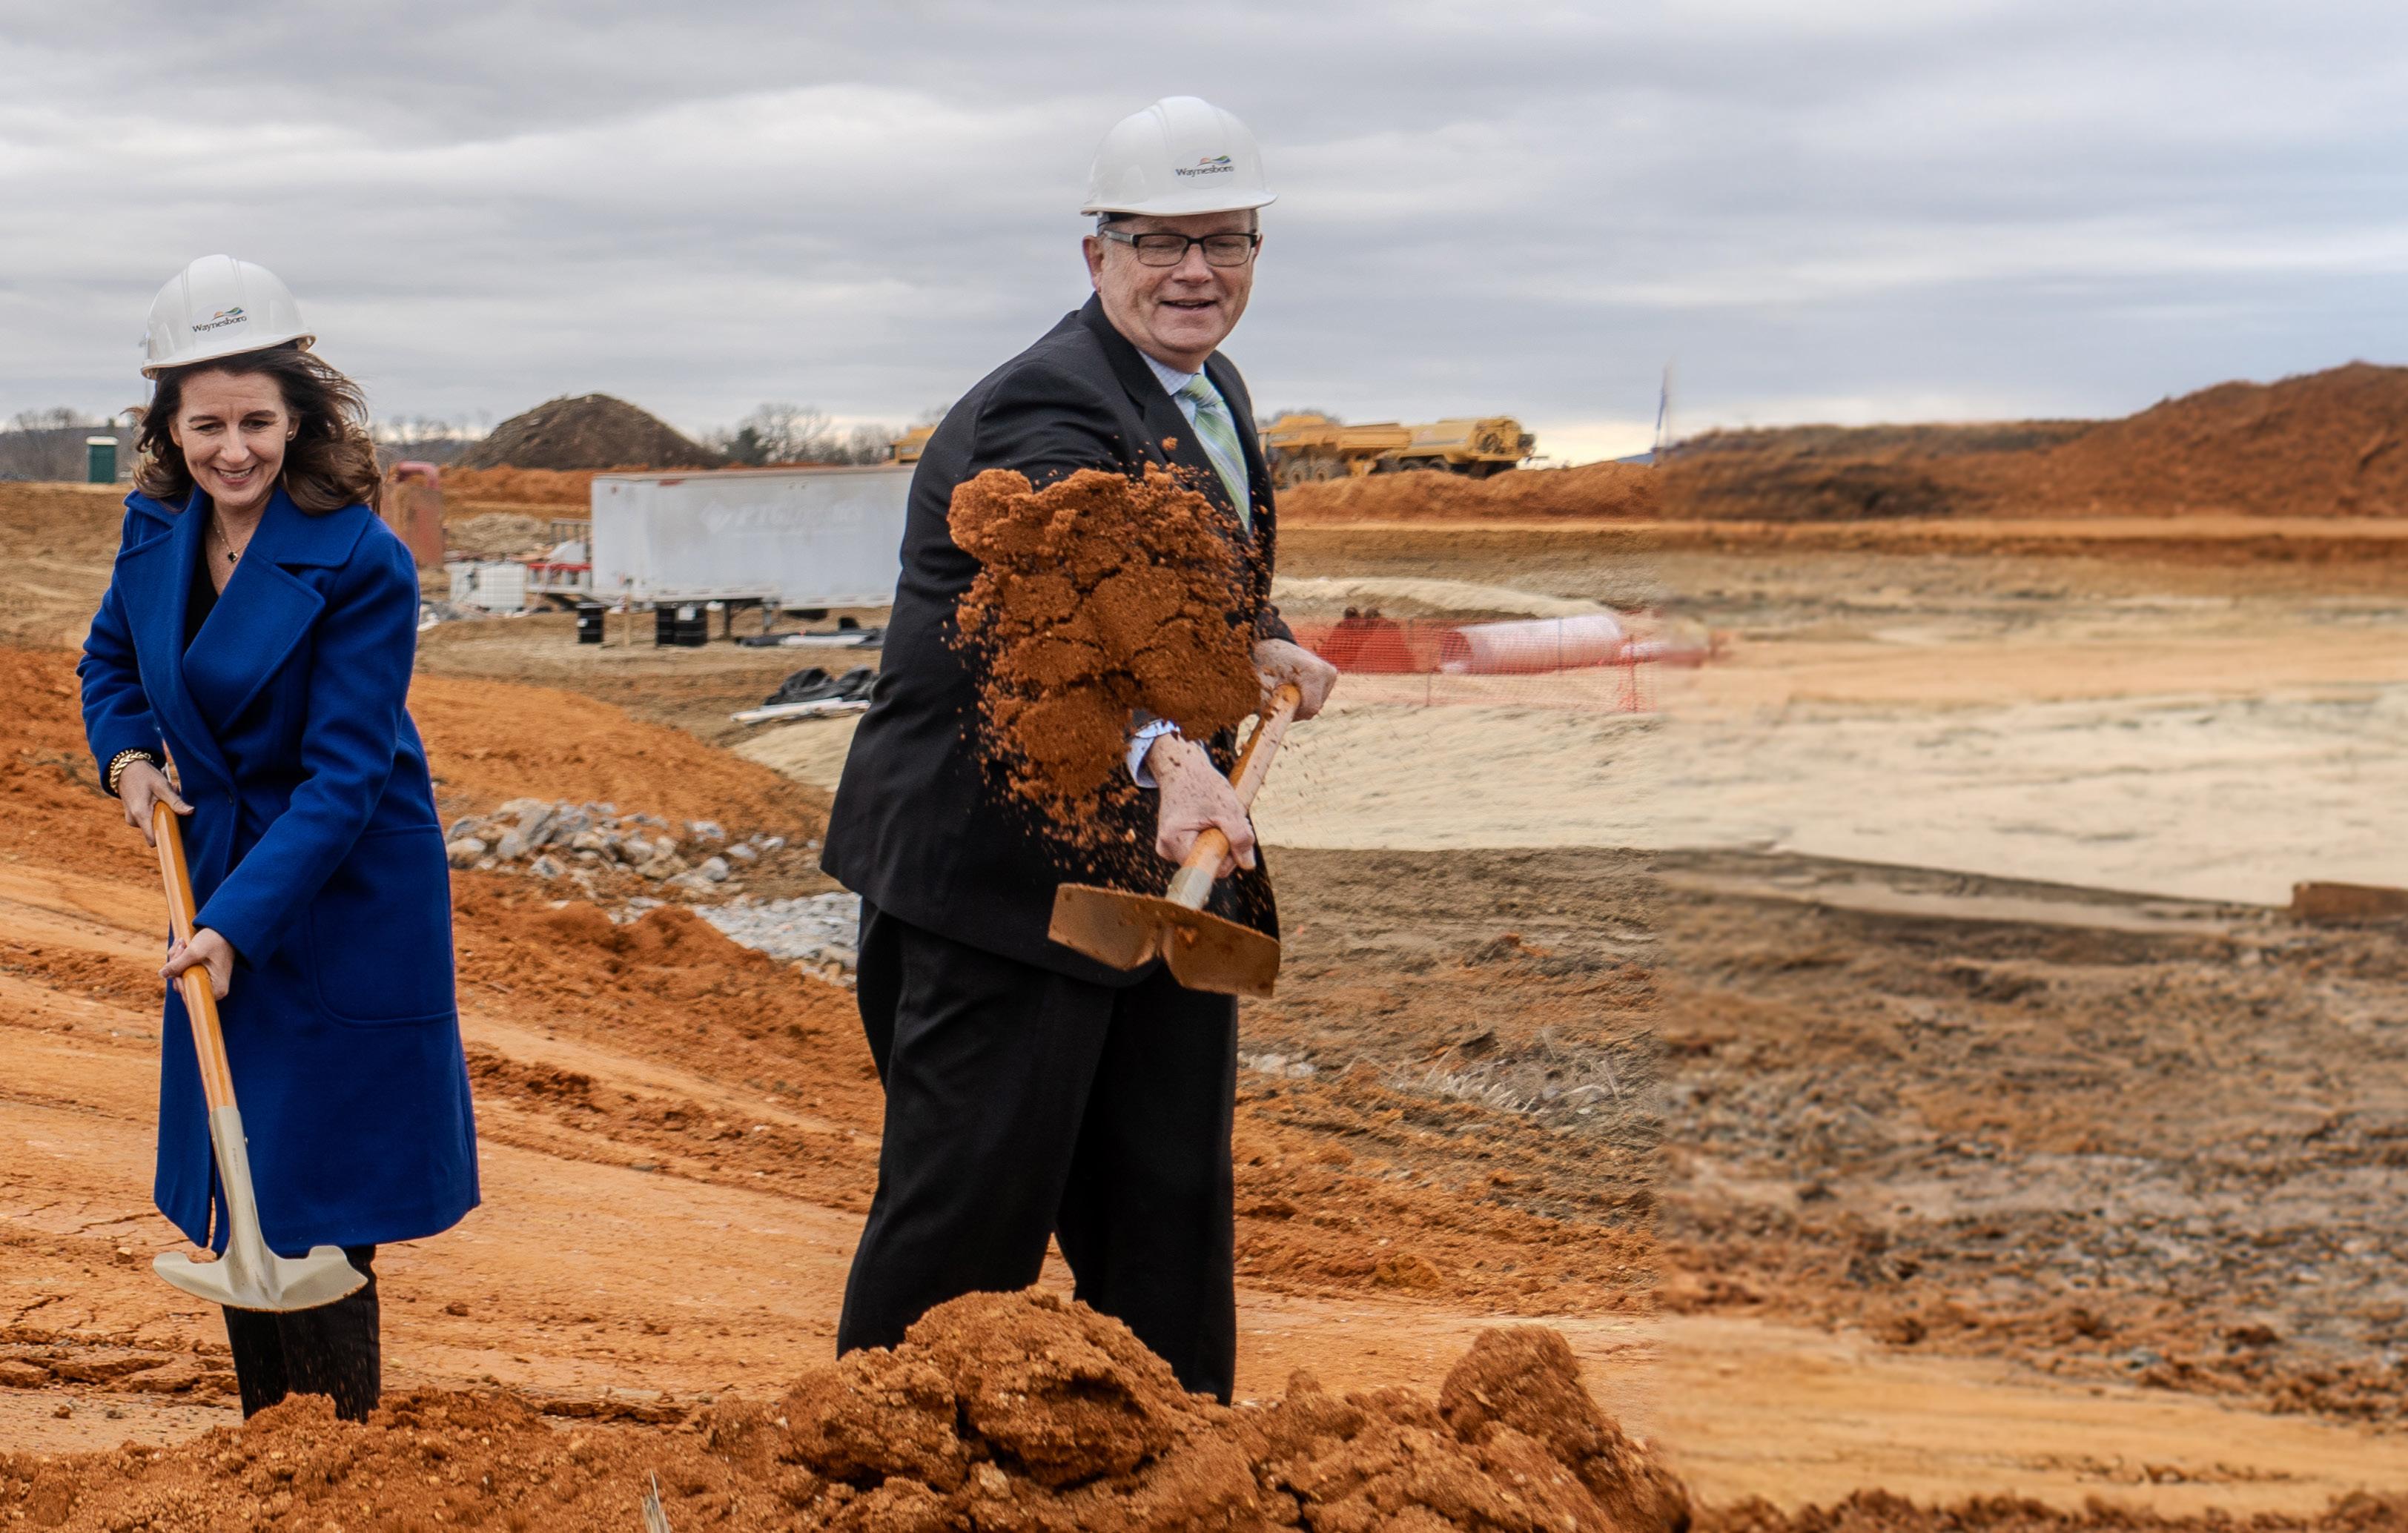
Northrop Grumman Bets on Virginia’s Workforce: Waynesboro Facility Provides High-End Tech Jobs
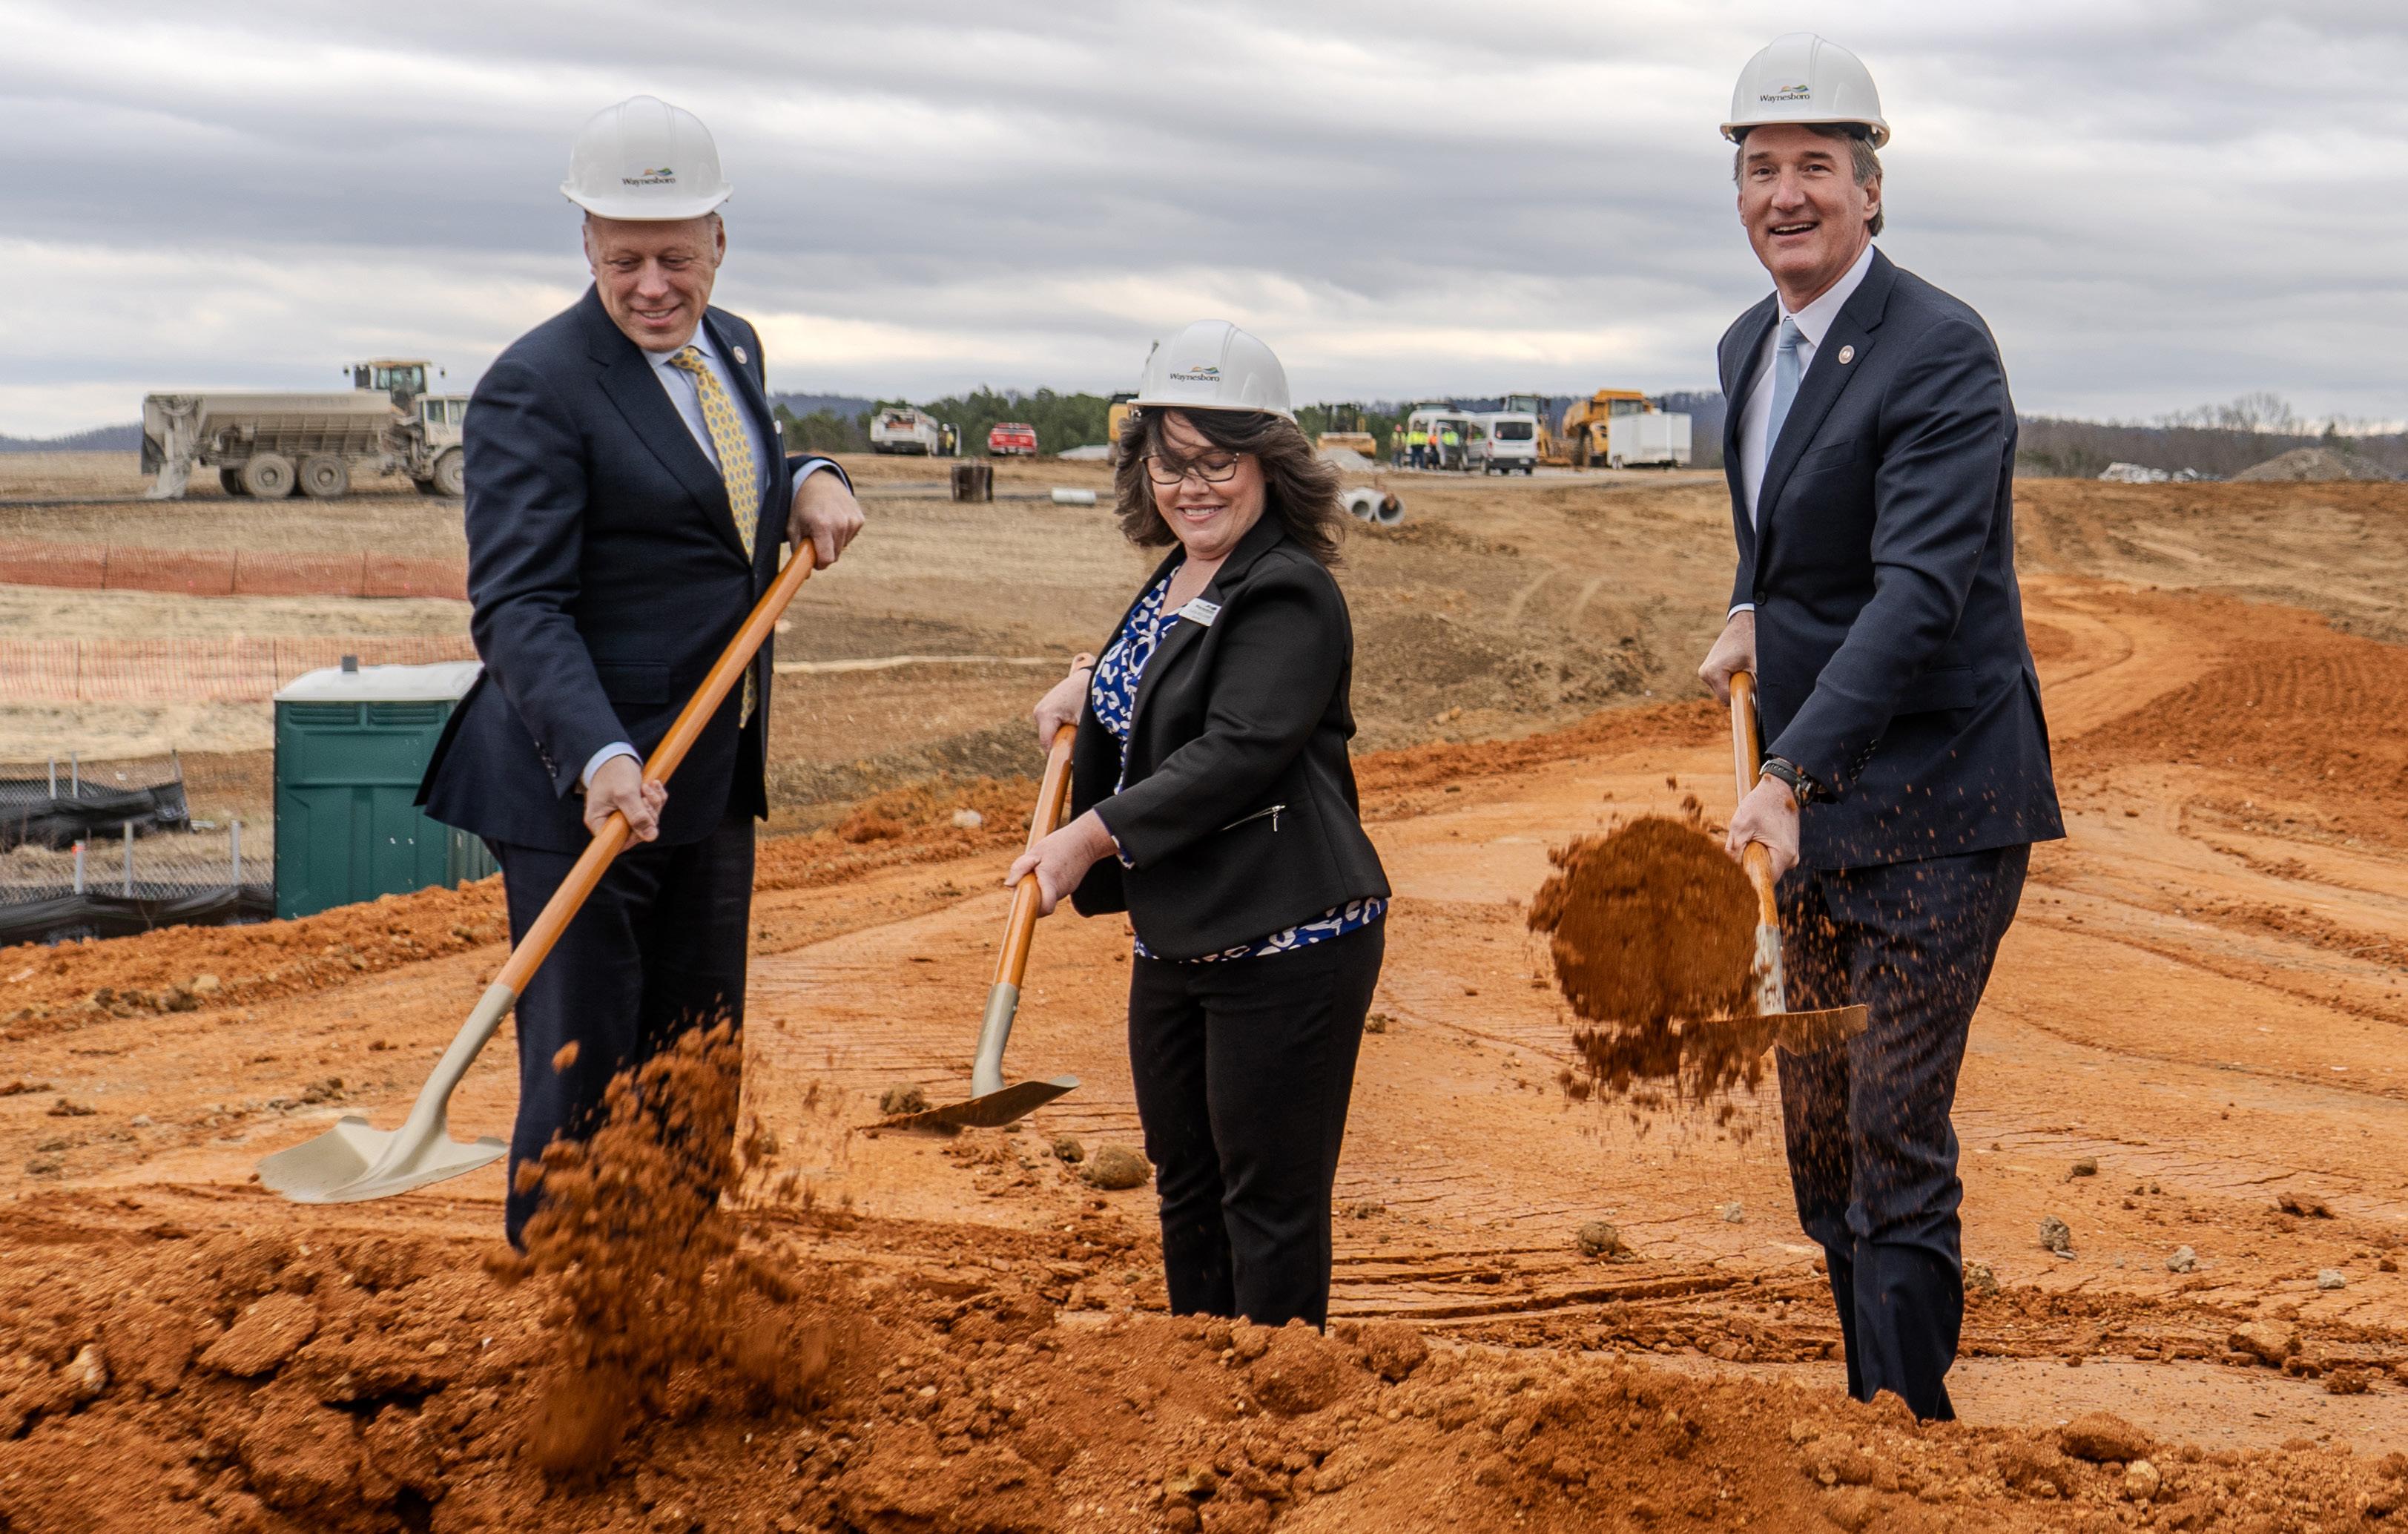
NORTHROP GRUMMAN CORPORATION, a global aerospace and defense technology company, announced plans to invest more than $200 million to build a new advanced electronics manufacturing and testing facility in the City of Waynesboro. This expansion will create more than 300 new high-end technology jobs and commerce opportunities to support the region over the next few years as the state-of-the-art facility is fully established.
Northrop Grumman broke ground on the 63-acre Waynesboro site in February. Construction of the 314,000-sq.-ft. plant is expected to be completed by 2025, and production is forecasted to start in 2026. Located a couple of hours from Northrop Grumman’s Fairfax County headquarters, the new Waynesboro facility adds to the company’s growing presence in the Commonwealth.
UNTAPPED TALENT
Northrop Grumman has had a presence in Virginia for more than 30 years. The company employs approximately 6,800 Virginians across the Commonwealth, with corporate headquarters in Falls Church, an office in Fairfax County, and manufacturing facilities in Loudoun County and Charlottesville. Expanding into the Shenandoah Valley and Waynesboro provides Northrop Grumman an opportunity to reach untapped talent for its new ventures.
Virginia’s talent pool will help Northrop Grumman solve some of the biggest challenges in global security and advance human discovery. The company’s implementation of digital solutions across its business is transforming how it designs,
tests, and manufactures the next generation of systems, and will drive improved performance and productivity across the company.
Among its catalogue of innovations, Northrop Grumman led the design, build, total system integration, and preparation of the observatory for launch of the James Webb Space Telescope. The engineering marvel is the world’s most powerful space telescope in human history. The company is currently developing the world’s first sixth-generation aircraft, the B-21 Raider, equipped with the most advanced capabilities in survivability, advanced networking, and rapid upgradeability.
Northrop Grumman’s engineering, manufacturing, and office facilities put Virginia’s best-in-class talent to work problem-solving for national security and space exploration. From intelligence analysis to satellite design to supply chain and communications, Northrop Grumman is driven by a shared purpose to solve customers’ toughest problems.
Northrop Grumman
Jobs: 300 New Jobs
CapEx: $200M
In brief: Northrop Grumman moved its headquarters from California to the Virginia city of Falls Church in 2011. The company’s Virginia facilities also include manufacturing facilities in Charlottesville and Loudoun County, multiple Northern Virginia offices, and aerospace facilities on Wallops Island on the Eastern Shore.
The new facility will increase capacity to manufacture and test advanced electronics and mission solutions to meet our customers’ growing needs. We are pleased to expand our technology presence in the Commonwealth.
KATHY WARDEN Chair, Chief Executive Officer, and President, Northrop Grumman Corporation
PARTNERS
Administration of Governor Glenn Youngkin | City of Waynesboro
Shenandoah Valley Partnership | Virginia Community College System
Location, Location, Location: CoStar Moves Global Headquarters to Virginia
FOUNDED IN 1987, CoStar Group, Inc., is a leading global provider of online real estate marketplaces, information, and analytics in the property markets. The company is on a mission to digitize the world’s real estate, empowering all people to discover properties, insights, and connections that improve their businesses and lives. CoStar has grown to over 6,200 employees in 14 countries and is included in the S&P 500 Index, one of the premier benchmarks of the U.S. equities market, and in the NASDAQ 100, one of the world’s preeminent large-cap indexes.
CoStar established its headquarters for research and data analytics in the City of Richmond in 2016 and now employs more than 1,000 team members, representing one of the top 25 largest employers in the city. In 2021, CoStar announced plans to build a corporate campus in Richmond, creating an additional 2,000 new jobs. The campus consists of approximately 750,000 square feet of office and retail space with a 26-story, LEED-certified office building and a six-story, multipurpose building to be used as a central location for employee amenities.
THE ‘PERFECT HOME’ IN VIRGINIA
Since establishing its headquarters for research and data analytics in 2016, and announcing a corporate campus in 2021, CoStar has experienced tremendous success. The company has developed strong partnerships with the
City of Richmond, the Commonwealth, and Virginia’s higher education institutions. When the time came to relocate the company’s global headquarters, these partnerships, combined with Virginia’s robust talent pipeline and toprated quality of life, fostered an ideal business environment for CoStar to continue its growth in the Commonwealth.
In February, 2024, CoStar announced plans to invest $20 million to relocate its global headquarters from Washington, D.C. to Arlington County. The company purchased a 560,000-sq.-ft. office building in Rosslyn known as Central Place Tower, and will occupy 150,000 square feet of commercial office space. The move to the new headquarters includes 500 relocated jobs and 150 new jobs to the Commonwealth.
“The financially strategic acquisition of this building will provide the perfect home for the employees at our current headquarters,” said CoStar Group Founder and Chief Executive Officer Andy Florance.
The ability to create an inclusive, welcoming hub not just for CoStar, but also for the community, was a key tenet in the company’s growth plan. CoStar’s decision to expand its presence in Virginia is a testament to the Commonwealth’s leadership in innovation and exceptional business climate. Administration of Governor Glenn Youngkin | Arlington County


CoStar Group
Jobs: 650 New Jobs CapEx: $20M
In brief: The CoStar Group’s headquarters move from Washington, D.C. to Arlington County is the company’s second major Virginia announcement in the last five years after a 2,000-job announcement in Richmond in 2021.
Progress Report
This section offers an update on the progress made by the Virginia Economic Development Partnership Authority (VEDP) in FY24 relative to VEDP’s Strategic, Operational, and Marketing Plans. These plans were previously submitted in accordance with the Code and other requirements. Due to the confidentiality of these plans and their exclusion from mandatory disclosure provisions (Code of Virginia § 2.2-3705.7.33), this progress report references specific elements of the plans without revealing information that is protected by the Code for competitive purposes.
STRATEGIC PLAN (FY21–FY25)
The Strategic Plan for Economic Development of the Commonwealth of Virginia adopted by the VEDP Board in FY21 was a five-year plan (FY21–FY25) for which implementation began in January 2021. The FY21–FY25 Strategic Plan includes five transformational goals with metrics to measure progress toward achieving those goals. Virginia has made major strides in accomplishing these goals since they were established in the original 2017 Strategic Plan:
1. Robust state growth
Virginia has experienced accelerated job growth, becoming the 16th-fastest-growing state in 2024, an improvement from its 28th-place ranking in 2017; Virginia has secured over 620 VEDP-assisted project wins since 2018, bringing over 100,000 jobs and $103B in capital expenditures to the state
2. Every region wins 17 of 18 marketing regions have seen net-positive job growth since 2017
3. Best state for business
For a record sixth time, Virginia obtained the No. 1 spot in CNBC’s America’s Top States for Business rankings and has an average position of sixth across key business climate rankings
4. Top state economic development organization (EDO)
In 2023, VEDP was recognized by Development Counsellors International (DCI) as one of the leading EDOs in the nation
5. Super collaborator
VEDP has strengthened collaboration with hundreds of state, regional, and local economic development partners, regularly achieving a partner satisfaction rate of over 80%
KEY HIGHLIGHTS OF STRATEGIC PLAN IMPLEMENTATION FOR FY24:
With the support of the Administration, the General Assembly, and hundreds of partners, much progress has been made in implementing many of the initiatives detailed in the Strategic Plan. The following are just a few examples of initiative progress and accomplishments across the plan’s three strategic focus areas (not comprehensive):
Enhancing Virginia’s economic competitiveness:
■ Virginia reclaimed the No. 1 ranking in CNBC’s America’s Top States for Business rankings in 2024, up from the No. 2 spot in 2023.
■ With new state funding, VEDP awarded over $125M in Virginia Business Ready Sites Program (VBRSP) grants to over 20 site development projects across the Commonwealth, representing the largest investment grant round to date.
■ With continued state support, the Virginia Talent Accelerator Program solidified its status as the national leader for customized talent solutions, ranking No. 1 in the U.S. for Customized Workforce Training in the annual Business Facilities State Rankings Report for the second consecutive year.
■ With new state funding, VEDP identified new megasites and conducted analysis to estimate state and local ROI for new site development through the Virginia Business Ready Sites Acquisition Program.
■ With VEDP support, the General Assembly passed legislation to establish the Virginia Business Ready Expedited Permitting Program to streamline permitting timelines for select economic development projects. The Governor signed this legislation in April 2024.
■ VEDP collaborated with partners and companies on over 15 federal grant applications in FY24, generating over $300M in project-specific federal grants and tax incentives for companies locating in Virginia and more than $3.5M in grant funding for partner organizations.
Enhancing VEDP’s capabilities:
■ With support from the Administration and the General Assembly, VEDP began implementation of the Innovative Framework for Economic Growth, establishing three dedicated sector teams to drive growth in the Knowledge Work, Manufacturing, and Logistics sectors.
■ Development Counsellors International’s 2023 “Winning Strategies in Economic Development Marketing” report recognized VEDP as a best-in-class economic development organization (top five in the nation).
■ VEDP established the Regional Talent Solutions and Business Outreach division in FY23 to engage key businesses across the Commonwealth and address their talent and growth needs; in its first year, the division made 415 visits to companies across all of Virginia’s regions.
■ VEDP’s International Trade team received the 2024 President’s “E Star” Award from the U.S. Department of Commerce, the nation’s highest honor for exporters and those who provide export services.
■ With new state funding and support from the Administration, VEDP opened a Taiwan trade office focused on foreign direct investment and export assistance.
Cultivating target industry growth clusters:
■ Working in collaboration with state, regional, and local partners, VEDP-assisted projects resulted in over 8,200 announced jobs and $8.2B in capital investment in FY24.
■ Wells Fargo invested $87M to modernize and expand its customer support center in Roanoke County, creating 1,100 new jobs. This announcement marks Virginia’s largest-ever non-manufacturing project west of the Blue Ridge Mountains.
■ Amazon announced plans to build 1,100-job state-of-the-art operations facilities in the City of Virginia Beach.
■ CoStar Group relocated its 650-job corporate headquarters from Washington, D.C. to Arlington County.
STRATEGIC PLAN UPDATE (FY25–FY29)
In FY24, VEDP updated its Strategic Plan and transformational goals in accordance with the Code of Virginia (§ 2.2-205 and § 2.2-2237.1), which requires a biennial update. The FY25–FY29 Strategic Plan includes the following five transformational goals, with implementation beginning in FY25:
1. Robust state growth: Position Virginia to achieve a growth rate among that of the top 10 states in the U.S.
2. Every region wins: Ensure that every region participates in the growth of the Commonwealth
3. CNBC’s America’s Top States for Business: Cultivate a leading business climate and sector-specific ecosystems
4. Top state for talent: Establish Virginia as a top state for talent retention, attraction, development, and alignment
5. Most innovative, collaborative, and effective state EDO: Solidify VEDP’s position as one of America’s top state economic development organizations through an innovative strategy, collaborative approach, and effective outcomes

The Virginia Economic Development Partnership’s team of dedicated and knowledgeable professionals is committed to Virginia’s economic success and connects industry-leading businesses to the resources they need to make relocations and expansions successful. From site selection, customized research, cost analysis, and coordination with public and private partners to discretionary incentives and workforce solutions VEDP’s services are tailored to companies’ unique requirements.
To learn more about VEDP’s expertise and resources, visit vedp.org
Virginia Economic Development Partnership
Audited Basic Financial Statements
Fiscal Year 2024
INTRODUCTORY SECTION
VIRGINIA
ECONOMIC DEVELOPMENT PARTNERSHIP
Richmond, Virginia
APPOINTED OFFICIALS
As of June 30, 2024
Board of Directors
Bill Hayter, Chair
The Honorable Caren Merrick, Ex-Officio, Vice Chair
Nancy Howell Agee
Carrie Hileman Chenery
Mimi Coles
Richard “Rick” O. Harrell, III
John Hewa
Pace Lochte
Marianne Radcliff
Nick Rush
Will Sessoms
Steven David Stone
The Honorable Stephen Cummings, Ex-Officio
April Kees, Ex-Officio
Anne Oman, Ex-Officio
Stephen Edwards, Ex-Officio
President and Chief Executive Officer
Jason R. El Koubi
FINANCIAL SECTION
VIRGINIA ECONOMIC DEVELOPMENT PARTNERSHIP
MANAGEMENT’S DISCUSSION AND ANALYSIS (UNAUDITED)
AS OF JUNE 30, 2024
The Virginia Economic Development Partnership (the Partnership) management offers the readers of the Partnership’s financial statements this narrative overview and analysis of its financial activities for the fiscal year ended June 30, 2024. We encourage the reader to consider this information presented here in conjunction with the financial statements and accompanying notes.
Overview of the Financial Statements
Government-Wide Financial Statements
The government-wide financial statements are designed to provide readers with a broad overview of the Partnership in a manner similar to a private sector business.
The Statement of Net Position presents information on all of the Partnership’s assets and liabilities, with the difference between the two reported as net position Over time, increases or decreases in net position may serve as a useful indicator of whether the financial position of the Partnership is improving or deteriorating.
The Statement of Activities presents information showing how the Partnership’s net position changed during the most recent fiscal year. All changes in net position are reported as soon as the underlying event giving rise to the change occurs, regardless of the timing of the related cash flows. Thus, revenues and expenses are reported in this statement for some items that will only result in cash flows in future fiscal periods. For example, expenses that are accrued for the net pension liability in the current period are expected to be paid with future funding appropriations from the Commonwealth of Virginia (COV).
Fund Financial Statements
A fund is a grouping of related accounts that is used to maintain control over resources that have been segregated for specific activities or objectives. The Partnership, like other political subdivisions of the COV, uses fund accounting to ensure and demonstrate compliance with finance-related legal requirements. The financial activities of the Partnership are reported in governmental funds.
Governmental Funds: Governmental funds are used to account for essentially the same functions reported as governmental activities in the government-wide financial statements. However, unlike the government-wide financial statements, governmental fund financial statements focus on near-term inflows and outflows of spendable resources, as well as on balances of spendable resources available at the end of the fiscal year. Such information may be useful in evaluating the Partnership’s near-term financing requirements.
Reconciliations between Government-Wide and Fund Financial Statements
There are two reconciliations between the government-wide and the fund financial statements. The first is found on the Balance Sheet and explains the difference between the fund balance on the Balance Sheet and net position on the Statement of Net Position. The second is found on the Reconciliation of the Statement of Revenues, Expenditures, and Changes in Fund Balances of Governmental Funds to the Statement of Activities, which reconciles the difference between the net change in fund balances on the fund-based statement and the change in net position on the government-wide based statement. Both statements describe in sufficient detail the amounts and the reasons for those differences.
Government-Wide Financial Analysis
As noted earlier, net position may serve over time as a useful indicator of an organization’s financial position At the close of the fiscal year ended June 30, 2024, the Partnership had a net position of ($2,228,882) compared to a net position of $5,739,075 as of June 30, 2023 Following is an analysis of the changes in the net position of the Partnership.
Net Position
Total assets decreased this fiscal year by $9,218,224 when compared to last year due to a decrease of $7,798,010 in Current and other assets and a decrease of $1,420,214 in Capital assets, net of depreciation and amortization. The decrease in Current and other assets consists of a decrease in the Current asset, cash of $6,429,874 due to payments made related to the Virginia Business Ready Sites grant program (VBRSP) that were funded with General Fund appropriations from the COV in prior years and the continued expansion of the Lead Generation Sector Teams division, along with a decrease of $1,634,700 in the Current asset, prepaid expenses, due to the timing of various promotional activities. These decreases were offset by an increase of $131,434 in the Restricted net other postemployment asset recorded in compliance with GASB 75, Accounting and Financial Reporting for Postemployment Benefits Other Than Pension (GASB 75), related to the Partnership’s participation in the Virginia Retirement System Disability Insurance Program, an increase of $130,921 in Operating grants receivable due to the timing of reimbursement payments in connection with Federal grants, and an increase in other current assets of $4,209.
The decrease of $1,420,214 in Capital assets, net of depreciation and amortization, is due primarily to the amortization of lease and subscription-based information technology arrangement (SBITA) assets recorded in compliance with GASB Statement No. 87, Leases (GASB 87) and GASB Statement No. 96, Subscription-Based Information Technology Arrangements (GASB 96) that require the value of leases and SBITAs with non-cancellable terms in excess of twelve months be recorded on the statement of net position as right to use intangible assets, as well as normal depreciation expense on leasehold improvements, furniture, and equipment. These decreases were offset by capital asset acquisitions at the Partnership’s James Center headquarters location, including the capitalization of individual assets below the Partnership’s capitalization threshold in accordance with GASB Implementation Guide 2021-1.
Deferred outflows of resources increased by $1,556,671 This increase is due primarily to differences between expected and actual experience, and an increase in the Partnership’s FY2024 employer contributions subsequent to the measurement date related to the Partnership’s participation in the Virginia Retirement System pension and other postemployment benefit plans, recorded in compliance with GASB Statement No. 68, Accounting and Financial Reporting for Pensions (GASB 68) and GASB 75.
Total liabilities increased by $1,843,703 due to an increase in Current and other liabilities of $644,369. This increase is due primarily to an increase of $533,921 in Accounts payable related to the timing of payment transactions at the end of the fiscal year, as well as a net increase of $110,448 in other current liabilities. Non-current liabilities increased $1,199,334 due primarily to an increase of $2,665,686 related to the Partnership’s Net pension liability, offset by a decrease of $1,777,667 in Long-term lease and SBITA liability related to amortization of assets recorded in compliance with GASB 87 and GASB 96, along with a net increase of $311,315 in other non-current liabilities.
Deferred inflows of resources decreased by $1,537,299. This decrease is due mainly to differences between expected and actual experience, and differences between projected and actual earnings on plan investments related to the Partnership’s participation in the Virginia Retirement System pension and other postemployment benefit plans, recorded in compliance with GASB 68 and GASB 75.
Net investment in capital assets consists primarily of right to use intangible lease and SBITA assets, leasehold improvements, furniture, computers, and technology equipment used to deliver program services to clients, net of long-term lease and SBITA liability The Partnership considers technology a vital asset in its efforts to market Virginia and will continue to invest in technology to ensure that its equipment and software are updated to take advantage of the latest data handling capabilities and processing speeds.
Restricted Net position represents the portion of fund balance related to the Restricted net other postemployment asset recorded in compliance with GASB 75 due to the Partnership’s participation in the Virginia Retirement System Disability Insurance Program. The remaining Net position balance of
($4,692,135) is classified as unrestricted. The Partnership has recorded $19,043,679 of net pension liability and net other postemployment benefits liabilities that are expected to be paid with future appropriations from the COV. The Partnership’s Current and other assets exceed its Current and other liabilities by $8,110,484. Changes in Net Position
(Decrease) in net
(8,339,301) 1,991,128 (10,330,429) Beginning net position, as restated (Note 1)
3,747,947 2,362,472 Ending net position ($2,228,882) $ 5,739,075 ($7,967,957)
Net position for the Partnership decreased by $7,967,957 during the current fiscal year The total revenues increase of $676,415 is due primarily to a $417,651 increase in federal Operating grants revenue related to the International Trade State Trade Expansion Program (STEP) grant and the Virginia Office of Education Economics (VOEE) Workforce Data Quality Initiative (WDQI) grant.
Total expenses for the Partnership increased by $11,006,844 This increase is due primarily to expansion of the Lead Generation Sector Teams division, continued expansion of the Talent Solutions – Talent Accelerator Program and the International Trade division, as well as increased Pass-Through Payments
for the VBRSP. These increases were offset by a reduction in Administration related to an economic development strategy and roadmap project that was completed in FY2023.
Governmental Funds Analysis
The Partnership records all its financial activities in the General Fund, with the exception of International Trade and VOEE federal and other grant programs that are recorded in the Special Revenue Fund. The fund balance of the General Fund of the Partnership decreased by $8,382,703 in FY2024 primarily due to the decrease in Cash and Prepaid expenses, offset by an increase in current liabilities, primarily in Accounts payable, resulting in a fund balance of $10,576,284 as of June 30, 2024 $787,907 of the fund balance consists of Prepaid expenses and Lease deposits and is nonspendable, with the remaining balance of $9,788,377 unassigned. The Special Revenue fund records revenues and expenditures related to federal and other grant programs and has a fund balance of $52,477 as of June 30, 2024 Activity for the Special Revenue fund increased from $1,342,305 in FY2023 to $1,520,788 in FY2024 due to the timing of payments for the VOEE Virginia Skills Initiative grant, the VOEE WDQI grant, and the International Trade STEP grant.
General and Special Revenue Fund Budgetary Highlights
The Statement of Revenues, Expenditures, and Changes in Fund Balance, Budget and Actual-Cash Basis is presented to provide information on the budget as originally prepared and the final budget on which the Partnership operated for the fiscal year. Also, the final budget is compared to the cash basis actual results by revenue source and expenditure activity. The Partnership’s budget, as originally prepared, included total revenues of approximately $53.5 million. The final budget was increased by $.2 million for additional interest income on the Partnership’s cash deposits, offset by a reduction in federal Operating grants revenue.
Actual expenditures were below the final budget by approximately $10.1 million for the fiscal year. This underspending was primarily in the Talent Solutions – Talent Accelerator Program and International Trade.
FY2025 Outlook
The Partnership received additional FY2025 COV funding related to the expansion of VOEE ($1.25 million), Lead Generation Sector Teams ($1.0 million), cyber security initiatives ($.2 million), and the VEDP office in Taiwan ($.3 million). The Partnership will continue to seek funding for other important initiatives critical to its success during the FY2026 budget cycle.
Notes to the Financial Statements
The notes provide additional information that is essential to a full understanding of the data provided in the government-wide and fund financial statements. The notes describe the nature of the Partnership’s reporting entity and the relationship to the COV as a whole, the basis on which the financial statements were prepared, and the methods used for presentation. Further, the notes provide explanations of specific accounts with significant balances.
Requests for Information
This financial report is designed to provide a general overview of the Partnership’s finances for all those with an interest. Questions concerning any of the information provided in this report or requests for additional financial information should be addressed to the President and Chief Executive Officer, Virginia Economic Development Partnership, P.O. Box 798, Richmond, Virginia, 23218-0798.
BASIC FINANCIAL STATEMENTS
VIRGINIA ECONOMICDEVELOPMENTPARTNERSHIP
STATEMENTOFNETPOSITION
Asof June30,2024 Governmental Activities
Assets
Cashandcashequivalents(Note2)12,077,032 $ Traveladvances941
Operatinggrantsreceivable345,766
Prepaidexpenses771,392
Leasedeposits (Note5)16,515
Restrictednetotherpostemploymentasset (Note13)1,032,859
Capitalassets,netof accumulateddepreciationandamortization(Note6)
Leaseholdimprovements, furniture, andequipment2,791,528
Righttouseintangibleleaseassets13,849,380
RighttouseintangibleSBITA assets206,961
Totalassets31,092,374
Deferredoutflowsof resources(Notes10, 11,12, 13,and14) 8,153,549
Totalassetsanddeferredoutflowsof resources39,245,923
Liabilities
Accountspayable1,959,270
Accruedpayroll505,965
Unearned revenue117,650
Long-termliabilitiesduewithinoneyear Compensatedabsences(Note9)1,292,021
Long-termleaseliability(Note7)2,101,822
Long-termSBITA liability(Note8)106,584
Netotherpostemploymentliability(Note14)50,709
Long-termliabilitiesdueinmorethanoneyear Compensatedabsences(Note9)555,040
Long-termleaseliability(Note7)12,964,554
Long-termSBITA liability(Note8)109,827
Netpensionliability(Note10)15,843,442
Netotherpostemploymentliability(Notes11,12, and14)3,149,528
Totalliabilities38,756,412
Deferredinflowsof resources(Notes10,11, 12,13, and14) 2,718,393
Totalliabilitiesanddeferredinflowsof resources41,474,805
Netposition
Netinvestmentincapitalassets1,565,082 Restrictedfornetotherpostemploymentasset(Note13)898,171 Unrestricted(4,692,135)
Totalnetposition(2,228,882) $
Theaccompanyingnotesareanintegralpartof thefinancialstatements.
ProgramRevenues
Netposition,June30,2024(2,228,882) $
VIRGINIAECONOMICDEVELOPMENTPARTNERSHIP
AsofJune30,2024
Amountsreportedforgovernmentalactivitiesinthe statementofnetpositionaredifferentbecause:
Capitalassetsusedingovernmentalactivities arenotfinancialresourcesand,therefore,are notreportedinthefunds.
Restrictednetotherpostemploymentassetisnot afinancialresourceand,therefore,isnot reportedinthefunds.
Deferredoutflowsanddeferredinflows associatedwithpensionandother postemploymentbenefitrelatedcostsarelongterminnatureand,therefore,notreportedinthe funds.
Noncurrentliabilities(compensatedabsences, long-termleaseliability,netpensionliability andnetotherpostemploymentobligation)are notdueandpayablewithcurrentfinancial resourcesand,therefore,notreportedinthe funds.
Totalnetpositionofgovernmentalactivities(2,228,882) $
Theaccompanyingnotesareanintegralpartofthefinancialstatements.
RECONCILIATIONOFTHESTATEMENTOFREVENUES,EXPENDITURES,AND CHANGESINFUNDBALANCESOFGOVERNMENTALFUNDS TOTHESTATEMENTOFACTIVITIES
FortheFiscalYearEndedJune30,2024
Amountsreportedforgovernmentalactivitiesinthestatementofactivitiesaredifferent because:
Netincrease(decrease)infundbalanceofthegovernmentalfunds(8,382,961) $
Governmentalfundsreportcapitaloutlaysasexpenditures.However,inthe statementofactivitiesthecostofthoseassetsisallocatedovertheirestimated usefullivesandreportedasdepreciationandamortizationexpense.Thisisthe amountbywhichdepreciationandamortizationexpenseexceededcapital outlaysinthecurrentperiod.
Someexpensesreportedinthestatementofactivities(compensatedabsences, long-termleaseliability,long-termSBITAliability,netpensionliabilityand netotherpostemploymentassetandobligation)donotrequiretheuseof currentfinancialresourcesand,therefore,arenotreportedasexpendituresin governmentalfunds.
(1,791,558)
1,835,218
Decreaseinnetpositionofgovernmentalactivities(8,339,301) $
Theaccompanyingnotesareanintegralpartofthefinancialstatements.
VIRGINIAECONOMICDEVELOPMENTPARTNERSHIP STATEMENTOFREVENUES,EXPENDITURES, ANDCHANGESINFUNDBALANCES
BUDGETANDACTUAL-CASHBASIS GENERALANDSPECIALREVENUEFUNDS
FortheFiscalYearEndedJune30,2024 SpecialVarianceswith GeneralRevenueFinalBudgetFund FundPositive OriginalFinalActualActual(Negative)
Revenues RevenueprovidedbytheGeneralFund oftheCommonwealth(Note4)
BudgetedAmounts
Fundbalance,June30,2024(Note3)$ - $ $11,552,755
$ 11,976,813 $ Theaccompanyingnotesareanintegralpartofthefinancialstatements.
NOTES TO FINANCIAL STATEMENTS
NOTES TO FINANCIAL STATEMENTS
AS OF JUNE 30, 2024
1. SUMMARY OF SIGNIFICANT ACCOUNTING POLICIES
A. Reporting Entity
The Virginia Economic Development Partnership (the Partnership) was established on July 1, 1996, by Chapter 638 of the 1995 Acts of Assembly and operates as an authority in accordance with the provisions of Chapter 22 of Title 2.2 of the Code of Virginia. The Partnership’s major activities are to encourage, stimulate, and support the development and expansion of the economy of the Commonwealth.
The Partnership is a component unit of the Commonwealth of Virginia. A separate report is prepared for the Commonwealth of Virginia, which includes all agencies, boards, commissions, and authorities over which the Commonwealth exercises or has the ability to exercise oversight authority. The Partnership is an integral part of the reporting entity of the Commonwealth of Virginia; accordingly, the Partnership’s financial statements are included in the financial statements of the Commonwealth as a discretely presented component unit.
B. Measurement Focus, Basis of Accounting, and Financial Statement Presentation
The accompanying financial statements have been prepared in accordance with generally accepted accounting principles. The Statement of Net Position and the Statement of Activities are referred to as “government-wide” financial statements and are reported using the economic resources measurement focus and the accrual basis of accounting. Revenues are recorded when earned and expenses are recorded when a liability is incurred, regardless of the timing of related cash flows. Interfund activity and balances between the General Fund and Special Revenue Fund have been eliminated in the government-wide financial statements. The Statement of Activities shows the extent that direct expenses of governmental functions are offset by program revenues. In cases where certain indirect costs have been allocated to the various divisions by headcount, program expenses will include both direct and indirect costs. Program revenues include charges for services and operating grants. Charges for services are comprised primarily of participation fees, sponsorship fees, and shared mission reimbursements Operating grants are grants awarded to the Partnership from the federal government and other sources Net investment in capital assets consists of leasehold improvements, furniture, computers and peripheral technology equipment used to deliver program services to clients, as well as right to use intangible lease assets recorded in accordance with GASB 87, Leases (GASB 87), and right to use intangible subscription assets recorded in accordance with GASB 96, Subscription-Based Information Technology Arrangements (GASB 96) Restricted Net position represents the portion of fund balance related to the Restricted net other postemployment asset recorded in compliance with GASB 75 due to the Partnership’s participation in the Virginia Retirement System Disability Insurance Program. The remaining Net position balance is classified as unrestricted.
The Balance Sheet and the Statement of Revenues, Expenditures, and Changes in Fund Balances are referred to as “governmental fund” financial statements and are reported using the current financial resources measurement focus and the modified accrual basis of accounting Revenues are recognized as soon as they are both measurable and available. Revenues are considered available when they are collectible within the current period or soon enough thereafter to pay liabilities of the current period. For this purpose, the Partnership considers revenues to be available if they are collected within 60 days of the end of the current fiscal period. Expenditures generally are recorded when a liability is incurred, as in accrual accounting. However, debt service payments and expenditures related to compensated absences are only recorded when payment is due. The Partnership reports its activities in governmental funds. The general fund is used for its primary operating fund and accounts for all financial transactions not accounted for in the special revenue funds. The special revenue fund is used to account for grant revenues and related expenditures for operating grants awarded to the Partnership by the federal government and other sources. Both the General Fund and Special Revenue Fund are reported as major governmental funds.
Fund balances for the Partnership’s governmental funds financial statements are classified in accordance with Governmental Accounting Standards Board (GASB) Statement No. 54, “Fund Balance Reporting and Governmental Fund Type Definitions.” Fund balances are classified as restricted, committed or assigned if the related resources reported in governmental funds have either externally or internally imposed restrictions on their usage. Nonspendable fund balances represent assets such as prepaid expenses and lease deposits that are unavailable to be spent on future operations. The unassigned fund balances represents the remainder of the fund balances funds.
C. Operating Grants Receivable
Operating grants receivable represents the amount due from the federal government for grants that are funded based on reimbursement of expenses paid by the Partnership.
D Prepaid Expenses
The Partnership’s prepaid expenses include amounts paid for promotional activities, other services and portions of insurance premiums for which the economic benefits had not been received as of June 30, 2024
E Capital Assets
Capital assets are defined by the Partnership as those assets with an initial cost of more than $5,000 and an estimated useful life in excess of two years. Such assets are recorded at historical cost or estimated historical cost. Donated capital assets are reported at acquisition value, measured at estimated market value at the date of donation. Capital assets are comprised of leasehold improvements, furniture, and equipment. The cost of normal maintenance and repairs that do not add to the value of the asset or materially extend asset lives are not capitalized.
Capital assets are depreciated using the straight-line method over useful lives of five to ten years.
F. Leases
The Partnership adopted GASB 87 on July 1, 2021. Beginning adjustments to record right to use intangible lease assets (lease asset) and lease liabilities had no effect on beginning net position. For new or modified contracts, the Partnership determines whether the contract is a lease. If the lease contains a non-cancellable term in excess of 12 months (including any options to extend or terminate the lease when exercise is reasonably certain), the Partnership records a lease asset and lease liability. The lease liability is measured at the present value of payments expected to be made during the lease term, and then is reduced by the principal portion of lease payments made. Lease payments are apportioned between interest expense and principal based on an amortization schedule. The lease asset is measured as the initial amount of the lease liability, adjusted for lease payments made at or before the lease commencement date, plus certain initial direct costs, then amortized on a straight line basis over a period that is the shorter of the lease term or the useful life of the asset. The Partnership reports lease assets with a present value of $50,000 or greater and an expected useful life of more than one year.
The Partnership is a lessee for non-cancellable leases of certain office space. The Partnership has recorded a lease liability and lease asset on the Statement of Net Position. Leases with an initial, non-cancellable term of 12 months or less are not recorded on the Statement of Net Position and expense is recognized as incurred over the lease term.
Key estimates and judgments related to leases include how the Partnership determines (1) the discount rate it uses to discount the expected lease payments to present value, (2) lease term, and (3) lease payments. GASB 87 requires a lessee to discount its unpaid lease payments using the interest rate implicit in the lease or, if that rate cannot be determined, its incremental borrowing rate. Since the Partnership cannot determine the interest rate implicit in its leases, the Partnership uses its estimated incremental borrowing rate as the discount rate for its leases.
The lease term for all the Partnership’s leases includes the noncancellable period of the lease plus any additional periods covered by either the Partnership’s option to extend the lease that the Partnership is reasonably certain to exercise, or an option to extend the lease controlled by the lessor
The Partnership monitors changes in circumstances that would require remeasurement of its leases and will remeasure the lease asset and liability if certain changes occur that are expected to significantly affect the amount of the lease liability.
G. Subscription-Based Information Technology Arrangements
The Partnership adopted GASB 96 on July 1, 2022. Beginning adjustments to record right to use intangible subscription-based information technology arrangement (SBITA) assets and SBITA liabilities had no effect on beginning net position. For new or modified contracts, the Partnership determines whether the contract is a SBITA. If the SBITA contains a noncancellable term in excess of 12 months (including any options to extend or terminate the lease when exercise is reasonably certain), the Partnership records a SBITA asset and SBITA liability. The SBITA liability is measured at the present value of payments expected to be made during the SBITA term, and then is reduced by the principal portion of SBITA payments made. SBITA payments are apportioned between interest expense and principal based on an amortization schedule. The SBITA asset is measured as the initial amount of the SBITA
liability, adjusted for SBITA payments made at or before the SBITA commencement date, plus certain initial direct costs, then amortized on a straight line basis over a period that is the SBITA term. The Partnership reports SBITA assets with a present value of $50,000 or greater and a subscription term of more than one year.
The Partnership has recorded a SBITA liability and SBITA asset on the Statement of Net Position. SBITAs with an initial, non-cancellable term of 12 months or less are not recorded on the Statement of Net Position and expense is recognized as incurred over the subscription term.
Key estimates and judgments related to SBITAs include how the Partnership determines (1) the discount rate it uses to discount the expected SBITA payments to present value, (2) SBITA term, and (3) SBITA payments. GASB 96 requires a subscriber to discount its unpaid SBITA payments using the interest rate implicit in the agreement or, if that rate cannot be determined, its incremental borrowing rate. Since the Partnership cannot determine the interest rate implicit in its SBITAs, the Partnership uses its estimated incremental borrowing rate as the discount rate for its SBITAs.
The subscription term for all the Partnership’s SBITAs includes the noncancellable period of the SBITA plus any additional periods covered by the Partnership’s option to extend the SBITA that the Partnership is reasonably certain to exercise.
The Partnership monitors changes in circumstances that would require remeasurement of its SBITAs and will remeasure the SBITA asset and liability if certain changes occur that are expected to significantly affect the amount of the SBITA liability.
H. Unearned Revenue
Unearned revenue includes amounts received for sponsorship and participation fees at June 30, 2024, for various events to be held in the next fiscal period.
I. Compensated Absences
Compensated absences represent the amounts of vacation, sick, and compensatory leave earned by the Partnership employees, but not taken at June 30, 2024. Compensated absences were calculated in accordance with GASB Statement No. 16, “Accounting for Compensated Absences.” This statement requires the accrual of Social Security and Medicare taxes to be paid by the Partnership on all accrued compensated absences.
J Pensions
The Virginia Retirement System (VRS) State Employee Retirement Plan is a single employer pension plan that is treated like a cost-sharing plan. For purposes of measuring the net pension liability, deferred outflows of resources and deferred inflows of resources related to pensions, and pension expense, information about the fiduciary net position of the VRS State Employee Retirement Plan; and the additions to/deductions from the VRS State Employee Retirement Plan’s fiduciary net position have been determined on the same basis as they were reported by VRS. For this purpose, benefit payments (including refunds of employee contributions) are recognized when due and payable in accordance with the benefit terms. Investments are reported at fair value.
K State Employee Health Insurance Credit Program
The VRS State Employee Health Insurance Credit Program is a single employer plan that is presented as a multiple-employer, cost-sharing plan. The State Employee Health Insurance Credit Program was established pursuant to §51.1-1400 et seq. of the Code of Virginia, as amended, and which provides the authority under which benefit terms are established or may be amended. The State Employee Health Insurance Credit Program is a defined benefit plan that provides a credit toward the cost of health insurance coverage for retired state employees. For purposes of measuring the net State Employee Health Insurance Credit Program OPEB liability, deferred outflows of resources and deferred inflows of resources related to the State Employee Health Insurance Credit Program OPEB, and the State Employee Health Insurance Credit Program OPEB expense, information about the fiduciary net position of the VRS State Employee Health Insurance Credit Program; and the additions to/deductions from the VRS State Employee Health Insurance Credit Program’s fiduciary net position have been determined on the same basis as they were reported by VRS. For this purpose, benefit payments are recognized when due and payable in accordance with the benefit terms. Investments are reported at fair value.
L. Group Life Insurance Program
The VRS Group Life Insurance Program is a multiple employer, cost-sharing plan. It provides coverage to state employees, teachers, and employees of participating political subdivisions. The Group Life Insurance Program was established pursuant to §51.1-500 et seq. of the Code of Virginia, as amended, and which provides the authority under which benefit terms are established or may be amended. The Group Life Insurance Program is a defined benefit plan that provides a basic group life insurance benefit for employees of participating employers. For purposes of measuring the net Group Life Insurance Program OPEB liability, deferred outflows of resources and deferred inflows of resources related to the Group Life Insurance Program OPEB, and Group Life Insurance OPEB expense, information about the fiduciary net position of the VRS Group Life Insurance Program OPEB and the additions to/deductions from the VRS Group Life Insurance Program OPEB’s net fiduciary position have been determined on the same basis as they were reported by VRS. In addition, benefit payments are recognized when due and payable in accordance with the benefit terms. Investments are reported at fair value.
M Disability Insurance Program
The VRS Disability Insurance Program (Virginia Sickness and Disability Program) is a single employer plan that is presented as a multiple-employer, cost-sharing plan. The Disability Insurance Program was established pursuant to §51.1-1100 et seq. of the Code of Virginia, as amended, and which provides the authority under which benefit terms are established or may be amended. The Disability Insurance Program is a managed care program that provides sick, family and personal leave and short-term and long-term disability benefits for state employees. For purposes of measuring the net Disability Insurance Program OPEB asset, deferred outflows of resources and deferred inflows of resources related to the Disability Insurance Program OPEB, and Disability Insurance Program OPEB expense, information about the fiduciary net position of the VRS Disability Insurance Program OPEB Plan and the additions to/deductions from the VRS Disability Insurance Program OPEB Plan’s net fiduciary position have been determined on the same basis as they were reported by VRS. In addition, benefit
payments are recognized when due and payable in accordance with the benefit terms. Investments are reported at fair value.
N Pre-Medicare Retiree Healthcare Plan
The Commonwealth of Virginia State Health Plans Program for Pre-Medicare Retirees (PreMedicare Retiree Healthcare Plan) is a single-employer defined benefit OPEB plan that is treated like a cost-sharing plan for financial reporting purposes. This program was established by Title 2.2, Chapter 28 of the Code of Virginia for retirees who are not yet eligible to participate in Medicare. It is the same health insurance program offered to active employees and managed by the Virginia Department of Human Resource Management. After retirement, the Partnership no longer subsidizes the retiree’s premium; however, since both active employees and retirees are included in the same pool for purposes of determining health insurance rates, retiree rates are effectively lower than what might otherwise be available outside of this benefit.
O. Deferred Inflows and Outflows of Resources
Deferred outflows of resources are defined as the consumption of net assets applicable to a future reporting period. The deferred outflows of resources have a positive effect on net position similar to assets.
Deferred inflows of resources are defined as the acquisition of net assets applicable to a future reporting period. The deferred inflows of resources have a negative effect on net position similar to liabilities.
P. Budgets and Budgetary Accounting
The Partnership’s budget was primarily established by the Appropriation Act as enacted by the General Assembly of Virginia for the fiscal year ended June 30, 2024, which is the second year of the biennium ended June 30, 2024. No payments were made to the Partnership out of the state treasury except in pursuance of appropriations made by law. Payments from the state treasury were deposited into Partnership bank accounts in accordance with the provisions of Chapter 22 of Title 2.2 of the Code of Virginia and expended for purposes as stated in those provisions. The budget is prepared on the cash basis. The budget is prepared collectively to include both the General Fund and Special Revenue Fund.
Q Fiscal Year Ended June 30, 2023 Net Position Restatement
Net Position for the fiscal year ended June 30, 2023 has been restated to comply with the requirements of GASB Implementation Guide 2021-1 that requires the capitalization of individual assets below the Partnership’s capitalization threshold but are significant in the aggregate. The restatement is as follows:
Net Position June 30, 2023 $ 5,739,075
Leasehold improvements, furniture, and equipment 646,962
Accumulated depreciation (275,618)
Adjusted Net Position June 30, 2023 $ 6,110,419
2. CASH AND CASH EQUIVALENTS
Cash and cash equivalents represent deposits not with the Treasurer of Virginia and cash in the Local Government Investment Pool (LGIP) with the Treasurer of Virginia. As of June 30, 2024, the Partnership’s deposits with the LGIP were $11,933,232 and the Partnership’s deposits not with the Treasurer of Virginia were $143,800 Cash on deposit is held in demand deposit accounts maintained for operating and payroll costs and is covered by federal depository insurance and carry no significant risk. Cash on deposit includes a deposit in European Union Euros used to pay the Partnership’s international vendors and is valued in U S dollars at cost. As of June 30, 2024, the Partnership’s holding in European Union Euros was valued at $41,088 The LGIP funds are held in pooled accounts, are considered cash equivalents and, accordingly, also carry no significant risk as defined by Statement 40 of the Governmental Accounting Standards Board. The LGIP enables governmental entities to maximize their return on investments by providing for a State administered fund where monies can be commingled for investment purposes in order to realize the economies of large-scale investing and professional funds management. The LGIP is managed in accordance with the requirements of Governmental Accounting Standards Board (GASB) Statement No. 79. The LGIP is in compliance with all of the standards of GASB Statement No. 79 and elects to report its investments for financial reporting at amortized cost. Participants in the LGIP should also report their investments in the LGIP at amortized cost. The LGIP is rated AAAm by Standard & Poor’s rating service. The Partnership deposits are secured in accordance with the provisions of the Virginia Security for Public Deposit Act § 2.2-4400 of the Code of Virginia.
3 RECONCILIATION OF BUDGETARY FUND BALANCE TO GAAP FUND BALANCE
The accompanying Statement of Revenues, Expenditures, and Changes in Fund Balances - Budget and Actual - Cash Basis – General and Special Revenue Funds presents comparisons of the legally adopted budget prepared on the cash basis with actual data prepared on the cash basis. To enhance this comparison, actual data on the cash basis is reconciled to actual data on the GAAP basis as follows:
Total all Funds
Fund balance, cash basis, June 30, 2024
$ 11,976,813
Add: Prepaid expenses and other accrued receivables 1,117,158
Less: Accrued expenses and unearned revenues (2,465,210)
Fund balance, GAAP basis, June 30, 2024 $ 10,628,761
4. REVENUE PROVIDED BY THE GENERAL FUND OF THE COMMONWEALTH
The original appropriation from the General Fund of the Commonwealth has been adjusted as follows:
Original appropriation, Chapter 2 $ 50,579,192 Add: Office of Labor Market Alignment Funding 233,600
Less: Economic Development Funding Reduction (735,000) Unallotted Funding for New and Expanding Programs (1,500,000)
Revenue provided by the General Fund of the Commonwealth $ 50,522,755
5 LEASE DEPOSITS
The Partnership maintains offices in Virginia Beach, Virginia, Munich, Germany, Tokyo, Japan, and Taipei, Taiwan. Each landlord requires a lease deposit as part of the lease agreement for those locations. The Virginia Beach lease deposit is held in U.S. dollars in a noninterest-bearing account and is valued at $400. The Munich lease deposit is held in a noninterest-bearing account in the amount of 3,720 European Union Euros and was valued at $4,254 at June 30, 2024 The Tokyo lease deposit is held in a noninterest-bearing account in the amount of 930,000 Japanese Yen and was valued at $8,593 at June 30, 2024 The Taipei lease deposit is held in U.S. dollars in a noninterest-bearing account and is valued at $3,268.
Capital asset activity for the fiscal year ended June 30, 2024, was as follows: Capital Assets Being Depreciated or Amortized
Less accumulated depreciation and amortization for:
Capital assets, net of accumulated depreciation and amortization $ 18,639,427 $(1,791,558) $ - $ 16,847,869
7 LONG-TERM LEASE LIABILITY
The Partnership is committed under leases for various office space through October 2030. A summary of changes in long-term lease liability for the fiscal year ended June 30, 2024 follows:
1, 2023
30, 2024
Future principal and interest payments related to the long-term lease liability as of June 30, 2024 are as follows:
8. SUBSCRIPTION-BASED INFORMATION TECHNOLOGY ARRANGEMENTS
A summary of changes in long-term SBITA liability for the fiscal year ended June 30, 2024 follows:
Balance Balance
July 1, 2023
Increases Decreases June 30, 2024
$ 207,397 $ 319,849 $ 310,835 $ 216,411
Due Within One Year (106,584)
Due in More Than One Year $ 109,827
Future principal and interest payments related to the long-term lease liability as of June 30, 2024 are as follows:
9. COMPENSATED ABSENCES
Compensated absences activity for the fiscal year ended June 30, 2024, was as follows:
Balance Balance
July 1, 2023
Increases Decreases June 30, 2024
$ 1,591,797 $ 1,434,201 $ 1,178,937 $ 1,847,061
Due Within One Year (1,292,021)
Due in More Than One Year $ 555,040
10 PENSION PLAN
General Information about the Pension Plan
Plan Description
All Partnership full-time, salaried permanent employees are automatically covered by the VRS State Employee Retirement Plan upon employment. This plan is administered by the Virginia Retirement System (the System) along with plans for other employer groups in the Commonwealth of Virginia. Members earn one month of service credit for each month they are employed and for which they and their employer pay contributions to VRS. Members are eligible to purchase prior service, based on specific criteria as defined in the Code of Virginia, as amended. Eligible prior service that may be purchased includes prior public service, active military service, certain periods of leave, and previously refunded service.
The System administers three different benefit structures for covered employees in the VRS State Employee Retirement Plan – Plan 1, Plan 2, and Hybrid. Each of these benefit structures has different eligibility criteria. The specific information for each plan and the eligibility for covered groups within each plan are set out in the table below:
RETIREMENT PLAN PROVISIONS BY PLAN STRUCTURE
PLAN 1
About Plan 1
Plan 1 is a defined benefit plan. The retirement benefit is based on a member’s age, service credit and average final compensation at retirement using a formula.
PLAN 2
About Plan 2
Same as Plan 1.
HYBRID RETIREMENT PLAN
About the Hybrid Retirement Plan
The Hybrid Retirement Plan combines the features of a defined benefit plan and a defined contribution plan.
• The defined benefit is based on a member’s age, service credit and average final compensation at retirement using a formula.
• The benefit from the defined contribution component of the plan depends on the member and employer contributions made to the plan and the investment performance of those contributions.
• In addition to the monthly benefit payment payable from the defined benefit plan at retirement, a member may start receiving distributions from the balance in the defined contribution account, reflecting the contributions, investment gains or losses, and any required fees.
Eligible Members
Employees are in Plan 1 if their membership date is before July 1, 2010, and they were vested as of January 1, 2013, and they have not taken a refund.
Eligible Members
Employees are in Plan 2 if their membership date is from July 1, 2010, to December 31, 2013, and they have not taken a refund, or their membership date is prior to July 1, 2010, and they were not vested as of January 1, 2013.
Eligible Members
Employees are in the Hybrid Retirement Plan if their membership date is on or after January 1, 2014. This includes:
• Full-time permanent, salaried state employees.*
RETIREMENT PLAN PROVISIONS BY PLAN STRUCTURE
PLAN 1
PLAN 2
HYBRID RETIREMENT PLAN
Eligible Members
• Members in Plan 1 or Plan 2 who elected to opt into the plan during the election window held January 1-April 30, 2014; the plan’s effective date for opt-in members was July 1, 2014
*Non-Eligible Members
Some employees are not eligible to participate in the Hybrid Retirement Plan. They include:
• Members of the Virginia Law Officers’ Retirement System (VaLORS)
Hybrid Opt-In Election
VRS Plan 1 members were allowed to make an irrevocable decision to opt into the Hybrid Retirement Plan during a special election window held January 1 through April 30, 2014.
The Hybrid Retirement Plan’s effective date for eligible Plan 1 members who opted in was July 1, 2014.
If eligible deferred members returned to work during the election window, they were also eligible to opt into the Hybrid Retirement Plan.
Hybrid Opt-In Election
Same as Plan 1.
Eligible Members
Those employees eligible for an optional retirement plan (ORP) must elect the ORP plan or the Hybrid Retirement Plan. If these members have prior service under Plan 1 or Plan 2, they are not eligible to elect the Hybrid Retirement Plan and must select Plan 1 or Plan 2 (as applicable) or ORP.
RETIREMENT PLAN PROVISIONS BY PLAN STRUCTURE
PLAN 1
Retirement Contributions
State employees, excluding state elected officials, and optional retirement plan participants, contribute 5% of their compensation each month to their member contribution account through a pre-tax salary reduction. Member contributions are tax-deferred until they are withdrawn as part of a retirement benefit or as a refund. The employer makes a separate actuarially determined contribution to VRS for all covered employees. VRS invests both member and employer contributions to provide funding for the future benefit payments.
Service Credit
Service credit includes active service. Members earn service credit for each month they are employed in a covered position. It also may include credit for prior service the member has purchased or additional service credit the member was granted. A member’s total service credit is one of the factors used to determine their eligibility for retirement and to calculate their retirement benefit. It also may count toward eligibility for the health insurance credit in retirement, if the employer offers the health insurance credit.
PLAN 2
Retirement Contributions
Same as Plan 1.
HYBRID RETIREMENT PLAN
Retirement Contributions
A member’s retirement benefit is funded through mandatory and voluntary contributions made by the member and the employer to both the defined benefit and the defined contribution components of the plan. Mandatory contributions are based on a percentage of the employee’s creditable compensation and are required from both the member and the employer. Additionally, members may choose to make voluntary contributions to the defined contribution component of the plan, and the employer is required to match those voluntary contributions according to specified percentages.
Service Credit
Same as Plan 1.
Service Credit
Defined
Benefit Component:
Under the defined benefit component of the plan, service credit includes active service. Members earn service credit for each month they are employed in a covered position. It also may include credit for prior service the member has purchased or additional service credit the member was granted.
RETIREMENT PLAN PROVISIONS BY PLAN STRUCTURE
PLAN 1
PLAN 2
HYBRID RETIREMENT PLAN
Service Credit
Defined Benefit Component:
A member’s total service credit is one of the factors used to determine their eligibility for retirement and to calculate their retirement benefit. It also may count toward eligibility for the health insurance credit in retirement, if the employer offers the health insurance credit.
Defined Contributions Component:
Under the defined contribution component, service credit is used to determine vesting for the employer contribution portion of the plan.
Vesting
Vesting is the minimum length of service a member needs to qualify for a future retirement benefit. Members become vested when they have at least five years (60 months) of service credit. Vesting means members are eligible to qualify for retirement if they meet the age and service requirements for their plan.
Members also must be vested to receive a full refund of their member contribution account balance if they leave employment and request a refund.
Vesting
Same as Plan 1.
Vesting
Defined Benefit Component:
Defined benefit vesting is the minimum length of service a member needs to qualify for a future retirement benefit. Members are vested under the defined benefit component of the Hybrid Retirement Plan when they reach five years (60 months) of service credit. Plan 1 or Plan 2 members with at least five years (60 months) of service credit who opted into the Hybrid Retirement Plan remain vested in the defined benefit component.
RETIREMENT PLAN PROVISIONS BY PLAN STRUCTURE
PLAN 1
Vesting Members are always 100% vested in the contributions that they make.
PLAN 2
HYBRID RETIREMENT PLAN
Vesting Defined Contributions Component:
Defined contribution vesting refers to the minimum length of service a member needs to be eligible to withdraw the employer contributions from the defined contribution component of the plan.
Members are always 100% vested in the contributions that they make.
Upon retirement or leaving covered employment, a member is eligible to withdraw a percentage of employer contributions to the defined contribution component of the plan, based on service.
• After two years, a member is 50% vested and may withdraw 50% of employer contributions.
• After three years, a member is 75% vested and may withdraw 75% of employer contributions.
• After four or more years, a member is 100% vested and may withdraw 100% of employer contributions.
Distributions not required, except as governed by law.
RETIREMENT PLAN PROVISIONS BY PLAN STRUCTURE
PLAN 1
Calculating the Benefit
The basic benefit is determined using the average final compensation, service credit and plan multiplier. An early retirement reduction is applied to this amount if the member is retiring with a reduced benefit. In cases where the member has elected an optional form of retirement payment, an option factor specific to the option chosen is then applied.
Average
Final Compensation
A member’s average final compensation is the average of their 36 consecutive months of highest compensation as a covered employee.
Service Retirement Multiplier
The retirement multiplier is a factor used in the formula to determine a final retirement benefit. The retirement multiplier for non-hazardous duty members is 1.70%
PLAN 2
Calculating the Benefit
See definition under Plan 1.
HYBRID RETIREMENT PLAN
Calculating the Benefit
Defined Benefit Component:
See definition under Plan 1.
Defined Contribution Component:
The benefit is based on contributions made by the member and any matching contributions made by the employer, plus net investment earnings on those contributions.
Average Final Compensation
A member’s average final compensation is the average of their 60 consecutive months of highest compensation as a covered employee.
Service Retirement Multiplier
Same as Plan 1 for service earned, purchased or granted prior to January 1, 2013. For non-hazardous duty members the retirement multiplier is 1.65% for service credit earned, purchased, or granted on or after January 1, 2013.
Average Final Compensation
Same as Plan 2. It is used in the retirement formula for the defined benefit component of the plan.
Service Retirement Multiplier
Defined Benefit Component:
The retirement multiplier for the defined benefit component is 1.00%.
For members who opted into the Hybrid Retirement Plan from Plan 1 or Plan 2, the applicable multipliers for those plans will be used to calculate the retirement benefit for service credited in those plans.
Defined Contribution Component:
Not applicable.
RETIREMENT PLAN PROVISIONS BY PLAN STRUCTURE
PLAN 1
Normal Retirement Age
Age 65.
Earliest Unreduced Retirement Eligibility
Age 65 with at least five years (60 months) of service credit or at age 50 with at least 30 years of service credit
PLAN 2
Normal Retirement Age
Normal Social Security retirement age.
HYBRID RETIREMENT PLAN
Normal Retirement Age
Defined Benefit Component: Same as Plan 2.
Defined Contribution
Component:
Members are eligible to receive distributions upon leaving employment, subject to restrictions.
Earliest Reduced Retirement Eligibility
Age 55 with at least five years (60 months) of service credit or age 50 with at least 10 years of creditable service.
Earliest Unreduced Retirement Eligibility
Normal Social Security retirement age with at least five years (60 months) of service credit or when their age and service equal 90.
Earliest Unreduced Retirement Eligibility
Defined Benefit Component:
Same as Plan 2.
Defined Contribution
Component:
Members are eligible to receive distributions upon leaving employment, subject to restrictions.
Earliest Reduced Retirement Eligibility
Age 60 with at least five years (60 months) of service credit.
Earliest Reduced Retirement Eligibility
Defined Benefit Component:
Same as Plan 2.
Defined Contribution
Component:
Members are eligible to receive distributions upon leaving employment, subject to restrictions.
RETIREMENT PLAN PROVISIONS BY PLAN STRUCTURE
PLAN 1
Cost-of-Living Adjustment (COLA) in Retirement
The Cost-of-Living Adjustment (COLA) matches the first 3% increase in the Consumer Price Index for all Urban Consumers (CPI-U) and half of any additional increase (up to 4%) up to a maximum COLA of 5%.
Eligibility:
For members who retire with an unreduced benefit or with a reduced benefit with at least 20 years of service credit, the COLA will go into effect on July 1 after one full calendar year from the retirement date.
For members who retire with a reduced benefit and who have less than 20 years of service credit, the COLA will go into effect on July 1 after one calendar year following the unreduced retirement eligibility date.
Exceptions to COLA Effective Dates:
The COLA is effective July 1 following one full calendar year (January 1 to December 31) under any of the following circumstances:
• The member is within five years of qualifying for an unreduced retirement benefit as of January 1, 2013.
• The member retires on disability.
PLAN 2
Cost-of-Living Adjustment (COLA) in Retirement
The Cost-of-Living Adjustment (COLA) matches the first 2% increase in the CPI-U and half of any additional increase (up to 2%), for a maximum COLA of 3%.
Eligibility:
Same as Plan 1.
HYBRID RETIREMENT PLAN
Cost-of-Living Adjustment (COLA) in Retirement
Defined Benefit Component: Same as Plan 2.
Defined Contribution Component: Not applicable.
Eligibility:
Same as Plan 1 and Plan 2.
Exceptions to COLA Effective Dates:
Same as Plan 1.
Exceptions to COLA Effective Dates:
Same as Plan 1 and Plan 2.
RETIREMENT PLAN PROVISIONS BY PLAN STRUCTURE
PLAN 1
Cost-of-Living Adjustment (COLA) in Retirement
Exceptions to COLA Effective Dates:
• The member retires directly from short-term or long-term disability.
• The member is involuntarily separated from employment for causes other than job performance or misconduct and is eligible to retire under the Workforce Transition Act or the Transitional Benefits Program.
• The member dies in service and the member’s survivor or beneficiary is eligible for a monthly death-in-service benefit.
The COLA will go into effect on July 1 following one full calendar year (January 1 to December 31) from the date the monthly benefit begins.
Disability Coverage
For members who are eligible to be considered for disability retirement and retire on disability, the retirement multiplier is 1.70% on all service, regardless of when it was earned, purchased or granted.
PLAN 2
HYBRID RETIREMENT PLAN
Disability Coverage
For members who are eligible to be considered for disability retirement and retire on disability, the retirement multiplier is 1.65% on all service, regardless of when it was earned, purchased or granted.
Disability Coverage
State employees (including Plan 1 and Plan 2 opt-ins) participating in the Hybrid Retirement Plan are covered under the Virginia Sickness and Disability Program (VSDP), and are not eligible for disability retirement.
RETIREMENT PLAN PROVISIONS BY PLAN STRUCTURE
PLAN 1
Disability Coverage
Most state employees are covered under the Virginia Sickness and Disability Program (VSDP), and are not eligible for disability retirement.
VSDP members are subject to a one-year waiting period before becoming eligible for non-workrelated disability benefits.
PLAN 2
Disability Coverage
Most state employees are covered under the Virginia Sickness and Disability Program (VSDP), and are not eligible for disability retirement.
VSDP members are subject to a one-year waiting period before becoming eligible for non-workrelated disability benefits.
HYBRID RETIREMENT PLAN
Disability Coverage
State employees (including Plan 1 and Plan 2 opt-ins) participating in the Hybrid Retirement Plan are covered under the Virginia Sickness and Disability Program (VSDP), and are not eligible for disability retirement.
Hybrid members (including Plan 1 and Plan 2 opt-ins) covered under VSDP are subject to a oneyear waiting period before becoming eligible for non-workrelated disability benefits.
Purchase of Prior Service
Members may be eligible to purchase service from previous public employment, active duty military service, an eligible period of leave or VRS refunded service as service credit in their Plan. Prior service credit counts toward vesting, eligibility for retirement and the health insurance credit. Only active members are eligible to purchase prior service. Members also may be eligible to purchase periods of leave without pay.
Purchase of Prior Service
Same as Plan 1.
Purchase of Prior Service
Defined Benefit Component:
Same as Plan 1, with the following exception:
• Hybrid Retirement Plan members are ineligible for ported service.
Defined Contribution Component:
Not applicable.
Contributions
The contribution requirement for active employees is governed by §51.1-145 of the Code of Virginia, as amended, but may be impacted as a result of funding provided to the Partnership by the Virginia General Assembly. Employees are required to contribute 5.00% of their compensation toward their retirement. The Partnership’s contractually required contribution rate for the year ended June 30, 2024, was 14.46% of covered employee compensation for employees in the VRS State Employee Retirement Plan. This rate was the final approved General Assembly rate which was based on an actuarially determined rate from an actuarial valuation as of June 30, 2021. The actuarially determined rate, when combined with employee contributions, was expected to finance the costs of benefits earned by employees during the year, with an additional amount to finance any unfunded accrued liability. Contributions from the Partnership to the VRS State Employee Retirement Plan were $2,956,492 and $2,444,199 for the years ended June 30, 2024 and June 30, 2023, respectively.
In June 2023, the Commonwealth made a special contribution of approximately $73.0 million to the VRS State plan. This special payment was authorized by Chapter 2 of the Acts of Assembly of 2022, Special Session I, as amended by Chapter 769, 2023 Acts of Assembly Reconvened Session, and is classified as special employer contributions. The Partnership’s proportionate share for the VRS State Employee Retirement Plan is reflected in Operating Grants and Contributions in the Statement of Activities.
Pension Liabilities, Pension Expense, and Deferred Outflows of Resources and Deferred Inflows of Resources Related to Pensions
At June 30, 2024, the Partnership reported a liability of $15,843,442 for its proportionate share of the VRS State Employee Retirement Plan Net Pension Liability. The Net Pension Liability was measured as of June 30, 2023, and the total pension liability used to calculate the Net Pension Liability was determined by an actuarial valuation performed as of June 30, 2022, and rolled forward to the measurement date of June 30, 2023. The Partnership’s proportion of the Net Pension Liability was based on the Partnership’s actuarially determined employer contributions to the pension plan for the year ended June 30, 2023, relative to the total of the actuarially determined employer contributions for all participating employers. At June 30, 2023, the Partnership’s proportion of the VRS State Employee Retirement Plan was 0.31313% as compared to 0.29036% at June 30, 2022.
For the year ended June 30, 2024, the Partnership recognized pension expense of $2,850,069 for the VRS State Employee Retirement Plan. Since there was a change in proportionate share between June 30, 2022, and June 30, 2023, a portion of the pension expense was related to deferred amounts from changes in proportion and differences between employer contributions and the proportionate share of employer contributions. Beginning with the June 30, 2022 measurement date, the difference between expected and actual contributions is included with the pension expense calculation.
At June 30, 2024, the Partnership reported deferred outflows of resources and deferred inflows of resources related to pensions from the following sources:
Differences between expected and actual experience $
Net difference between projected and actual earnings on pension plan investments - 1,108,828
Change in assumptions 209,302 -
Changes in proportion and differences between employer contributions and proportionate share of contributions
Employer contribution subsequent to the measurement date
$2,956,492 reported as deferred outflows of resources related to pensions resulting from the Partnership’s contributions subsequent to the measurement date will be recognized as a reduction of the Net Pension Liability in the fiscal year ending June 30, 2025. Other amounts reported as deferred outflows of resources and deferred inflows of resources related to pensions will be recognized in pension expense in future reporting periods as follows:
Year Ended June 30
FY 2025 $ 780,524
FY 2026 $ (236,559)
FY 2027 $ 1,320,197
FY 2028 $ 40,109
FY 2029 $ -
Actuarial Assumptions
The total pension liability for the VRS State Employee Retirement Plan was based on an actuarial valuation as of June 30, 2022, using the Entry Age Normal actuarial cost method and the following assumptions, applied to all periods included in the measurement and rolled forward to the measurement date of June 30, 2023
Investment rate of return 6.75%, net of pension plan investment expenses, including inflation
Mortality rates:
Pre-Retirement:
Pub-2010 Amount Weighted General Employee Rates projected generationally; females set forward 2 years
Post-Retirement:
Pub-2010 Amount Weighted General Healthy Retiree Rates projected generationally; 110% of rates for females
Post-Disablement:
Pub-2010 Amount Weighted General Disabled Rates projected generationally; males and females set forward 3 years
Beneficiaries and Survivors:
Pub-2010 Amount Weighted General Contingent Annuitant Rates projected generationally; 110% of rates for males and females
Mortality Improvement:
Rates projected generationally with Modified MP-2020 Improvement Scale that is 75% of the standard rate
The actuarial assumptions used in the June 30, 2022 valuation were based on the results of an actuarial experience study for the period from July 1, 2016 through June 30, 2020, except the change in the discount rate, which was based on VRS Board action effective as of July 1, 2021. Changes to the actuarial assumptions as a result of the experience study and VRS Board action are as follows:
Mortality Rates (Pre-retirement, post-retirement healthy, and disabled)
Retirement Rates
Withdrawal Rates
Disability Rates
Salary Scale
Line of Duty Disability
Discount Rate
Update to PUB2010 public sector mortality tables. For future mortality improvements, replace load with a modified Mortality Improvement Scale MP2020
Adjusted rates to better fit experience for Plan 1; set separate rates based on experience for Plan 2/Hybrid; changed final retirement ages from 75 to 80 for all
Adjusted rates to better fit experience at each year age and service through 9 years of service
No change
No change
No change
No change
Net Pension Liability
The net pension liability (NPL) is calculated separately for each plan and represents that particular plan’s total pension liability determined in accordance with GASB Statement No. 67, less that plan’s fiduciary net position. As of June 30, 2023, NPL amounts for the VRS State Employee Retirement Plan are as follows (amounts expressed in thousands):
State Employee Retirement Plan
Total Pension Liability
$ 28,411,528 Plan Fiduciary Net Position 23,351,827
Employers’ Net Pension Liability (Asset)
Plan Fiduciary Net Position as a Percentage of the
$ 5,059,701
The total pension liability is calculated by the System’s actuary, and each plan’s fiduciary net position is reported in the System’s financial statements. The net pension liability is disclosed in accordance with the requirements of GASB Statement No. 67 in the System’s notes to the financial statements and required supplementary information.
Long-Term Expected Rate of Return
The long-term expected rate of return on pension System investments was determined using a log-normal distribution analysis in which best-estimate ranges of expected future real rates of return (expected returns, net of pension System investment expense and inflation) are developed for each major asset class. These ranges are combined to produce the long-term expected rate of return by weighting the expected future real rates of return by the target asset allocation percentage and by adding expected inflation. The target asset allocation and best estimate of arithmetic real rates of return for each major asset class are summarized in the following table:
Asset
(Strategy)
* The above allocation provides a one-year expected return of 8.25%. However, one-year returns do not take into account the volatility present in each of the asset classes. In setting the long-term expected return for the System, stochastic projections are employed to model future returns under various economic conditions. These results provide a range of returns over various time periods that ultimately provide a median return of 7.14%, including expected inflation of 2.50%.
On June 15, 2023, the VRS Board elected a long-term rate of return of 6.75%, which was roughly at the 45th percentile of expected long-term results of the VRS fund asset allocation at that time, providing a median return of 7.14%, including expected inflation of 2.50%.
Discount Rate
The discount rate used to measure the total pension liability was 6.75%. The projection of cash flows used to determine the discount rate assumed that System member contributions will be made per the VRS Statutes and the employer contributions will be made in accordance with the VRS funding policy at rates equal to the difference between actuarially determined contribution rates adopted by the VRS Board of Trustees and the member rate. Through the fiscal year ending June 30, 2023, the rate contributed by the Partnership for the VRS State Employee Retirement Plan will be subject to the portion of the VRS Board-certified rates that are funded by the Virginia General Assembly, which was 102% of the actuarially determined contribution rate. From July 1, 2023, on, all agencies are assumed to continue to contribute 100% of the actuarially determined contribution rates. Based on those assumptions, the pension plan’s fiduciary net position was projected to be available to make all projected future benefit payments of current active and inactive employees. Therefore, the long-term expected rate of return was applied to all periods of projected benefit payments to determine the total pension liability.
Sensitivity of the Partnership’s Proportionate Share of the Net Pension Liability to Changes in the Discount Rate
The following presents the Partnership’s proportionate share of the VRS State Employee Retirement Plan net pension liability using the discount rate of 6.75%, as well as what the Partnership’s proportionate share of the net pension liability would be if it were calculated using a discount rate that is one percentage point lower (5.75%) or one percentage point higher (7.75%) than the current rate:
Partnership’s proportionate share of the VRS State Employee Retirement Plan Net Pension Liability
Pension Plan Fiduciary Net Position
Detailed information about the VRS State Employee Retirement Plan’s Fiduciary Net Position is available in the separately issued VRS 2023 Annual Report. A copy of the 2023 VRS Annual Report may be downloaded from the VRS website at varetire.org/pdf/publications/2023-annual-report.pdf, or by writing to the System’s Chief Financial Officer at P.O. Box 2500, Richmond, VA 23218-2500.
11. STATE EMPLOYEE HEALTH INSURANCE CREDIT PROGRAM
General Information about the State Employee Health Insurance Credit Program
Plan Description
All Partnership full-time, salaried permanent employees are automatically covered by the VRS State Employee Health Insurance Credit Program. This plan is administered by the Virginia Retirement System (the System), along with pension and other OPEB plans, for public employer groups in the Commonwealth of Virginia. Members earn one month of service credit toward the benefit for each month they are employed and for which the Partnership pays contributions to VRS. The health insurance credit is a tax-free reimbursement in an amount set by the General Assembly for each year of service credit against qualified health insurance premiums retirees pay for single coverage, excluding any portion covering the spouse or dependents. The credit cannot exceed the amount of the premiums and ends upon the retiree’s death.
The specific information about the State Health Insurance Credit Program OPEB, including eligibility, coverage and benefits is set out in the table below:
STATE EMPLOYEE HEALTH INSURANCE CREDIT PROGRAM (HIC) PLAN PROVISIONS
Eligible Employees
The State Employee Retiree Health Insurance Credit Program was established January 1, 1990 for retired state employees covered under VRS, SPORS, VaLORS and JRS who retire with at least 15 years of service credit.
Eligible employees are enrolled automatically upon employment. They include:
• Full-time and part-time permanent salaried state employees covered under VRS, SPORS, VaLORS and JRS.
Benefit Amounts
The State Employee Retiree Health Insurance Credit Program provides the following benefits for eligible employees:
• At Retirement – For state employees who retire, the monthly benefit is $4.00 per year of service per month with no cap on the benefit amount.
• Disability Retirement – For state employees, other than state police officers, who retire on disability or go on long-term disability under the Virginia Sickness and Disability Program (VSDP), the monthly benefit is $120.00 or $4.00 per year of service, whichever is higher.
For state police officer employees with a non-work-related disability who retire on disability or go on long-term disability under the Virginia Sickness and Disability Program (VSDP) the monthly benefit is $120.00 or $4.00 per year of service, whichever is higher.
For state police officers with a work-related disability, there is no benefit provided under the State Employee Retiree Health Insurance Credit Program if the premiums are being paid under the Virginia Line of Duty Act. However, they may receive the credit for premiums paid for other qualified health plans.
Health Insurance Credit Program Notes:
• The monthly Health Insurance Credit benefit cannot exceed the individual’s premium amount.
• Employees who retire after being on long-term disability under VSDP must have at least 15 years of service credit to qualify for the Health Insurance Credit as a retiree.
Contributions
The contribution requirement for active employees is governed by §51.1-1400(D) of the Code of Virginia, as amended, but may be impacted as a result of funding provided to the Partnership by the Virginia General Assembly. The Partnership’s contractually required employer contribution rate for the year ended June 30, 2024 was 1.12% of covered employee compensation for employees in the VRS State Employee Health Insurance Credit Program. This rate was the approved General Assembly rate which was based on an actuarially determined rate from an actuarial valuation as of June 30, 2021. The actuarially determined rate was expected to finance the costs of benefits earned by employees during the year, with an additional amount to finance any unfunded accrued liability. Contributions from the Partnership to the VRS State Employee Health Insurance Credit Program were $229,436 and $189,824 for the years ended June 30, 2024 and June 30, 2023, respectively.
In June 2023, the Commonwealth made a special contribution of approximately $8.5 million which was applied to the Health Insurance Credit Plan for state employees. This special payment was authorized by
Chapter 2 of the Acts of Assembly of 2022, Special Session I, as amended by Chapter 769, 2023 Acts of Assembly Reconvened Session, and is classified as a special employer contribution. The Partnership’s proportionate share is reflected in Operating Grants and Contributions in the Statement of Activities.
State Employee Health Insurance Credit Program OPEB Liabilities, State Employee Health Insurance Credit Program OPEB Expense, and Deferred Outflows of Resources and Deferred Inflows of Resources Related to State Employee Health Insurance Credit Program OPEB
At June 30, 2024, the Partnership reported a liability of $1,697,470 for its proportionate share of the VRS State Employee Health Insurance Credit Program Net OPEB Liability. The Net VRS State Employee Health Insurance Credit Program OPEB Liability was measured as of June 30, 2023 and the total VRS State Employee Health Insurance Credit Program OPEB Liability used to calculate the Net VRS State Employee Health Insurance Credit Program OPEB Liability was determined by an actuarial valuation performed as of June 30, 2022, and rolled forward to the measurement date of June 30, 2023. The Partnership’s proportion of the Net VRS State Employee Health Insurance Credit Program OPEB Liability was based on the Partnership’s actuarially determined employer contributions to the VRS State Employee Health Insurance Credit Program OPEB plan for the year ended June 30, 2023 relative to the total of the actuarially determined employer contributions for all participating employers. At June 30, 2023, the Partnership’s proportion of the VRS State Employee Health Insurance Credit Program was 0.20660% as compared to 0.19026% at June 30, 2022
For the year ended June 30, 2024, the Partnership recognized VRS State Employee Health Insurance Credit Program OPEB expense of $395,090. Since there was a change in proportionate share between measurement dates, a portion of the VRS State Employee Health Insurance Credit Program Net OPEB expense was related to deferred amounts from changes in proportionate share and differences between actual and expected contributions.
At June 30, 2024, the Partnership reported deferred outflows of resources and deferred inflows of resources related to the VRS State Employee Health Insurance Credit Program OPEB from the following sources:
$229,436 reported as deferred outflows of resources related to the State Employee HIC OPEB resulting from the Partnership’s contributions subsequent to the measurement date will be recognized as a reduction of the Net State Employee HIC OPEB Liability in the Fiscal Year ending June 30, 2025. Other amounts reported as deferred outflows of resources and deferred inflows of resources related to the State Employee HIC OPEB will be recognized in the State Employee HIC OPEB expense in future reporting periods as follows:
Year Ended June 30
FY 2025 $ 90,731
FY 2026 $ 79,740
FY 2027 $ 65,029
FY 2028 $ 40,872
FY 2029 $ 7,227
Thereafter $ -
Actuarial Assumptions
The total State Employee HIC OPEB liability for the VRS State Employee Health Insurance Credit Program was based on an actuarial valuation as of June 30, 2022, using the Entry Age Normal actuarial cost method and the following assumptions, applied to all periods included in the measurement and rolled forward to the measurement date of June 30, 2023
Investment rate of return
Mortality rates – General State Employees
Pre-Retirement:
6.75%, net of plan investment expenses, including inflation
Pub-2010 Amount Weighted General Employee Rates projected generationally; females set forward 2 years
Post-Retirement:
Pub-2010 Amount Weighted General Healthy Retiree Rates projected generationally; 110% of rates for females
Post-Disablement:
Pub-2010 Amount Weighted General Disabled Rates projected generationally; males and females set forward 3 years
Beneficiaries and Survivors:
Pub-2010 Amount Weighted General Contingent Annuitant Rates projected generationally; 110% of rates for males and females
Mortality Improvement Scale:
Rates projected generationally with Modified MP-2020 Improvement Scale that is 75% of the MP-2020 rates
The actuarial assumptions used in the June 30, 2022 valuation were based on the results of an actuarial experience study for the period from July 1, 2016 through June 30, 2020, except the change in the discount rate, which was based on VRS Board action effective as of July 1, 2021. Changes to the actuarial assumptions as a result of the experience study and VRS Board action are as follows:
Mortality Rates (Pre-retirement, post-retirement healthy, and disabled)
Retirement Rates
Withdrawal Rates
Disability Rates
Salary Scale
Line of Duty Disability
Discount Rate
Mortality rates – SPORS Employees
Pre-Retirement:
Update to PUB2010 public sector mortality tables. For future mortality improvements, replace load with a modified Mortality Improvement Scale MP2020
Adjusted rates to better fit experience for Plan 1; set separate rates based on experience for Plan2/Hybrid; changed final retirement age from 75 to 80 for all
Adjusted rates to better fit experience at each year age and service through 9 years of service
No change
No change
No change
No change
Pub-2010 Amount Weighted Safety Employee Rates projected generationally; 95% of rates for males; 105% of rates for females set forward 2 years
Post-Retirement:
Pub-2010 Amount Weighted Safety Healthy Retiree Rates projected generationally; 110% of rates for males; 105% of rates for females set forward 3 years
Post-Disablement:
Pub-2010 Amount Weighted General Disabled Rates projected generationally; 95% of rates for males set back 3 years; 90% of rates for females set back 3 years
Beneficiaries and Survivors:
Pub-2010 Amount Weighted Safety Contingent Annuitant Rates projected generationally; 110% of rates for males and females set forward 2 years
Mortality Improvement Scale:
Rates projected generationally with Modified MP-2020 Improvement Scale that is 75% of the MP-2020 rates
The actuarial assumptions used in the June 30, 2022 valuation were based on the results of an actuarial experience study for the period from July 1, 2016 through June 30, 2020, except the change in the discount rate, which was based on VRS Board action effective as of July 1, 2021. Changes to the actuarial assumptions as a result of the experience study and VRS Board action are as follows:
Mortality Rates (Pre-retirement, post-retirement healthy, and disabled)
Retirement Rates
Withdrawal Rates
Update to PUB2010 public sector mortality tables. For future mortality improvements, replace load with a modified Mortality Improvement Scale MP2020
Increased rates for ages 55 to 61, 63, and 64 with 26 or more years of service; changed final retirement age from 65 to 70
Decreased rate for 0 years of service and increased rates for 1 to 6 years of service
Disability Rates No change
Salary Scale
Line of Duty Disability
No change
No change
Discount Rate No change
Mortality rates – VaLORS Employees
Pre-Retirement:
Pub-2010 Amount Weighted Safety Employee Rates projected generationally; 95% of rates for males; 105% of rates for females set forward 2 years
Post-Retirement:
Pub-2010 Amount Weighted Safety Healthy Retiree Rates projected generationally; 110% of rates for males; 105% of rates for females set forward 3 years
Post-Disablement:
Pub-2010 Amount Weighted General Disabled Rates projected generationally; 95% of rates for males set back 3 years; 90% of rates for females set back 3 years
Beneficiaries and Survivors:
Pub-2010 Amount Weighted Safety Contingent Annuitant Rates projected generationally; 110% of rates for males and females set forward 2 years
Mortality Improvement Scale:
Rates projected generationally with Modified MP-2020 Improvement Scale that is 75% of the MP-2020 rates
The actuarial assumptions used in the June 30, 2022 valuation were based on the results of an actuarial experience study for the period from July 1, 2016 through June 30, 2020, except the change in the discount rate, which was based on VRS Board action effective as of July 1, 2021 Changes to the actuarial assumptions as a result of the experience study and VRS Board actions are as follows:
Mortality Rates (Pre-retirement, post-retirement healthy, and disabled)
Retirement Rates
Withdrawal Rates
Disability Rates
Salary Scale
Line of Duty Disability
Discount Rate
Update to PUB2010 public sector mortality tables. For future mortality improvements, replace load with a modified Mortality Improvement Scale MP2020
Increased rates at some younger ages, decreased at age 62, and changed final retirement age from 65 to 70
Adjusted rates to better fit experience at each year age and service through 9 years of service
No change
No change
No change
No change
Mortality rates – JRS Employees
Pre-Retirement:
Pub-2010 Amount Weighted General Employee Rates projected generationally; males set forward 2 years
Post-Retirement:
Pub-2010 Amount Weighted General Healthy Retiree Rates projected generationally; 95% of rates for males and females set back 2 years
Post-Disablement:
Pub-2010 Amount Weighted General Disabled Rated projected generationally
Beneficiaries and Survivors:
Pub-2010 Amount Weighted Safety Contingent Annuitant Rates projected generationally
Mortality Improvement Scale:
Rates projected generationally with Modified MP-2020 Improvement Scale that is 75% of the MP-2020 rates
The actuarial assumptions used in the June 30, 2022 valuation were based on the results of an actuarial experience study for the period from July 1, 2016 through June 30, 2020, except the change in the discount rate, which was based on VRS Board action effective as of July 1, 2021. Changes to the actuarial assumptions as a result of the experience study and VRS Board action are as follows:
Mortality Rates (Pre-retirement, post-retirement healthy, and disabled)
Retirement Rates
Withdrawal Rates
Review separately from State employees because exhibit fewer deaths. Update to PUB2010 public sector mortality tables. For future mortality improvements, replace load with a modified Mortality Improvement Scale MP-2020
Decreased rates for ages 60-66 and 70-72
No change
Disability Rates No change
Salary Scale
Discount Rate
Reduce increases across all ages by 0.50%
No change
Net State Employee HIC OPEB Liability
The net OPEB liability (NOL) for the State Employee Health Insurance Credit Program represents the program’s total OPEB liability determined in accordance with GASB Statement No. 74, less the associated fiduciary net position. As of June 30, 2023, NOL amounts for the VRS State Employee Health Insurance Credit Program are as follows (amounts expressed in thousands):
State Employee HIC OPEB Plan
Total State Employee HIC OPEB Liability
$1,102,220
Plan Fiduciary Net Position 280,599
State Employee Net HIC OPEB Liability (Asset) $ 821,621
Plan Fiduciary Net Position as a Percentage of the Total State Employee HIC OPEB Liability 25 46%
The total State Employee HIC OPEB liability is calculated by the System’s actuary, and the plan’s fiduciary net position is reported in the System’s financial statements. The net State Employee HIC OPEB liability is disclosed in accordance with the requirements of GASB Statement No. 74 in the System’s notes to the financial statements and required supplementary information.
Long-Term Expected Rate of Return
The long-term expected rate of return on VRS System investments was determined using a log-normal distribution analysis in which best-estimate ranges of expected future real rates of return (expected returns, net of VRS System investment expense and inflation) are developed for each major asset class. These ranges are combined to produce the long-term expected rate of return by weighting the expected future real rates of return by the target asset allocation percentage and by adding expected inflation. The target asset allocation and best estimate of arithmetic real rates of return for each major class are summarized in the following table:
* The above allocation provides a one-year return of 8.25%. However, one-year returns do not take into account the volatility present in each of the asset classes. In setting the long-term expected return for the System, stochastic projections are employed to model future returns under various economic conditions. These results provide a range of returns over various time periods that ultimately provide a median return of 7.14%, including expected inflation of 2.50%.
On June 15, 2023, the VRS Board elected a long-term rate of 6.75% which is roughly at the 45th percentile of expected long-term results of the VRS fund asset allocation at that time, providing a median return of 7.14%, including expected inflation of 2.50% asset allocation.
Discount Rate
The discount rate used to measure the total State Employee HIC OPEB was 6.75%. The projection of cash flows used to determine the discount rate assumed that employer contributions will be made in accordance with the VRS funding policy at rates equal to the actuarially determined contribution rates adopted by the VRS Board of Trustees. Through the fiscal year ending June 30, 2023, the rate contributed by the Partnership for the VRS State Employee Health Insurance Credit Program will be subject to the portion of the VRS Board-certified rates that are funded by the Virginia General Assembly, which was 108% of the actuarially determined contribution rate. From July 1, 2023 on, all agencies are assumed to continue to contribute 100% of the actuarially determined contribution rates. Based on those assumptions, the State Employee HIC OPEB plan’s fiduciary net position was projected to be available to make all projected future benefit payments of current active and inactive employees. Therefore, the long-term expected rate of return was applied to all periods of projected benefit payments to determine the total State Employee HIC OPEB liability.
Sensitivity of the Partnership’s Proportionate Share of the State Employee HIC Net OPEB Liability to Changes in the Discount Rate
The following presents the Partnership’s proportionate share of the VRS State Employee Health Insurance Credit Program net NIC OPEB liability using the discount rate of 6.75%, as well as what the Partnership’s proportionate share of the net HIC OPEB liability would be if it were calculated using a discount rate that is one percentage point lower (5.75%) or one percentage point higher (7.75%) than the current rate:
Partnership’s proportionate share of the VRS State Employee HIC OPEB Plan Net HIC OPEB Liability
State Employee HIC OPEB Fiduciary Net Position
Detailed information about the VRS State Employee Health Insurance Credit Program’s Fiduciary Net Position is available in the separately issued VRS 2023 Annual Comprehensive Financial Report (Annual Report). A copy of the 2023 VRS Annual Report may be downloaded from the VRS website at: https://www.varetire.org/pdf/publications/2023-annual-report.pdf or by writing to the System’s Chief Financial Officer at P.O. Box 2500, Richmond, VA, 23218-2500.
12. GROUP LIFE INSURANCE PROGRAM
General Information about the Group Life Insurance Program
Plan Description
All full-time, salaried permanent employees of the state agencies, teachers and employees of participating political subdivisions are automatically covered by the VRS Group Life Insurance Program upon employment. This plan is administered by the Virginia Retirement System (the System), along with pensions and other OPEB plans, for public employer groups in the Commonwealth of Virginia.
In addition to the Basic Group Life Insurance benefit, members are also eligible to elect additional coverage for themselves as well as a spouse or dependent children through the Optional Group Life Insurance Program. For members who elect the optional group life insurance coverage, the insurer bills employers directly for the premiums. Employers deduct these premiums from members’ paychecks and pay the premiums to the insurer. Since this is a separate and fully insured program, it is not included as part of the Group Life Insurance Program OPEB.
The specific information for the Group Life Insurance Program OPEB, including eligibility, coverage and benefits is set out in the table below:
GROUP LIFE INSURANCE PROGRAM PLAN PROVISIONS
Eligible Employees
The Group Life Insurance Program was established July 1, 1960, for state employees, teachers and employees of political subdivisions that elect the program, including the following employers that do not participate in VRS for retirement:
• City of Richmond
• City of Portsmouth
• City of Roanoke
• City of Norfolk
• Roanoke City School Board
Basic group life insurance coverage is automatic upon employment. Coverage ends for employees who leave their position before retirement eligibility or who take a refund of their accumulated retirement member contributions and accrued interest.
Benefit Amounts
The benefits payable under the Group Life Insurance Program have several components.
• Natural Death Benefit – The natural death benefit is equal to the employee’s covered compensation rounded to the next highest thousand and then doubled.
• Accidental Death Benefit – The accidental death benefit is double the natural death benefit.
• Other Benefit Provisions – In addition to the basic natural and accidental death benefits, the program provides additional benefits provided under specific circumstances. These include:
o Accidental dismemberment benefit
o Seatbelt benefit
o Repatriation benefit
o Felonious assault benefit
o Accelerated death benefit option
Reduction in Benefit Amounts
The benefit amounts provided to members covered under the Group Life Insurance Program are subject to a reduction factor. The benefit amount reduces by 25% on January 1 following one calendar year of separation. The benefit amount reduces by an additional 25% on each subsequent January 1 until it reaches 25% of its original value.
Minimum Benefit Amount and Cost-of-Living Adjustment (COLA)
For covered members with at least 30 years of service credit, there is a minimum benefit payable under the Group Life Insurance Program. The minimum benefit was set at $8,000 by statute in 2015. This will be increased annually based on the VRS Plan 2 cost-of-living adjustment calculation. The minimum benefit adjusted for the COLA was $9,254 as of June 30, 2024
Contributions
The contribution requirements for the Group Life Insurance Program are governed by §51.1-506 and §51.1508 of the Code of Virginia, as amended, but may be impacted as a result of funding provided to the Partnership by the Virginia General Assembly. The total rate for the Group Life Insurance Program was 1.34% of covered employee compensation. This was allocated into an employee and an employer component using a 60/40 split. The employee component was 0.80% (1.34% X 60%) and the employer component was 0.54% (1.34% X 40%). Employers may elect to pay all or part of the employee contribution, however the employer must pay all of the employer contribution. The Partnership’s contractually required employer contribution rate for the year ended June 30, 2024 was 0.54% of covered employee compensation. This rate was based on an actuarially determined rate from an actuarial valuation as of June 30, 2021. The actuarially determined rate, when combined with employee contributions, was expected to finance the costs of benefits payable during the year, with an additional amount to finance any unfunded accrued liability. Contributions from the Partnership to the Group Life Insurance Program were $111,077 and $91,547 for the years ended June 30, 2024 and June 30, 2023, respectively.
In June 2023, the Commonwealth made a special contribution of approximately $10.1 million to the Group Life Insurance plan. This special payment was authorized by Chapter 2 of the Acts of Assembly of 2022, Special Session I, as amended by Chapter 769, 2023 Acts of Assembly Reconvened Session, and is classified as a special employer contribution. The Partnership’s proportionate share is reflected in Operating Grants and Contributions in the Statement of Activities.
Group Life Insurance Program OPEB Liabilities, Group Life Insurance Program OPEB Expense, and Deferred Outflows of Resources and Deferred Inflows of Resources Related to the Group Life Insurance Program OPEB
At June 30, 2024, the Partnership reported a liability of $863,146 for its proportionate share of the Net Group Life Insurance Program OPEB Liability. The Net Group Life Insurance Program OPEB Liability was measured as of June 30, 2023 and the total Group Life Insurance Program OPEB Liability used to calculate the Net Group Life Insurance OPEB Liability was determined by an actuarial valuation performed as of June 30, 2022, and rolled forward to the measurement date of June 30, 2023. The Partnership’s proportion of the Net Group Life Insurance Program OPEB Liability was based on the Partnership’s actuarially determined employer contributions to the Group Life Insurance Program for the year ended June 30, 2023, relative to the total of the actuarially determined employer contributions for all participating employers. At June 30, 2023, the Partnership’s proportion was 0.07197 % as compared to 0. 06653% at June 30, 2022.
For the year ended June 30, 2024, the Partnership recognized Group Life Insurance Program OPEB expense of $109,111. Since there was a change in proportionate share between measurement dates, a portion of the Group Life Insurance Program OPEB expense was related to deferred amounts from changes in proportion.
At June 30, 2024, the Partnership reported deferred outflows of resources and deferred inflows of resources related to the Group Life Insurance Program OPEB from the following sources:
Differences between expected and actual experience
Net difference between projected and actual earnings on Group Life Insurance OPEB program investments -
Employer contribution subsequent to the measurement date
$111,077 reported as deferred outflows of resources related to the Group Life Insurance Program OPEB resulting from the Partnership’s contributions subsequent to the measurement date will be recognized as a reduction of the Net Group Life Insurance Program OPEB Liability in the Fiscal Year ending June 30, 2025. Other amounts reported as deferred outflows of resources and deferred inflows of resources related to the Group Life Insurance Program OPEB will be recognized in the Group Life Insurance Program OPEB expense in future reporting periods as follows:
Year Ended June 30
FY 2025 $ 53,685
FY 2026 $ 18,991
FY 2027 $ 57,843
FY 2028 $ 29,851
FY 2029 $ 19,854
Thereafter $ -
Actuarial Assumptions
The total Group Life Insurance Program OPEB liability was based on an actuarial valuation as of June 30, 2022, using the Entry Age Normal actuarial cost method and the following assumptions, applied to all periods included in the measurement and rolled forward to the measurement date of June 30, 2023.
rate of return 6.75%, net of plan investment expenses, including inflation
Mortality rates – General State Employees
Pre-Retirement:
Pub-2010 Amount Weighted General Employee Rates projected generationally; females set forward 2 years
Post-Retirement:
Pub-2010 Amount Weighted General Healthy Retiree Rates projected generationally; 110% of rates for females
Post-Disablement:
Pub-2010 Amount Weighted General Disabled Rates projected generationally; males and females set forward 3 years
Beneficiaries and Survivors:
Pub-2010 Amount Weighted General Contingent Annuitant Rates projected generationally; 110% of rates for males and females
Mortality Improvement Scale:
Rates projected generationally with Modified MP-2020 Improvement Scale that is 75% of the MP2020 rates
The actuarial assumptions used in the June 30, 2022 valuation were based on the results of an actuarial experience study for the period from July 1, 2016 through June 30, 2020, except the change in the discount rate, which was based on VRS Board action effective as of July 1, 2021. Changes to the actuarial assumptions as a result of the experience study and VRS Board action are as follows:
Mortality Rates (Pre-retirement, post-retirement healthy, and disabled)
Retirement Rates
Withdrawal Rates
Disability Rates
Update to PUB2010 public sector mortality tables. For future mortality improvements, replace load with a modified Mortality Improvement Scale MP2020
Adjusted rates to better fit experience for Plan 1; set separate rates based on experience for Plan 2/Hybrid; changed final retirement age from 75 to 80 for all
Adjusted rates to better fit experience at each year age and service through 9 years of service
No change
Salary Scale No change
Line of Duty Disability
Discount Rate
No change
No change
Mortality rates – Teachers
Pre-Retirement:
Pub-2010 Amount Weighted Teachers Employee Rates projected generationally; 110% of rates for males
Post-Retirement:
Pub-2010 Amount Weighted Teachers Healthy Retiree Rates projected generationally; males set forward 1 year; 105% of rates for females
Post-Disablement:
Pub-2010 Amount Weighted Teachers Disabled Rates projected generationally; 110% of rates for males and females
Beneficiaries and Survivors:
Pub-2010 Amount Weighted Teachers Contingent Annuitant Rates projected generationally
Mortality Improvement Scale:
Rates projected generationally with Modified MP-2020 Improvement Scale that is 75% of the MP2020 rates
The actuarial assumptions used in the June 30, 2022 valuation were based on the results of an actuarial experience study for the period from July 1, 2016 through June 30, 2020, except the change in the discount rate, which was based on VRS Board action effective as of July 1, 2021. Changes to the actuarial assumptions as a result of the experience study and VRS Board action are as follows:
Mortality Rates (Pre-retirement, post-retirement healthy, and disabled)
Retirement Rates
Withdrawal Rates
Update to PUB2010 public sector mortality tables. For future mortality improvements, replace load with a modified Mortality Improvement Scale MP2020
Adjusted rates to better fit experience for Plan 1; set separate rates based on experience for Plan 2/Hybrid; changed final retirement age from 75 to 80 for all
Adjusted rates to better fit experience at each year age and service through 9 years of service
Disability Rates No change
Salary Scale No change
Discount Rate No change
Mortality rates – SPORS Employees
Pre-Retirement:
Pub-2010 Amount Weighted Safety Employee Rates projected generationally; 95% of rates for males; 105% of rates for females set forward 2 years
Post-Retirement:
Pub-2010 Amount Weighted Safety Healthy Retiree Rates projected generationally; 110% of rates for males; 105% of rates for females set forward 3 years
Post-Disablement:
Pub-2010 Amount Weighted General Disabled Rates projected generationally; 95% of rates for males set back 3 years; 90% of rates for females set back 3 years
Beneficiaries and Survivors:
Pub-2010 Amount Weighted Safety Contingent Annuitant Rates projected generationally; 110% of rates for males and females set forward 2 years
Mortality Improvement Scale:
Rates projected generationally with Modified MP-2020 Improvement Scale that is 75% of the MP2020 rates
The actuarial assumptions used in the June 30, 2022 valuation were based on the results of an actuarial experience study for the period from July 1, 2016 through June 30, 2020, except the change in the discount rate, which was based on VRS Board action effective as of July 1, 2021. Changes to the actuarial assumptions as a result of the experience study and VRS Board action are as follows:
Mortality Rates (Pre-retirement, post-retirement healthy, and disabled)
Retirement Rates
Withdrawal Rates
Disability Rates
Salary Scale
Line of Duty Disability
Discount Rate
Mortality rates – VaLORS Employees
Pre-Retirement:
Update to PUB2010 public sector mortality tables. For future mortality improvements, replace load with a modified Mortality Improvement Scale MP2020
Increased rates for ages 55 to 61, 63, and 64 with 26 or more years of service; changed final retirement age from 65 to 70
Decreased rate for 0 years of service and increased rates for 1 to 6 years of service
No change
No change
No change
No change
Pub-2010 Amount Weighted Safety Employee Rates projected generationally; 95% of rates for males; 105% of rates for females set forward 2 years
Post-Retirement:
Pub-2010 Amount Weighted Safety Healthy Retiree Rates projected generationally; 110% of rates for males; 105% of rates for females set forward 3 years
Post-Disablement:
Pub-2010 Amount Weighted General Disabled Rates projected generationally; 95% of rates for males set back 3 years; 90% of rates for females set back 3 years
Beneficiaries and Survivors:
Pub-2010 Amount Weighted Safety Contingent Annuitant Rates projected generationally; 110% of rates for males and females set forward 2 years
Mortality Improvement Scale:
Rates projected generationally with Modified MP-2020 Improvement Scale that is 75% of the MP2020 rates
The actuarial assumptions used in the June 30, 2022 valuation were based on the results of an actuarial experience study for the period from July 1, 2016 through June 30, 2020, except the change in the discount rate, which was based on VRS Board action effective as of July 1, 2021 Changes to the actuarial assumptions as a result of the experience study and VRS Board action are as follows:
Mortality Rates (Pre-retirement, post-retirement healthy, and disabled)
Retirement Rates
Withdrawal Rates
Disability Rates
Salary Scale
Line of Duty Disability
Discount Rate
Mortality rates – JRS Employees
Pre-Retirement:
Update to PUB2010 public sector mortality tables. For future mortality improvements, replace load with a modified Mortality Improvement Scale MP2020
Increased rates a some younger ages, decreased at age 62, and changed final retirement age from 65 to 70
Adjusted rates to better fit experience at each year age and service through 9 years of service
No change
No change
No change
No change
Pub-2010 Amount Weighted General Employee Rates projected generationally; males set forward 2 years
Post-Retirement:
Pub-2010 Amount Weighted General Healthy Retiree Rates projected generationally; 95% of rates for males and females set back 2 years
Post-Disablement:
Pub-2010 Amount Weighted General Disabled Rates projected generationally
Beneficiaries and Survivors:
Pub-2010 Amount Weighted Safety Contingent Annuitant Rates projected generationally
Mortality Improvement Scale:
Rates projected generationally with Modified MP-2020 Improvement Scale that is 75% of the MP2020 rates
The actuarial assumptions used in the June 30, 2022 valuation were based on the results of an actuarial experience study for the period from July 1, 2016 through June 30, 2020, except the change in the discount rate, which was based on VRS Board action effective as of July 1, 2021. Changes to the actuarial assumptions as a result of the experience study and VRS Board action are as follows:
Mortality Rates (Pre-retirement, post-retirement healthy, and disabled)
Retirement Rates
Withdrawal Rates
Disability Rates
Salary Scale
Discount Rate
Review separately from State employees because exhibit fewer deaths. Update to PUB2010 public sector mortality tables. For future mortality improvements, replace load with a modified Mortality Improvement Scale MP-2020
Decreased rates for ages 60-66 and 70-72
No change
No change
Reduce increases across all ages by 0.50%
No change
Mortality rates – Largest 10 Locality Employers – General Employees
Pre-Retirement:
Pub-2010 Amount Weighted Safety Employee Rates projected generationally; males set forward 2 years; 105% of rates for females set forward 3 years
Post-Retirement:
Pub-2010 Amount Weighted Safety Healthy Retiree Rates projected generationally; 95% of rates for males set forward 2 years; 95% of rates for females set forward 1 year
Post-Disablement:
Pub-2010 Amount Weighted General Disabled Rated projected generationally; 110% of rates for males set forward 3 years; 110% of rates for females set forward 2 years
Beneficiaries and Survivors:
Pub-2010 Amount Weighted Safety Contingent Annuitant Rates projected generationally
Mortality Improvement Scale:
Rates projected generationally with Modified MP-2020 Improvement Scale that is 75% of the MP2020 rates
The actuarial assumptions used in the June 30, 2022 valuation were based on the results of an actuarial experience study for the period from July 1, 2016 through June 30, 2020, except the change in the discount rate, which was based on VRS Board action effective as of July 1, 2021. Changes to the actuarial assumptions as a result of the experience study and VRS Board action are as follows:
Mortality Rates (Pre-retirement, post-retirement healthy, and disabled)
Retirement Rates
Withdrawal Rates
Disability Rates
Salary Scale
Line of Duty Disability
Discount Rate
Update to PUB2010 public sector mortality tables. For future mortality improvements, replace load with a modified Mortality Improvement Scale MP2020
Adjusted rates to better fit experience for Plan 1; set separate rates based on experience for Plan 2/Hybrid; changed final retirement age from 75 to 80 for all
Adjusted rates to better fit experience at each age and service decrement through 9 years of service
No change
No change
No change
No change
Mortality rates – Non-Largest 10 Locality Employers – General Employees
Pre-Retirement:
Pub-2010 Amount Weighted Safety Employee Rates projected generationally; males set forward 2 years; 105% of rates for females set forward 3 years
Post-Retirement:
Pub-2010 Amount Weighted Safety Healthy Retiree Rates projected generationally; 95% of rates for males set forward 2 years; 95% of rates for females set forward 1 year
Post-Disablement:
Pub-2010 Amount Weighted General Disabled Rates projected generationally; 110% of rates for males set forward 3 years; 110% of rates for females set forward 2 years
Beneficiaries and Survivors:
Pub-2010 Amount Weighted Safety Contingent Annuitant Rates projected generationally
Mortality Improvement Scale:
Rates projected generationally with Modified MP-2020 Improvement Scale that is 75% of the MP2020 rates
The actuarial assumptions used in the June 30, 2022 valuation were based on the results of an actuarial experience study for the period from July 1, 2016 through June 30, 2020, except the change in the discount rate, which was based on VRS Board action effective as of July 1, 2021. Changes to the actuarial assumptions as a result of the experience study and VRS Board action are as follows:
Mortality Rates (Pre-retirement, post-retirement healthy, and disabled)
Retirement Rates
Withdrawal Rates
Disability Rates
Salary Scale
Line of Duty Disability
Discount Rate
Update to PUB2010 public sector mortality tables. For future mortality improvements, replace load with a modified Mortality Improvement Scale MP2020
Adjusted rates to better fit experience for Plan 1; set separate rates based on experience for Plan2/Hybrid; changed final retirement age from 75 to 80 for all
Adjusted rates to better fit experience at each age and service decrement through 9 years of service
No change
No change
No change
No change
Mortality rates – Largest 10 Locality Employers – Hazardous Duty Employees
Pre-Retirement:
Pub-2010 Amount Weighted Safety Employee Rates projected generationally; 95% of rates for males; 105% of rates for females set forward 2 years
Post-Retirement:
Pub-2010 Amount Weighted Safety Healthy Retiree Rates projected generationally; 110% of rates for males; 105% of rates for females set forward 3 years
Post-Disablement:
Pub-2010 Amount Weighted General Disabled Rates projected generationally; 95% of rates for males set back 3 years; 90% of rates for females set back 3 years
Beneficiaries and Survivors:
Pub-2010 Amount Weighted Safety Contingent Annuitant Rates projected generationally; 110% of rates for males and females set forward 2 years
Mortality Improvement Scale:
Rates projected generationally with Modified MP-2020 Improvement Scale that is 75% of the MP2020 rates
The actuarial assumptions used in the June 30, 2022 valuation were based on the results of an actuarial experience study for the period from July 1, 2016 through June 30, 2020, except the change in the discount rate, which was based on VRS Board action effective July 1, 2021. Changes to the actuarial assumptions as a result of the experience study and VRS Board action are as follows:
Mortality Rates (Pre-retirement, post-retirement healthy, and disabled)
Retirement Rates
Withdrawal Rates
Update to PUB2010 public sector mortality tables. Increased disability life expectancy. For future mortality improvements, replace load with a modified Mortality Improvement Scale MP-2020
Adjusted rates to better fit experience and changed final retirement age from 65 to 70
Decreased rates
Disability Rates No change
Salary Scale No change
Line of Duty Disability No change
Discount Rate No change
Mortality rates – Non-Largest 10 Locality Employers – Hazardous Duty Employees
Pre-Retirement:
Pub-2010 Amount Weighted Safety Employee Rates projected generationally; 95% of rates for males; 105% of rates for females set forward 2 years
Post-Retirement:
Pub-2010 Amount Weighted Safety Healthy Retiree Rates projected generationally; 110% of rates for males; 105% of rates for females set forward 3 years
Post-Disablement:
Pub-2010 Amount Weighted General Disabled Rates projected generationally; 95% of rates for males set back 3 years; 90% of rates for females set back 3 years
Beneficiaries and Survivors:
Pub-2010 Amount Weighted Safety Contingent Annuitant Rates projected generationally; 110% of rates for males and females set forward 2 years
Mortality Improvement Scale:
Rates projected generationally with Modified MP-2020 Improvement Scale that is 75% of the MP2020 rates
The actuarial assumptions used in the June 30, 2022 valuation were based on the results of an actuarial experience study for the period from July 1, 2016 through June 30, 2020, except the change in the discount rate, which was based on VRS Board action effective as of July 1, 2021. Changes to the actuarial assumptions as a result of the experience study and VRS Board action are as follows:
Mortality Rates (Pre-retirement, post-retirement healthy, and disabled)
Retirement Rates
Withdrawal Rates
Disability Rates
Salary Scale
Line of Duty Disability
Discount Rate
Net Group Life Insurance Program OPEB Liability
Update to PUB2010 public sector mortality tables. Increased disability life expectancy. For future mortality improvements, replace load with a modified Mortality Improvement Scale MP-2020
Adjusted rates to better fit experience and changed final retirement age from 65 to 70
Decreased rates and changed from rates based on age and service to rates based on service only to better fit experience and to be more consistent with Locals Top 10 Hazardous Duty
No change
No change
No change
No change
The net OPEB liability (NOL) for the Group Life Insurance Program represents the program’s total OPEB liability determined in accordance with GASB Statement No. 74, less the associated fiduciary net position. As of the Measurement Date of June 30, 2023, NOL amounts for the Group Life Insurance Program are as follows (amounts expressed in thousands):
Group Life Insurance OPEB Program
Total Group Life Insurance Program OPEB Liability $ 3,907,052 Plan Fiduciary Net Position 2,707,739
Group Life Insurance Program Net OPEB Liability (Asset) $ 1,199,313 Plan Fiduciary Net Position as a Percentage of the Total Group Life Insurance Program OPEB Liability 69.30%
The total Group Life Insurance Program OPEB liability is calculated by the System’s actuary, and each plan’s fiduciary net position is reported in the System’s financial statements. The net Group Life Insurance Program OPEB liability is disclosed in accordance with the requirements of GASB Statement No. 74 in the System’s notes to the financial statements and required supplementary information.
Long-Term Expected Rate of Return
The long-term expected rate of return on the System’s investments was determined using a log-normal distribution analysis in which best-estimate ranges of expected future real rates of return (expected returns, net of System’s investment expense and inflation) are developed for each major asset class. These ranges are combined to produce the long-term expected rate of return by weighting the expected future real rates of return by the target asset allocation percentage and by adding expected inflation. The target asset allocation and best estimate of arithmetic real rates of return for each major class are summarized in the following table:
(Strategy)
* The above allocation provides a one-year return of 8.25%. However, one-year returns do not take into account the volatility present in each of the asset classes. In setting the long-term expected return for the System, stochastic projections are employed to model future returns under various economic conditions. These results provide a range of returns over various time periods that ultimately provide a median return of 7.14%, including expected inflation of 2.50%.
On June 15, 2023, the VRS Board elected a long-term rate of 6.75%, which is roughly at the 45th percentile of expected long-term results of the VRS fund asset allocation at that time, providing a median return of 7.14%, including expected inflation of 2.50%.
Discount Rate
The discount rate used to measure the total Group Life Insurance Program OPEB liability was 6.75%. The projection of cash flows used to determine the discount rate assumed that employer contributions will be made in accordance with the VRS funding policy and at rates equal to the actuarially determined
contribution rates adopted by the VRS Board of Trustees. Through the fiscal year ending June 30, 2023, the rate contributed by the Partnership for the Group Life Insurance Program OPEB will be subject to the portion of the VRS Board-certified rates that are funded by the Virginia General Assembly which was 113% of the actuarially determined contribution rate. From July 1, 2023 on, employers are assumed to continue to contribute 100% of the actuarially determined contribution rates. Based on those assumptions, the Group Life Insurance Program OPEB’s fiduciary net position was projected to be available to make all projected future benefit payments of eligible employees. Therefore, the long-term expected rate of return was applied to all periods of projected benefit payments to determine the total Group Life Insurance Program OPEB liability.
Sensitivity of the Partnership’s Proportionate Share of the Net Group Life Insurance Program OPEB Liability to Changes in the Discount Rate
The following presents the Partnership’s proportionate share of the net Group Life Insurance Program OPEB liability using the discount rate of 6.75%, as well as what the Partnership’s proportionate share of the net Group Life Insurance Program OPEB liability would be if it were calculated using a discount rate that is one percentage point lower (5.75%) or one percentage point higher (7.75%) than the current rate:
Partnership’s proportionate share of the Group Life Insurance Program Net OPEB Liability
Group Life Insurance Program Fiduciary Net Position
Detailed information about the Group Life Insurance Program’s Fiduciary Net Position is available in the separately issued VRS 2023 Annual Comprehensive Financial Report (Annual Report). A copy of the 2023 VRS Annual Report may be downloaded from the VRS website at: https://www.varetire.org/pdf/publications/2023-annual-report.pdf or by writing to the System’s Chief Financial Officer at P.O. Box 2500, Richmond, VA, 23218-2500.
13 DISABILITY INSURANCE PROGRAM
General Information about the VRS Disability Insurance Program
Plan Description
All Partnership full-time and part-time permanent salaried employees who are covered under the Virginia Retirement System (VRS) hired on or after January 1, 1999 are automatically covered by the Disability Insurance Program (VSDP) upon employment. The Disability Insurance Program also covers state
employees hired before January 1, 1999 who elected to transfer to VSDP rather than retain their eligibility to be considered for disability retirement. This plan is administered by the Virginia Retirement System (the System), along with pensions and other OPEB plans, for public employer groups in the Commonwealth of Virginia.
The specific information for the Disability Insurance Program OPEB, including eligibility, coverage and benefits is set out in the table below:
DISABILITY INSURANCE PROGRAM (VSDP) PLAN PROVISIONS
Eligible Employees
The Virginia Sickness and Disability Program, also known as the Disability Insurance Trust Fund, was established January 1, 1999 to provide short-term and long-term disability benefits for non-work-related and work-related disabilities.
Eligible employees are enrolled automatically upon employment. They include:
• Full-time and part-time permanent salaried state employees covered under VRS.
• State employees hired before January 1, 1999, who elected to transfer to VSDP rather than retain their eligibility to be considered for VRS disability retirement.
• Public college and university faculty members who elect the VRS defined benefit plan. They may participate in VSDP or their institution’s disability program, if offered. If the institution does not offer the program or the faculty member does not make an election, he or she is enrolled in VSDP.
Benefit Amounts
The Virginia Sickness and Disability Program provides the following benefits for eligible employees:
• Leave – Sick, family and personal leave. Eligible leave benefits are paid by the employer.
• Short-Term Disability – The program provides a short-term disability benefit beginning after a seven-calendar-day waiting period for the first day of disability. The benefit provides income replacement beginning at 100% of the employee’s pre-disability income, reducing to 80% and then 60% based on the period of the disability and the length of service of the employee. Shortterm disability benefits are paid by the employer.
• Long-Term Disability – The program provides a long-term disability benefit beginning after 125 workdays of short-term disability and continuing until the employee reaches his or her normal retirement age. The benefit provides income replacement of 60% of the employee’s predisability income. If an employee becomes disabled within five years of his or her normal retirement age, the employee will receive up to five years of VSDP benefits, provided he or she remains medically eligible. Long-term disability benefits are paid for by the Virginia Disability Insurance Program (VSDP) OPEB Plan.
• Income Replacement Adjustment – The program provides for an income replacement adjustment to 80% for catastrophic conditions.
• VSDP Long-Term Care Plan – The program also includes a self-funded long-term care plan that assists with the cost of covered long-term care services.
DISABILITY INSURANCE PROGRAM (VSDP) PLAN PROVISIONS
Disability Insurance Program (VSDP) Plan Notes:
• Employees hired or rehired on or after July 1, 2009, must satisfy eligibility periods before becoming eligible for non-work-related short-term disability benefits and certain incomereplacement levels.
• A state employee who is approved for VSDP benefits on or after the date that is five years prior to his or her normal retirement date is eligible for up to five years of VSDP benefits.
• Employees on work-related short-term disability receiving only a workers’ compensation payment may be eligible to purchase service credit for this period if retirement contributions are not being withheld from the workers’ compensation payment. The rate will be based on 5.00% of the employee’s compensation.
Cost-of-Living Adjustment (COLA)
• During periods an employee receives long-term disability (LTD) benefits, the LTD benefit may be increased annually by an amount recommended by the actuary and approved by the Board.
o Plan 1 employees vested as of 1/1/2013 – 100% of the VRS Plan 1 COLA (The first 3% increase in the Consumer Price Index for all Urban Consumers (CIP-U) and half of any additional increase (up to 4%) up to a maximum COLA of 5%).
o Plan 1 employees non-vested as of 1/1/2013, Plan 2 and Hybrid Plan employees – 100% of the VRS Plan 2 and Hybrid COLA (The first 2% increase in the Consumer Price Index for all Urban Consumers (CPI-U) and half of any additional increase (up to 2%) up to a maximum COLA of 3%).
• For participating full-time employees taking service retirement, the creditable compensation may be increased annually by an amount recommended by the actuary and approved by the Board, from the date of the commencement of the disability to the date of retirement.
o 100% of the increase in the pay over the previous plan year for continuing VSDP members in the State Plan, with a maximum COLA of 4.00%.
• For participating full-time employees receiving supplemental (work-related) disability benefits, the creditable compensation may be increased annually by an amount recommended by the actuary and approved by the Board, from the date of the commencement of the disability to the date of retirement.
o 100% of the increase in the pay over the previous plan year for continuing VSDP members in the State Plan, with a maximum COLA of 4.00%.
Contributions
The contribution requirements for the Disability Insurance Program are governed by §51.1-1140 of the Code of Virginia, as amended, but may be impacted as a result of funding provided to the Partnership by the Virginia General Assembly. The Partnership’s contractually required employer contribution rate for the Disability Insurance Program for the year ended June 30, 2024 was 0.61% of covered employee compensation. This rate was the General Assembly approved rate which was based on an actuarially determined rate from an actuarial valuation as of June 30, 2021. The actuarially determined rate was expected to finance the costs of benefits payable during the year, with an adjustment to amortize the accrued OPEB assets. Contributions from the Partnership to the Disability Insurance Program were $123,010 and $101,060 for the years ended June 30, 2024 and June 30, 2023, respectively.
Disability Insurance Program (VSDP) OPEB Assets, VSDP OPEB Expense, and Deferred Outflows of Resources and Deferred Inflows of Resources Related to the VSDP OPEB
At June 30, 2024, the Partnership reported an asset of $1,032,859 for its proportionate share of the Net VSDP OPEB Asset. The Net VSDP OPEB Asset was measured as of June 30, 2023 and the total VSDP OPEB Liability used to calculate the Net VRS VSDP OPEB Asset was determined by an actuarial valuation as of June 30, 2022 and rolled forward to the measurement date of June 30, 2023. The Partnership’s proportion of the Net VSDP OPEB Asset was based on the Partnership’s actuarially determined employer contributions to the VSDP OPEB plan for the year ended June 30, 2023 relative to the total of the actuarially determined employer contributions for all participating employers. At June 30, 2023, the Partnership’s proportion was 0.32698% as compared to 0.30541% at June 30, 2022.
For the year ended June 30, 2024, the Partnership recognized VSDP OPEB expense of ($13,295). Since there was a change in proportionate share between measurement dates, a portion of the VSDP OPEB expense was related to deferred amounts from changes in proportion.
At June 30, 2024, the Partnership reported deferred outflows of resources and deferred inflows of resources related to the VSDP OPEB from the following sources:
$123,010 reported as deferred outflows of resources related to the VSDP OPEB resulting from the Partnership’s contributions subsequent to the measurement date will be recognized as a reduction of the Net VSDP OPEB Asset in the Fiscal Year ending June 30, 2025. Other amounts reported as deferred outflows of resources and deferred inflows of resources related to the VSDP OPEB will be recognized in VSDP OPEB expense in future reporting periods as follows:
Year Ended June 30
FY 2025 $ (83,339)
FY 2026 $ (89,119)
FY 2027 $ (26,786)
FY 2028 $ (22,052)
FY 2029 $ (12,967) Thereafter $ (23,436)
Actuarial Assumptions
The total VSDP OPEB liability was based on an actuarial valuation as of June 30, 2022, using the Entry Age Normal actuarial cost method and the following assumptions, applied to all periods included in the measurement and rolled forward to the measurement date of June 30, 2023
including inflation -
–
–
Investment rate of return 6.75%, net of plan investment expenses, including inflation
Mortality rates – General State Employees
Pre-Retirement:
Pub-2010 Amount Weighted General Employee Rates projected generationally; females set forward 2 years
Post-Retirement:
Pub-2010 Amount Weighted General Healthy Retiree Rates projected generationally; 110% of rates for females
Post-Disablement:
Pub-2010 Amount Weighted General Disabled Rates projected generationally; males and females set forward 3 years
Beneficiaries and Survivors:
Pub-2010 Amount Weighted General Contingent Annuitant Rates projected generationally; 110% of rates for males and females
Mortality Improvement Scale: Rates projected generationally with Modified MP-2020 Improvement Scale that is 75% of the MP-2020 rates
The actuarial assumptions used in the June 30, 2022 valuation were based on the results of an actuarial experience study for the period from July 1, 2016 through June 30, 2020, except the change in the discount rate, which was based on VRS Board action effective as of July 1, 2021. Changes to the actuarial assumptions as a result of the experience study and VRS Board action are as follows:
Mortality Rates (Pre-retirement, post-retirement healthy, and disabled)
Retirement Rates
Withdrawal Rates
Disability Rates
Salary Scale
Line of Duty Disability
Discount Rate
Mortality rates – SPORS Employees
Pre-Retirement:
Update to PUB2010 public sector mortality tables. For future mortality improvements, replace load with a modified Mortality Improvement Scale MP2020
Adjusted rates to better fit experience for Plan 1; set separate rates based on experience for Plan 2/Hybrid; changed final retirement age from 75 to 80 for all
Adjusted rates to better fit experience at each year age and service through 9 years of service
No change
No change
No change
No change
Pub-2010 Amount Weighted Safety Employee Rates projected generationally; 95% of rates for males; 105% of rates for females set forward 2 years
Post-Retirement:
Pub-2010 Amount Weighted Safety Healthy Retiree Rates projected generationally; 110% of rates for males; 105% of rates for females set forward 3 years
Post-Disablement:
Pub-2010 Amount Weighted General Disabled Rates projected generationally; 95% of rates for males set back 3 years; 90% of rates for females set back 3 years
Beneficiaries and Survivors:
Pub-2010 Amount Weighted General Contingent Annuitant Rates projected generationally; 110% of rates for males and females set forward 2 years
Mortality Improvement Scale:
Rates projected generationally with Modified MP-2020 Improvement Scale that is 75% of the MP-2020 rates
The actuarial assumptions used in the June 30, 2022 valuation were based on the results of an actuarial experience study for the period from July 1, 2016 through June 30, 2020, except the change in the discount rate, which was based on VRS Board action effective as of July 1, 2021. Changes to the actuarial assumptions as a result of the experience study and VRS Board action are as follows:
Mortality Rates (Pre-retirement, post-retirement healthy, and disabled)
Retirement Rates
Withdrawal Rates
Disability Rates
Salary Scale
Line of Duty Disability
Discount Rate
Mortality rates – VaLORS Employees
Pre-Retirement:
Update to PUB2010 public sector mortality tables. Increased disability life expectancy. For future mortality improvements, replace load with a modified Mortality Improvement Scale MP-2020
Increased rates for ages 55 to 61, 63, and 64 with 26 or more years of service and changed final retirement age from 65 to 70
Decreased rate for 0 years of service and increased rates for 1 to 6 years of service
No change
No change
No change
No change
Pub-2010 Amount Weighted Safety Employee Rates projected generationally; 95% of rates for males; 105% of rates for females set forward 2 years
Post-Retirement:
Pub-2010 Amount Weighted Safety Healthy Retiree Rates projected generationally; 110% of rates for males; 105% of rates for females set forward 3 years
Post-Disablement:
Pub-2010 Amount Weighted General Disabled Rates projected generationally; 95% of rates for males set back 3 years; 90% of rates for females set back 3 years
Beneficiaries and Survivors:
Pub-2010 Amount Weighted Safety Contingent Annuitant Rates projected generationally; 110% of rates for males and females set forward 2 years
Mortality Improvement Scale:
Rates projected generationally with Modified MP-2020 Improvement Scale that is 75% of the MP-2020 rates
The actuarial assumptions used in the June 30, 2022 valuation were based on the results of an actuarial experience study for the period from July 1, 2016 through June 30, 2020, except the change in the discount rate, which was based on VRS Board action effective as of July 1, 2021. Changes to the actuarial assumptions as a result of the experience study and VRS Board action are as follows:
Mortality Rates (Pre-retirement, post-retirement healthy, and disabled)
Retirement Rates
Withdrawal Rates
Disability Rates
Salary Scale
Line of Duty Disability
Discount Rate
Net VSDP OPEB Asset
Update to PUB2010 public sector mortality tables. Increased disability life expectancy. For future mortality improvements, replace load with a modified Mortality Improvement Scale MP-2020
Increased rates at some younger ages, decreased at age 62, and changed final retirement age from 65 to 70
Adjusted rates to better fit experience at each age and service decrement through 9 years of service
No change
No change
No change
No change
The net OPEB asset (NOA) for the VSDP represents the program’s total OPEB liability determined in accordance with GASB Statement No. 74, less the associated fiduciary net position. As of the Measurement Date of June 30, 2023, NOA amounts for the VSDP are as follows (amounts expressed in thousands):
Virginia Sickness and Disability Program
Total VSDP OPEB Liability
$318,901 Plan Fiduciary Net Position 634,779
Employers’ Net OPEB Liability (Asset)
Plan Fiduciary Net Position as a Percentage of the
($315,878)
The total VSDP OPEB liability is calculated by the System’s actuary, and each plan’s fiduciary net position is reported in the System’s financial statements. The net OPEB asset is disclosed in accordance with the requirements of GASB Statement No. 74 in the System’s notes to the financial statements and required supplementary information.
Long-Term Expected Rate of Return
The long-term expected rate of return on System investments was determined using a log-normal distribution analysis in which best-estimate ranges of expected future real rates of return (expected returns, net of VRS System investment expense and inflation) are developed for each major asset class. These ranges are combined to produce the long-term expected rate of return by weighting the expected future real rates of return by the target asset allocation percentage and by adding expected inflation. The target asset allocation and best estimate of arithmetic real rates of return for each major class are summarized in the following table:
* The above allocation provides a one-year return of 8.25%. However, one-year returns do not take into account the volatility present in each of the asset classes. In setting the long-term expected return for the System, stochastic projections are employed to model future returns under various economic conditions. These results provide a range of returns over various time periods that ultimately provide a median return of 7.14%, including expected inflation of 2.50%.
On June 15, 2023, the VRS Board elected a long-term rate of 6.75%, which was roughly at the 45th percentile of expected long-term results of the VRS fund asset allocation at that time, providing a median return of 7.14%, including expected inflation of 2.50%.
Discount Rate
The discount rate used to measure the total VSDP OPEB liability was 6.75%. The projection of cash flows used to determine the discount rate assumed that employer contributions will be made per the VRS Statutes and that they will be made in accordance with the VRS funding policy and at rates equal to the actuarially determined rates adopted by the VRS Board of Trustees. Through the fiscal year ending June 30, 2023, the rate contributed by the Partnership to the VSDP OPEB Program will be subject to the portion of the VRS Board-certified rates that are funded by the Virginia General Assembly which was 109% of the actuarially determined contribution rates. From July 1, 2023 on, participating employers are assumed to continue to contribute 100% of the actuarially determined contribution rates. Based on those assumptions, the VSDP OPEB Program’s fiduciary net position was projected to be available to make all projected future benefit payments of current active and inactive employees. Therefore, the long-term expected rate of return was applied to all periods of projected benefit payments to determine the total VSDP OPEB liability.
Sensitivity of the Partnership’s Proportionate Share of the Net VSDP OPEB Asset to Changes in the Discount Rate
The following presents the Partnership’s proportionate share of the net VSDP OPEB asset using the discount rate of 6.75%, as well as what the Partnership’s proportionate share of the net VSDP OPEB asset would be if it were calculated using a discount rate that is one percentage point lower (5.75%) or one percentage point higher (7.75%) than the current rate:
Partnership’s proportionate share of the total VSDP Net OPEB Asset $ 955,849 $ 1,032,859 $ 1,100,744
VSDP OPEB Fiduciary Net Position
Detailed information about the VSDP Fiduciary Net Position is available in the separately issued VRS 2023 Annual Comprehensive Financial Report (Annual Report). A copy of the 2023 VRS Annual Report may be downloaded from the VRS website at: https://www.varetire.org/pdf/publications/2023-annual-report.pdf or by writing to the System’s Chief Financial Officer at P.O. Box 2500, Richmond, VA, 23218- 2500.
14. PRE-MEDICARE RETIREE HEALTHCARE
General Information about the Commonwealth of Virginia State Health Plans Program for Pre-Medicare Retirees
Plan Description
The Commonwealth provides a healthcare plan established by Title 2.2, Chapter 28 of the Code of Virginia for retirees who are not yet eligible to participate in Medicare.
Following are eligibility requirements for Virginia Retirement System (VRS) retirees:
• You are a retiring state employee who is eligible for a monthly retirement benefit from VRS, and
• You start receiving (do not defer) your retirement benefit immediately upon retirement*, and
• Your last employer before retirement was the Commonwealth of Virginia, and
• You were eligible for (even if you were not enrolled) coverage as an active employee in the State Health Benefits Program until your retirement date (not including Extended Coverage/COBRA), and
• You enroll no later than 31 days from your retirement date
*For VRS retirees, this means that your employing agency reported a retirement contribution or leave without pay status for retirement in the month immediately prior to your retirement date. Some faculty members may also be eligible if they are paid on an alternate pay cycle but maintain eligibility for active coverage until their retirement date.
Effective January 1, 2017**, following are eligibility requirements for Optional Retirement Plan retirees:
• You are a terminating state employee who participates in one of the qualified Optional Retirement Plans, and
• Your last employer before termination was the Commonwealth of Virginia, and
• You were eligible for (even if you were not enrolled) coverage in the State Employee Health Benefits Program for active employees at the time of your termination, and
• You meet the age and service requirements for an immediate retirement benefit under the non-ORP Virginia Retirement System plan that you would have been eligible for on your date of hire had you not elected the ORP, and
• You enroll in the State Retiree Health Benefits Program no later than 31 days for the date you lose coverage (or lose eligibility for coverage) in the State Health Benefits Program for active employees due to your termination of employment.
**This change applies to ORP terminations effective January 1, 2017 or later. Eligibility for those who terminated employment prior to January 1 should be determined based on the policy in place at the time of their termination.
The employer does not pay a portion of the retirees’ healthcare premium; however, since both active employees and retirees are included in the same pool for purposes of determining health insurance rates, this generally results in a higher rate for active employees. Therefore, the employer effectively subsidizes the costs of the participating retirees’ healthcare through payment of the employer’s portion of the premiums for active employees.
This fund is reported as part of the Commonwealth’s Healthcare Internal Service Fund. Benefit payments are recognized when due and payable in accordance with the benefit terms. Pre-Medicare Retiree Healthcare is a single-employer defined benefit OPEB plan that is treated like a cost-sharing plan for financial reporting purposes and is administered by the Department of Human Resource Management. There were approximately 3,551 retirees and 92,780 active employees in the program as of June 30, 2023. There are no inactive employees entitled to future benefits who are not currently receiving benefits. There are no assets accumulated in a trust to pay benefits.
Pre-Medicare Retiree Healthcare OPEB Liabilities, OPEB Expense, and Deferred Outflows of Resources and Deferred Inflows of Resources
At June 30, 2024, the Partnership reported a liability of $639,621 for its proportionate share of the collective total PreMedicare Retiree Healthcare OPEB liability of $351.9 million. The Pre-Medicare Retiree Healthcare OPEB liability was measured as of June 30, 2023 and was determined by an actuarial valuation as of June 30, 2023. The Partnership’s proportion of the Pre-Medicare Retiree Healthcare OPEB liability was based on the Partnership’s calculated healthcare premium contributions as a percentage of the total employer’s calculated healthcare premium contributions for all participating employers. At June 30, 2023, the Partnership’s proportion was 0.18175% as compared to 0.16278% at June 30, 2022. For the year ended June 30, 2024, the Partnership recognized Pre-Medicare Retiree Healthcare OPEB expense of ($200,870).
At June 30, 2024, the Partnership reported deferred outflows of resources and deferred inflows of resources related to PreMedicare Retiree Healthcare from the following sources:
associated with transactions subsequent to the measurement date
Deferred outflows of resources related to the Pre-Medicare Retiree Healthcare OPEB resulting from amounts associated with transactions subsequent to the measurement date were $50,709 This amount will be recognized as a reduction of the total OPEB liability in the fiscal year ending June 30, 2024 Other amounts reported as deferred outflows of resources and deferred inflows of resources related to the PreMedicare Retiree Healthcare OPEB will be recognized in the Pre-Medicare Retiree Healthcare OPEB expense as follows:
Year Ended June 30
FY 2025 $ (154,148)
FY 2026 $ (36,562)
FY 2027 $ 5,157
FY 2028 $ 18,874 FY 2029 $ 20,723
The following presents the Partnership’s proportionate share of the Pre-Medicare Retiree Healthcare OPEB liability using the discount rate of 3.65%, as well as what the Partnership’s proportionate share of the PreMedicare Retiree Healthcare OPEB liability would be if it were calculated using a discount rate that is one percentage point lower (2.65%) or one percentage point higher (4.65%) than the current rate:
Sensitivity of the Partnership’s Proportionate Share of the OPEB Liability to Changes in the Healthcare Cost Trends Rates
The following presents the Partnership’s proportionate share of the Pre-Medicare Retiree Healthcare OPEB liability using a healthcare cost trend of 7.75% decreasing to 4.50%, as well as what the Partnership’s proportionate share of the Pre-Medicare Retiree Healthcare OPEB liability would be if it were calculated using a healthcare cost trend rate that is one percentage point lower (6.75% decreasing to 3.50%) or one percentage point higher (8.75% decreasing to 5.50%) than the current rate: 1.00% Decrease 6.75% decreasing to 3.50% Trend Rate 7.75% decreasing to 4.50% 1.00% Increase 8.75% decreasing to 5.50%
Partnership’s proportionate share of the OPEB Liability
Actuarial Assumptions and Methods
The total Pre-Medicare Retiree Healthcare OPEB liability was based on an actuarial valuation with a valuation date of June 30, 2023 (one year prior to the end of the fiscal year). The Department of Human Resource Management selected the economic, demographic and healthcare claim cost assumptions. The actuary provided guidance with respect to these assumptions. Initial healthcare costs trend rates used were 7.75 percent for medical and pharmacy and 4.00 percent for dental. The ultimate trend rates used were 4.50 percent for medical and pharmacy and 4.00 percent for dental.
Valuation Date
Measurement Date
Actuarial Cost Method
Amortization Method
Actuarially determined contribution rates are calculated as of June 30, one year prior to the end of the fiscal year in which contributions are reported.
June 30, 2023 (one year prior to the end of the fiscal year)
Entry Age Normal
Level dollar, Closed
Effective Amortization Period 5.80 years
Discount Rate 3.65%
Projected Salary Increases
Medical Trend Under 65
5.35% to 3.50% based on years of service from 1 year to 20 years or more
Medical & Rx: 7.75% to 4.50%
Dental: 4.00%
Year of Ultimate Trend 2033
Mortality
Mortality rates vary by participant status and gender
Pre-Retirement:
Pub-2010 Benefits Weighted General Employee Rates projected generationally with a Modified MP-2021 Improvement Scale; females set forward 2 years
Post-Retirement:
Pub-2010 Benefits Weighted General Healthy Retiree Rates projected generationally with a Modified MP-2021 Improvement Scale; 110% of rates for females
Post-Disablement:
Pub-2010 Benefits Weighted General Disabled Rates projected generationally with a Modified MP-2021 Improvement Scale; males and females set forward 3 years
Beneficiaries and Survivors:
Pub-2010 Amount Weighted Safety Contingent Annuitant Rates projected generationally with a Modified MP-2021 Improvement Scale; 110% of rates for males and females
The discount rate was based on the Bond Buyers GO 20 Municipal Bond Index as of the measurement date which is June 30, 2023
Changes of Assumptions
There were not any changes in assumptions since the June 30, 2022 measurement date. The following remained constant since the prior measurement date:
Spousal Coverage
Retiree Participation
Rate remained at 20%
Rate remained at 35%
Retiree participation was based on a blend of recent experience and the prior year assumptions.
The trend rates were updated based on economic conditions as of June 30, 2023. Additionally, the discount rate was increased from 3.54% to 3.65% based on the Bond Buyers GO 20 Municipal Bond index as of June 30, 2023.
There were no plan changes in the valuation since the prior year.
15 DEFERRED COMPENSATION PLAN
Employees of the Partnership may participate in the Commonwealth’s Deferred Compensation Plan. Participating employees can contribute to the plan each pay period with the Partnership matching up to $20 per pay period. The dollar amount of the match can change depending on the funding available in the Partnership’s budget. The Deferred Compensation Plan is a qualified defined contribution plan under Section 401(a) of the Internal Revenue Code. Employer contributions under the Deferred Compensation Plan were $42,355 for the year ended June 30, 2024.
The Partnership is exposed to various risks of loss related to torts; theft, damage, or destruction of assets; errors and omissions; non-performance of duty; injuries to employees; and natural disasters. The Partnership is insured for these risks through commercial insurance policies. Further, the Partnership is insured for workers compensation and for loss from employee actions by an insurance policy issued by the Chubb Group and the Great Northern Insurance Company. Policy coverage for loss from employee actions is $50,000 per year with a $1,000 deductible for each loss.
The Partnership participates in the state health care insurance plan maintained by the Commonwealth of Virginia, which is administered by DHRM. The Partnership pays premiums to DHRM for health insurance coverage. Information relating to the Commonwealth's insurance plan is available at the statewide level in the Commonwealth of Virginia's Annual Comprehensive Financial Report.
REQUIRED SUPPLEMENTARY INFORMATION
Required Supplementary Information
Schedule of Employer's Share of Net Pension Liability
VRS State Employee Retirement Plan
For the Measurement Dates of June 30, 2014 through 2023
Employer’s Proportion of the Net Pension Liability (Asset)
Employer’s Proportionate Share of the Net Pension Liability (Asset)
Employer’s Covered Payroll
Employer’s Proportionate Share of the Net Pension Liability (Asset) as a Percentage of its Covered Payroll Plan Fiduciary Net Position as a Percentage of the Total Pension Liability
Required Supplementary Information
Schedule of Employer Contributions
VRS State Employee Retirement Plan
For the Years Ended June 30, 2015 through 2024
VRS State Employee Retirement Plan
Notes to Required Supplementary Information for the Year Ended June 30, 2024
Changes of benefit terms – There have been no actuarially material changes to the System benefit provisions since the prior actuarial valuation.
Changes of assumptions – The actuarial assumptions used in the June 30, 2022 valuation were based on the results of an actuarial experience study for the period from July 1, 2016 through June 30, 2020, except the change in the discount rate, which was based on VRS Board action effective as of July 1, 2021 Changes to the actuarial assumptions for the VRS State Employee Retirement Plan as a result of the experience study and VRS Board action are as follows:
Mortality Rates (Pre-retirement, post-retirement healthy, and disabled)
Retirement Rates
Withdrawal Rates
Update to PUB2010 public sector mortality tables. For future mortality improvements, replace load with a modified Mortality Improvement Scale MP-2020
Adjusted rates to better fit experience for Plan 1; set separate rates based on experience for Plan 2/Hybrid; changed final retirement ages from 75 to 80 for all
Adjusted rates to better fit experience at each year age and service through 9 years of service
Required Supplementary Information
Schedule of Employer's Share of Net OPEB Liability
Health Insurance Credit Program (HIC)
For the Measurement Dates of June 30, 2017 through 2023
Employer’s Proportion of the Net HIC OPEB Liability (Asset)
Employer’s Proportionate Share of the Net HIC OPEB Liability (Asset)
Employer’s Covered Payroll
Employer’s Proportionate Share of the Net HIC OPEB Liability (Asset) as a Percentage of its Covered Payroll
Schedule is intended to show information for 10 years. Since 2023 is the seventh year for this presentation, there are only seven years available. However, additional years will be included as they become available.
Required Supplementary Information
Schedule of Employer Contributions
Health Insurance Credit Program (HIC)
For the Years Ended June 30, 2015 through 2024
Health Insurance Credit Program (HIC)
Notes to Required Supplementary Information for the Year Ended June 30, 2024
Changes of benefit terms – There have been no actuarially material changes to the System benefit provisions since the prior actuarial valuation.
Changes of assumptions – The actuarial assumptions used in the June 30, 2022 valuation were based on the results of an actuarial experience study for the period from July 1, 2016 through June 30, 2020, except the change in the discount rate, which was based on VRS Board action effective as of July 1, 2021 Changes to the actuarial assumptions as a result of the experience study and VRS Board action are as follows:
General State Employees:
Mortality Rates (Pre-retirement, post-retirement healthy, and disabled)
Retirement Rates
Withdrawal Rates
Disability Rates
Update to PUB2010 public sector mortality tables. For future mortality improvements, replace load with a modified Mortality Improvement Scale MP-2020
Adjusted rates to better fit experience for Plan 1; set separate rates based on experience for Plan2/Hybrid; changed final retirement age from 75 to 80 for all
Adjusted rates to better fit experience at each year age and service through 9 years of service
No change
Salary Scale No change
Line of Duty Disability No change
Discount Rate No change
SPORS Employees:
Mortality Rates (Pre-retirement, post-retirement healthy, and disabled)
Retirement Rates
Withdrawal Rates
Disability Rates
Update to PUB2010 public sector mortality tables. For future mortality improvements, replace load with a modified Mortality Improvement Scale MP-2020
Increased rates for ages 55 to 61, 63, and 64 with 26 or more years of service; changed final retirement age from 65 to 70
Decreased rate for 0 years of service and increased rates for 1 to 6 years of service
No change
Salary Scale No change
Line of Duty Disability No change
Discount Rate No change
Health Insurance Credit Program (HIC)
Notes to Required Supplementary Information for the Year Ended June 30, 2024
VaLORS Employees:
Mortality Rates (Pre-retirement, post-retirement healthy, and disabled)
Retirement Rates
Withdrawal Rates
Disability
Salary
Line
Update to PUB2010 public sector mortality tables. For future mortality improvements, replace load with a modified Mortality Improvement Scale MP-2020
Increased rates at some younger ages, decreased at age 62, and changed final retirement age from 65 to 70
Adjusted rates to better fit experience at each year age and service through 9 years of service
change
change
change Discount
JRS Employees:
Mortality Rates (Pre-retirement, post-retirement healthy, and disabled)
Retirement Rates
Withdrawal Rates
Review separately from State employees because exhibit fewer deaths. Update to PUB2010 public sector mortality tables. For future mortality improvements, replace load with a modified Mortality Improvement Scale MP-2020
Decreased rates for ages 60-66 and 70-72
Required Supplementary Information
Schedule of Employer's Share of Net OPEB Liability
Group Life Insurance Program (GLI)
For the Measurement Dates of June 30, 2017 through 2023
Employer’s Proportion of the Net GLI OPEB Liability (Asset)
Employer’s Proportionate Share of the Net GLI OPEB Liability (Asset)
Employer’s Covered Payroll
Employer’s Proportionate Share of the Net GLI OPEB Liability (Asset) as a Percentage of its Covered Payroll
Schedule is intended to show information for 10 years. Since 2023 is the seventh year for this presentation, there are only seven years available. However, additional years will be included as they become available.
Required Supplementary Information
Schedule of Employer Contributions
Group Life Insurance Program
For the Years Ended June 30, 2015 through 2024
Group Life Insurance Program
Notes to Required Supplementary Information for the Year Ended June 30, 2024
Changes of benefit terms – There have been no actuarially material changes to the System benefit provisions since the prior actuarial valuation.
Changes of assumptions – The actuarial assumptions used in the June 30, 2022 valuation were based on the results of an actuarial experience study for the period from July 1, 2016 through June 30, 2020, except the change in the discount rate, which was based on VRS Board action effective as of July 1, 2021 Changes to the actuarial assumptions as a result of the experience study and VRS Board action are as follows:
General State Employees:
Mortality Rates (Pre-retirement, post-retirement healthy, and disabled)
Retirement Rates
Withdrawal Rates
Disability Rates
Update to PUB2010 public sector mortality tables. For future mortality improvements, replace load with a modified Mortality Improvement Scale MP-2020
Adjusted rates to better fit experience for Plan 1; set separate rates based on experience for Plan 2/Hybrid; changed final retirement age from 75 to 80 for all
Adjusted rates to better fit experience at each year age and service through 9 years of service
No change
Salary Scale No change
Line of Duty Disability
No change
Discount Rate No change
Teachers:
Mortality Rates (Pre-retirement, post-retirement healthy, and disabled)
Retirement Rates
Withdrawal Rates
Disability Rates
Update to PUB2010 public sector mortality tables. For future mortality improvements, replace load with a modified Mortality Improvement Scale MP-2020
Adjusted rates to better fit experience for Plan 1; set separate rates based on experience for Plan2/Hybrid; changed final retirement age from 75 to 80 for all
Adjusted rates to better fit experience at each year age and service through 9 years of service
No change
Salary Scale No change
Discount Rate
No change
Group Life Insurance Program
Notes to Required Supplementary Information for the Year Ended June 30, 2024
SPORS Employees:
Mortality Rates (Pre-retirement, post-retirement healthy, and disabled)
Retirement Rates
Withdrawal Rates
Disability Rates
Salary Scale
Line of Duty Disability
Discount Rate
VaLORS Employees:
Mortality Rates (Pre-retirement, post-retirement healthy, and disabled)
Retirement Rates
Withdrawal Rates
Disability Rates
Salary Scale
Update to PUB2010 public sector mortality tables. For future mortality improvements, replace load with a modified Mortality Improvement Scale MP-2020
Increased rates for ages 55 to 61, 63, and 64 with 26 or more years of service; changed final retirement age from 65 to 70
Decreased rate for 0 years of service and increased rates for 1 to 6 years of service
change
change
change
change
Update to PUB2010 public sector mortality tables. For future mortality improvements, replace load with a modified Mortality Improvement Scale MP-2020
Increased rates at some younger ages, decreased at age 62, and changed final retirement age from 65 to 70
Adjusted rates to better fit experience at each year age and service through 9 years of service
change
change Line of Duty Disability
JRS Employees:
Mortality Rates (Pre-retirement, post-retirement healthy, and disabled)
change
Retirement Rates
Review separately from State employees because exhibit fewer deaths. Update to PUB2010 public sector mortality tables. For future mortality improvements, replace load with a modified Mortality Improvement Scale MP-2020
Decreased rates for ages 60-66 and 70-72
Withdrawal Rates No change
Disability Rates
Salary Scale
change
change
Group Life Insurance Program
Notes to Required Supplementary Information for the Year Ended June 30, 2024
Largest Ten Locality Employers – General Employees:
Mortality Rates (Pre-retirement, post-retirement healthy, and disabled)
Retirement Rates
Withdrawal Rates
Update to PUB2010 public sector mortality tables. For future mortality improvements, replace load with a modified Mortality Improvement Scale MP-2020
Adjusted rates to better fit experience for Plan 1; set separate rates based on experience for Plan2/Hybrid; changed final retirement age from 75 to 80 for all
Adjusted rates to better fit experience at each age and service decrement through 9 years of service
Disability Rates No change
Salary Scale No change
Line of Duty Disability No change
Discount Rate No change
Non-Largest Ten Locality Employers – General Employees:
Mortality Rates (Pre-retirement, post-retirement healthy, and disabled)
Retirement Rates
Withdrawal Rates
Update to PUB2010 public sector mortality tables. For future mortality improvements, replace load with a modified Mortality Improvement Scale MP-2020
Adjusted rates to better fit experience for Plan 1; set separate rates based on experience for Plan2/Hybrid; changed final retirement age from 75 to 80 for all
Adjusted rates to better fit experience at each age and service decrement through 9 years of service
Disability Rates No change
Salary Scale No change
Line of Duty Disability No change
Discount Rate No change
Group
Largest Ten Locality Employers – Hazardous Duty Employees:
Mortality Rates (Pre-retirement, post-retirement healthy, and disabled)
Retirement Rates
Withdrawal Rates
Update to PUB2010 public sector mortality tables. Increased disability life expectancy. For future mortality improvements, replace load with a modified Mortality Improvement Scale MP-2020
Adjusted rates to better fit experience and changed final retirement age from 65 to 70
Decreased rates
Disability Rates No change
Salary Scale No change
Line of Duty Disability No change
Discount Rate No change
Non-Largest Ten Locality Employers – Hazardous Duty Employees:
Mortality Rates (Pre-retirement, post-retirement healthy, and disabled)
Retirement Rates
Withdrawal Rates
Disability Rates
Update to PUB2010 public sector mortality tables. Increased disability life expectancy. For future mortality improvements, replace load with a modified Mortality Improvement Scale MP-2020
Adjusted rates to better fit experience and changed final retirement age from 65 to 70
Decreased rates and changed from rates based on age and service to rates based on service only to better fit experience and to be more consistent with Locals Top 10 Hazardous Duty
change
Salary Scale No change
Line of Duty Disability
Discount Rate
change
change
Required Supplementary Information
Schedule of Employer's Share of Net OPEB Asset Disability Insurance Program (VSDP) For the Measurement Dates of June 30, 2017 through 2023
Employer’s Proportion of the Net VSDP OPEB Asset
Employer’s Proportionate Share of the Net VSDP OPEB Asset
Employer’s Proportionate Share of the Net VSDP OPEB Asset
Employer’s Covered Payroll
Schedule is intended to show information for 10 years. Since 2023 is the seventh year for this presentation, there are only seven years available. However, additional years will be included as they become available.
Required Supplementary Information
Schedule of Employer Contributions Disability Insurance Program (VSDP)
For the Years Ended June 30, 2015 through 2024
Disability Insurance Program
Notes to Required Supplementary Information for the Year Ended June 30, 2024
Changes of benefit terms – There have been no actuarially material changes to the System benefit provisions since the prior actuarial valuation.
Changes of assumptions – The actuarial assumptions used in the June 30, 2022 valuation were based on the results of an actuarial experience study for the period from July 1, 2016 through June 30, 2020, except the change in the discount rate, which was based on VRS Board action effective as of July 1, 2021 Changes to the actuarial assumptions as a result of the experience study and VRS Board action are as follows:
General State Employees:
Mortality Rates (Pre-retirement, post-retirement healthy, and disabled)
Retirement Rates
Withdrawal Rates
Disability Rates
Salary Scale
Line of Duty Disability
Discount Rate
SPORS Employees:
Mortality Rates (Pre-retirement, post-retirement healthy, and disabled)
Retirement Rates
Withdrawal Rates
Disability Rates
Update to PUB2010 public sector mortality tables. For future mortality improvements, replace load with a modified Mortality Improvement Scale MP-2020
Adjusted rates to better fit experience for Plan 1; set separate rates based on experience for Plan 2/Hybrid; changed final retirement age from 75 to 80 for all
Adjusted rates to better fit experience at each year age and service through 9 years of service
No change
No change
No change
No change
Update to PUB2010 public sector mortality tables. Increased disability life expectancy. For future mortality improvements, replace load with a modified Mortality Improvement Scale MP-2020
Increased rates for ages 55 to 61, 63, and 64 with 26 or more years of service and changed final retirement age from 65 to 70
Decreased rate for 0 years of service and increased rates for 1 to 6 years of service
No change
Salary Scale No change
Line of Duty Disability
Discount Rate
No change
No change
Disability Insurance Program
Notes to Required Supplementary Information for the Year Ended June 30, 2024
VaLORS Employees:
Mortality Rates (Pre-retirement, post-retirement healthy, and disabled)
Retirement Rates
Withdrawal Rates
Disability Rates
Update to PUB2010 public sector mortality tables. Increased disability life expectancy. For future mortality improvements, replace load with a modified Mortality Improvement Scale MP-2020
Increased rates at some younger ages, decreased at age 62, and changed final retirement age from 65 to 70
Adjusted rates to better fit experience at each year age and service through 9 years of service
No change
Salary Scale No change
Line of Duty Disability
Discount Rate
No change
No change
Required Supplementary Information
Schedule of Employer's Share of Total OPEB Liability
Pre-Medicare Retiree Healthcare Program
For the Measurement Dates of June 30, 2017 through 2023
Employer’s Proportion of the collective total OPEB Liability
Employer’s Proportionate Share of the collective total OPEB Liability
Employer’s CoveredEmployee Payroll
Employer’s Proportionate Share of the collective total OPEB liability as a Percentage of its CoveredEmployee Payroll
Schedule is intended to show information for 10 years. Since 2023 is the seventh year for this presentation, only seven years of data is available. However, additional years will be included as they become available.
Pre-Medicare Retiree Healthcare Program
Notes to Required Supplementary Information for the Year Ended June 30, 2024
There are no assets accumulated in a trust to pay related benefits.
Changes of benefit terms – There have been no changes to the benefit provisions since the prior actuarial valuation.
Changes of assumptions – There were not any changes in assumptions since the June 30, 2022 measurement date. The following remained constant since the prior measurement date:
Spousal Coverage
Retiree Participation
Rate remained at 20%
Rate remained at 35%
Retiree participation was based on a blend of recent experience and the prior year assumptions.
The trend rates were updated based on economic conditions as of June 30, 2023. Additionally, the discount rate was decreased from 3.54% to 3.65% based on the Bond Buyers GO 20 Municipal Bond index as of June 30, 2023.

June 1, 2025
The Honorable Glenn Youngkin
Governor of Virginia
Joint Legislative Audit and Review Commission
Board of Directors
Virginia Economic Development Partnership
Jason El Koubi, President and CEO
Virginia Economic Development Partnership
INDEPENDENT AUDITOR’S REPORT
Report on Audit of the Financial Statements
Opinions
We have audited the financial statements of the governmental activities and each major fund of the Virginia Economic Development Partnership (Partnership), a component unit of the Commonwealth of Virginia, as of and for the year ended June 30, 2024, and the related notes to the financial statements, which collectively comprise the Partnership’s basic financial statements as listed in the table of contents.
In our opinion, the accompanying financial statements referred to above present fairly, in all material respects, the respective financial position of the governmental activities and each major fund of the Partnership as of June 30, 2024, and the respective changes in financial position and the budgetary comparison for the General Fund and Special Revenue Fund for the year then ended, in accordance with accounting principles generally accepted in the United States of America.
Basis for Opinions
We conducted our audit in accordance with auditing standards generally accepted in the United States of America (GAAS) and the standards applicable to financial audits contained in Government Auditing Standards issued by the Comptroller General of the United States (Government Auditing Standards) Our responsibilities under those standards are further described in the Auditor’s Responsibilities for the Audit of the Financial Statements section of our report. We are required to be independent of the Partnership, and to meet our other ethical responsibilities, in accordance with the relevant ethical requirements relating to our audit. We believe that the audit evidence we have obtained is sufficient and appropriate to provide a basis for our audit opinions
www.apa.virginia.gov | (804) 225-3350 | reports@apa.virginia.gov
Emphasis of Matter
Change in Accounting Principle
As discussed in Note 1 of the accompanying financial statements, the Partnership implemented Governmental Accounting Standards Board (GASB) Implementation Guide 2021-1 Question 5.1, related to capitalizing groups of assets. Our opinions are not modified with respect to this matter.
Responsibilities of Management for the Financial Statements
Management is responsible for the preparation and fair presentation of the financial statements in accordance with accounting principles generally accepted in the United States of America, and for the design, implementation, and maintenance of internal control relevant to the preparation and fair presentation of financial statements that are free from material misstatement, whether due to fraud or error.
In preparing the financial statements, management is required to evaluate whether there are conditions or events, considered in the aggregate, that raise substantial doubt about the Partnership’s ability to continue as a going concern for twelve months beyond the financial statement date, including any currently known information that may raise substantial doubt shortly thereafter.
Auditor’s Responsibilities for the Audit of the Financial Statements
Our objectives are to obtain reasonable assurance about whether the financial statements as a whole are free from material misstatement, whether due to fraud or error, and to issue an auditor’s report that includes our opinions Reasonable assurance is a high level of assurance but is not absolute assurance and therefore is not a guarantee that an audit conducted in accordance with GAAS and Government Auditing Standards will always detect a material misstatement when it exists. The risk of not detecting a material misstatement resulting from fraud is higher than for one resulting from error, as fraud may involve collusion, forgery, intentional omissions, misrepresentations, or the override of internal control. Misstatements are considered material if there is a substantial likelihood that, individually or in the aggregate, they would influence the judgment made by a reasonable user based on the financial statements.
In performing an audit in accordance with GAAS and Government Auditing Standards, we:
• Exercise professional judgment and maintain professional skepticism throughout the audit.
• Identify and assess the risks of material misstatement of the financial statements, whether due to fraud or error, and design and perform audit procedures responsive to those risks. Such procedures include examining, on a test basis, evidence regarding the amounts and disclosures in the financial statements.
• Obtain an understanding of internal control relevant to the audit in order to design audit procedures that are appropriate in the circumstances, but not for the purpose of expressing an opinion on the effectiveness of the Partnership’s internal control. Accordingly, no such opinion is expressed.
• Evaluate the appropriateness of accounting policies used and the reasonableness of significant accounting estimates made by management, as well as evaluate the overall presentation of the financial statements.
• Conclude whether, in our judgement, there are conditions or events, considered in the aggregate, that raise substantial doubt about the Partnership’s ability to continue as a going concern for a reasonable period of time.
We are required to communicate with those charged with governance regarding, among other matters, the planned scope and timing of the audit, significant audit findings, and certain internal control-related matters that we identified during the audit.
Required Supplementary Information
Accounting principles generally accepted in the United States of America require that the following be presented to supplement the basic financial statements: Management’s Discussion and Analysis on pages 3 through 8; the Schedule of Employer’s Share of Net Pension Liability, the Schedule of Employer Contributions, and the Notes to Required Supplementary Information on pages 80 through 82; the Schedule of Employer’s Share of Net OPEB Liability, the Schedule of Employer’s Share of Net OPEB Asset, the Schedule of Employer Contributions, and the Notes to Required Supplementary Information for the Health Insurance Credit, Group Life Insurance, and Disability Insurance programs on pages 83 through 96; the Schedule of Employer’s Share of Total OPEB Liability and the Notes to Required Supplementary Information for the Pre-Medicare Retiree Healthcare program on pages 97 through 98. Such information is the responsibility of management and, although not a part of the basic financial statements, is required by the Governmental Accounting Standards Board who considers it to be an essential part of financial reporting for placing the basic financial statements in an appropriate operational, economic, or historical context. We have applied certain limited procedures to the required supplementary information in accordance with auditing standards generally accepted in the United States of America, which consisted of inquiries of management about the methods of preparing the information and comparing the information for consistency with management’s responses to our inquiries, the basic financial statements, and other knowledge we obtained during our audit of the basic financial statements. We do not express an opinion or provide any assurance on the information because the limited procedures do not provide us with sufficient evidence to express an opinion or provide any assurance.
Other Information
Management is responsible for the other information included in the annual report. The other information comprises the sections titled Who We Are, Our Partners, Impact Metrics, Features, FY24 in Brief, Impact in Virginia, Project Case Studies, and Progress Reports, but does not include the basic financial statements and our auditor’s report thereon. Our opinions on the basic financial statements do not cover the other information, and we do not express an opinion or any form of assurance thereon.
In connection with our audit of the basic financial statements, our responsibility is to read the other information and consider whether a material inconsistency exists between the other information and the basic financial statements, or the other information otherwise appears to be materially misstated. If, based on the work performed, we conclude that an uncorrected material misstatement of the other information exists, we are required to describe it in our report.
Other Reporting Required by Government Auditing Standards
In accordance with Government Auditing Standards, we have also issued our report dated June 1, 2025, on our consideration of the Partnership’s internal control over financial reporting and on our tests of its compliance with certain provisions of laws, regulations, contracts, grant agreements, and other matters. The purpose of that report is to describe the scope of our testing of internal control over financial reporting and compliance and the results of that testing, and not to provide an opinion on the effectiveness of internal control over financial reporting or on compliance. That report is an integral part of an audit performed in accordance with Government Auditing Standards in considering the Partnership’s internal control over financial reporting and compliance
Staci A. Henshaw AUDITOR OF PUBLIC ACCOUNTS
LCW/clj