


Alarm.com, Fairfax County
Norfolk International Terminals, Norfolk
The LEGO Group rendering, Chesterfield County
CoStar Group rendering, Richmond
Rocket Lab rendering, Accomack County
01 Virginia Talent Accelerator Program Holds Strong at No. 2 in the Nation 26 02 International Trade Plan Progress Includes Supply Chain Optimization and Program Enhancements 28 03 VEDP Creates Real Estate Solutions Division, Advances Virginia Business Ready Sites Program 30 04 VEDP Focuses on Progress and Opportunities for Rural Virginia 34 05 The Virginia Skills Initiative Will Help Virginia Identify Talent 36 06 Supporting Our Local and Regional Partners 40 I WHO WE ARE 5 II OUR PARTNERS 9 III LEADERSHIP MESSAGE 12 IV IMPACT METRICS 14 V FEATURES 25 01 The LEGO Group 42 02 Rocket Lab 44 03 CoStar Group 46 VI PROJECT CASE STUDIES 42 01 Strategic Plan 50 02 Operational Plan 53 03 Marketing Plan 54 VII PROGRESS REPORTS 48 01 Financial Statements 58 VIII APPENDIX 57
 McAfee Knob, Roanoke County

TransVirginia Bike Route,
County
Augusta
Board of Directors
The Honorable Caren Merrick – Vice Chair
Secretary of Commerce and Trade, Commonwealth of Virginia
Nancy Howell Agee
President and CEO, Carilion Clinic
Chair, GO Virginia
Carrie Hileman Chenery Principal, Valley Pike Partners
C. Daniel Clemente
Chairman and Chief Executive Officer, Clemente Development Company, Inc.
Mimi Rainero Coles
Marketing & Business Development Vice President, Permatile Concrete Products Company
The Honorable Stephen E. Cummings Secretary of Finance, Commonwealth of Virginia
Stephen A. Edwards CEO and Executive Director, The Port of Virginia
Richard “Rick” O. Harrell, III President (retired), R.O. Harrell, Inc.
William H. Hayter
Retired President & CEO, The First Bank & Trust Company
John Hewa
President and CEO, Rappahannock Electric Cooperative
April Kees
Director, Virginia Senate Finance and Appropriations Committee
Pace Lochte
Assistant Vice President for Economic Development, University of Virginia
Anne Oman
Director, House Appropriations Committee
Marianne Radcliff
President, Kemper Consulting, Inc.
Nick Rush
Agent, Krupin Partners LLC
William D. Sessoms, Jr.
Executive Vice President, TowneBank

Steven David Stone
Equity Principal, Offit Kurman
As of July 1, 2022, the service of the following VEDP Board members concluded in FY22: The Honorable Brian Ball (former Secretary of Commerce and Trade, Commonwealth of Virginia), Greg B. Fairchild (Associate Dean for Washington, D.C., Area Initiatives, University of Virginia, Darden School of Business), Deborah K. Flippo (Economic Development Program Manager, Draper Aden Associates, Inc.), The Honorable K. Joseph "Joe" Flores (former Secretary of Finance, Commonwealth of Virginia), Ned W. Massee (Partner, Croatan Advisors), Vincent J. Mastracco (Partner, Kaufman & Canoles PC), Dan Pleasant (Chief Operating Officer, Dewberry), and Xavier R. Richardson (Executive Vice President, Corporate Development & Community Benefit, Mary Washington Healthcare; President, Mary Washington Hospital & Stafford Hospital Foundations).
3
4
WHO WE ARE
The Virginia Economic Development Partnership (VEDP) is the state economic development authority for the Commonwealth of Virginia. Created in 1995, VEDP collaborates with local, regional, and state partners to encourage the expansion and diversification of Virginia’s economy. VEDP works to accomplish these objectives through a variety of activities, including marketing and lead generation; business retention, expansion, and attraction; trade development; business intelligence; competitive benchmarking; site development; performance-based incentives; and talent solutions.
Working closely with partners, VEDP has adopted five transformational goals for Virginia and VEDP that represent the central focus of its work:
1. Robust State Growth. Position Virginia to achieve a growth rate in employment and median earned income among that of the top 5–10 states in the U.S.
2. Every Region Wins. Ensure that every region participates in the growth of the Commonwealth (i.e., all with positive growth in employment and median earned income).
3. Best State for Business. Restore Virginia to its previous position near the top of the national business climate rankings (i.e., average rank among the top 3–5 states).
4. Top State EDO. Reestablish and sustain VEDP as one of America’s most effective state economic development organizations.
5. Super Collaborator. Exhibit collaboration and coordination as hallmarks of VEDP (i.e., place a central focus on the “P” in VEDP).
5
INTERNATIONAL TRADE
Provides export development programs, services, and grants to help Virginia companies grow their international sales
VIRGINIA TALENT ACCELERATOR PROGRAM
Provides customized recruitment and training solutions that give Virginia a competitive edge in securing business investment projects
RESEARCH
Conducts in-depth analysis and creates tailored client materials that convey Virginia’s competitive advantages
REAL ESTATE SOLUTIONS
Collaborates with partners to develop a portfolio of Virginia properties that meet the needs of companies
INCENTIVES
Reviews, vets, tracks, and coordinates VEDP’s performance-based incentive programs, along with incentive structuring for major projects
FISCAL AND SUPPORT SERVICES
Provides a financial framework for VEDP to accomplish its mission through accounting, budgeting, and procurement
MARKETING & COMMUNICATIONS
Markets the Commonwealth to raise awareness of Virginia’s advantages for business and to cultivate new leads
BUSINESS INVESTMENT
Collaborates with partners to implement lead generation and project management strategies
VIRGINIA OFFICE OF EDUCATION ECONOMICS (VOEE)
Leverages data to guide educational and workforce policy and practice on the availability, quality, and supply of talent in Virginia
REGIONAL TALENT SOLUTIONS AND BUSINESS OUTREACH
Connects Virginia companies with workforce solutions and collaborates with partners to strengthen relationships with existing businesses
ECONOMIC COMPETITIVENESS
Develops strategies to improve the foundations for state, regional, and local economic growth
EXTERNAL AFFAIRS
Oversees the budget, legislative, and policy development process; encourages collaboration and coordination among partners
HUMAN RESOURCES
Seeks to hire, retain, and develop the best and the brightest to accomplish VEDP’s mission and goals
INFORMATION TECHNOLOGY
Supports VEDP’s technology platforms, including a variety of custom tech solutions
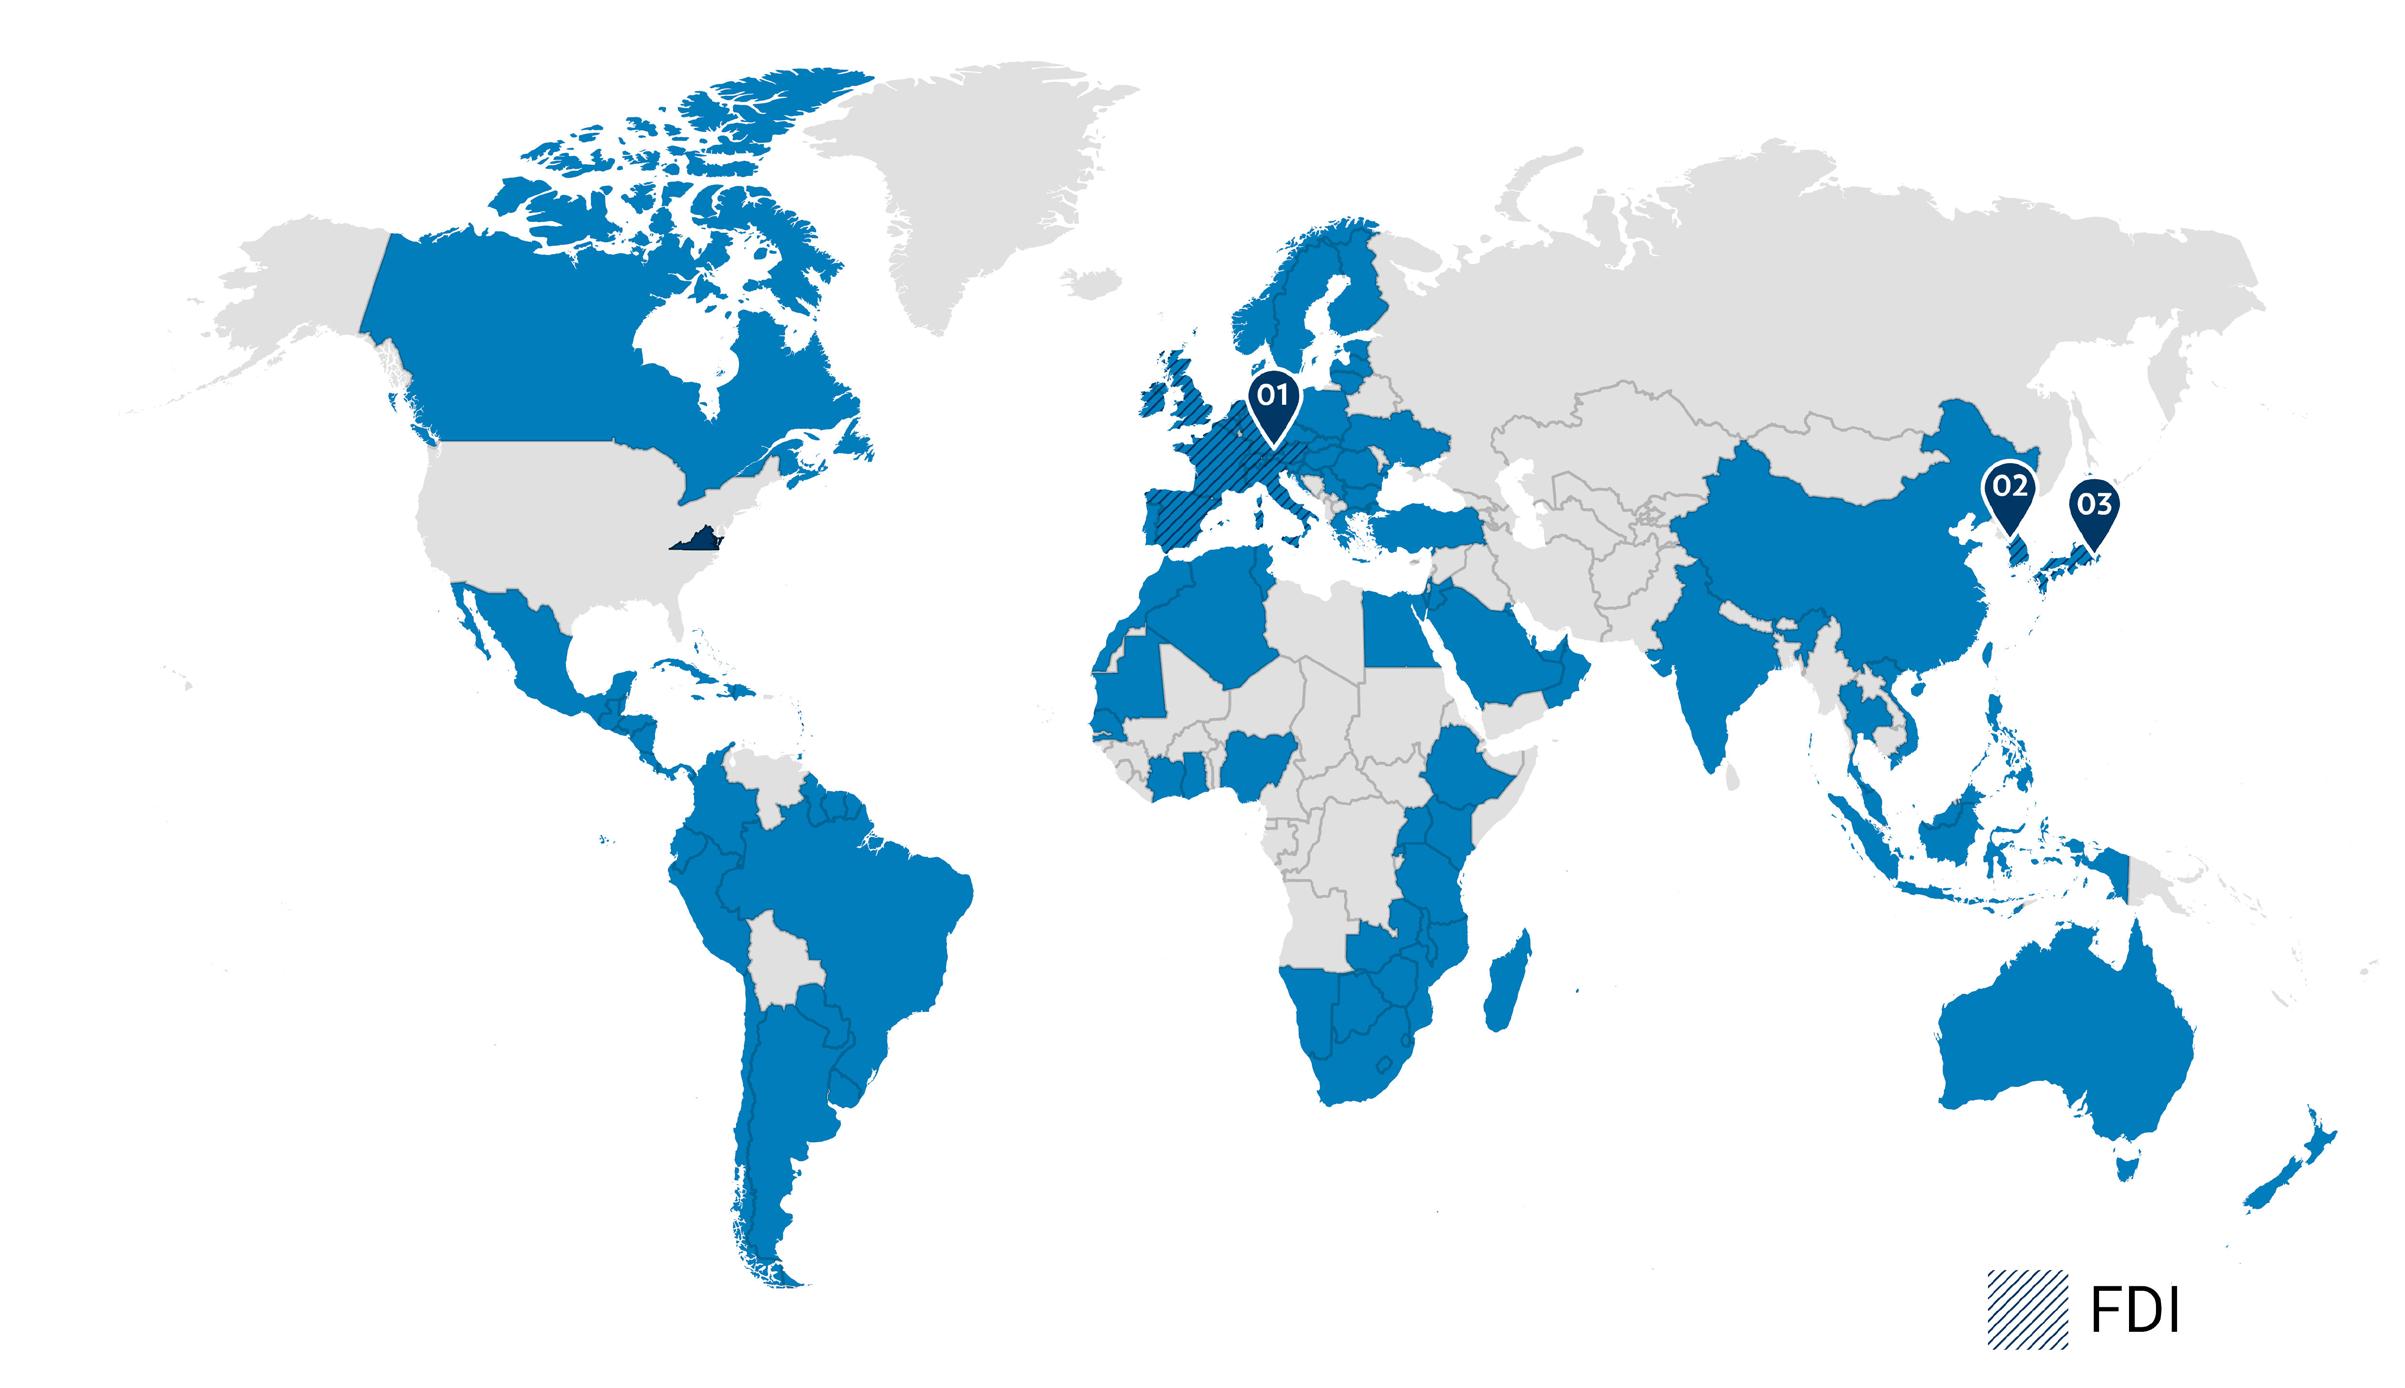
VEDP's Global Network
FOREIGN DIRECT INVESTMENT OFFICES
VEDP’s international business investment offices implement lead generation strategies to identify and convert high-potential foreign direct investment leads and prospects into project opportunities for Virginia.


TRADE REPRESENTATION
Europe
Korea
Japan
VEDP's network of international research consultants covers more than 123 countries around the world. These experts provide in-country market research for Virginia exporters, specific to the needs and opportunities for each company.
Algeria
• Anguilla
Barbados
• Antigua & Barbuda
• Belgium
Cayman Islands
Denmark
France
Haiti
• Belize
• Chile
• Dominica
• Bermuda
• China
• Argentina
• Botswana
• Colombia
• Dominican Republic
• French Guiana
• Honduras
Jordan
• Kenya
Martinique
Netherlands
Paraguay
Senegal
St. Martin
• Germany
• Hong Kong
• Kuwait
• Mauritania
• Aruba
• Brazil
• Costa Rica
• Ecuador
• Ghana
• Hungary
• Latvia
• Australia
• Austria
• Bahamas
• British Virgin Islands
• Côte
• Egypt
• Greece
• India
• Lesotho
• Mauritius
• Netherlands Antilles
• Peru
• Serbia
• Philippines
• Seychelles
• St. Kitts & Nevis
Switzerland
UAE
• Taiwan
• Uganda
d'Ivoire
• Croatia
• El Salvador
• Grenada
• Indonesia
• Lithuania
• Mexico
• New Zealand
• Poland
• Singapore
• St. Lucia
• Tanzania
• Ukraine
• Bahrain
• Bulgaria
• Cuba
• Estonia
• Guadeloupe
• Ireland
• Macau
• Montserrat
• Nicaragua
• Portugal
• Slovakia
• Qatar
• Israel
• Canada
• Czech Republic
• Ethiopia
• Guatemala
• Italy
• Madagascar
• Morocco
• Nigeria
• Slovenia
• Finland
• Guyana
• Jamaica
• Malawi
• Mozambique
• Norway
• Romania
• Oman
• Rwanda
• South Africa
• St. Vincent & the Grenadines
• Thailand
• Trinidad & Tobago
• United Kingdom
• Uruguay
• Suriname
• Tunisia
• Vietnam
• Japan
• Malaysia
• Namibia
• Panama
• Saudi Arabia
• South Korea
• Swaziland
• Turkey
• Spain
• Sweden
• Turks & Caicos
• Zambia
• Zimbabwe
8
Our Partners


VEDP conducts its work in collaboration with hundreds of economic development partners. Core VEDP partners include the Governor and the Administration, Virginia General Assembly, other state agencies, 17 regional economic development organizations, over 100 local economic development partners, utilities, railroads, and trade associations.


9
STATE COUNCIL OF HIGHER EDUCATION FOR VIRGINIA
VIRG I NIA
Regional Economic Development Organizations


10
Unaffiliated localities


11
Leadership Message
As the world emerged from the global pandemic, FY22 marked one of the most pivotal and productive time periods ever for VEDP.
We thanked VEDP’s former CEO Stephen Moret for his distinguished service and enormous impact and welcomed a new, energetic set of Administration partners led by Governor Glenn Youngkin, who is focused on economic development and growth as a top priority.
Amidst these transitions, VEDP completed substantially all of the big goals we set for FY22, including significantly exceeding our goals for VEDP-assisted job creation and capital investment. We also made progress on many major initiatives that will drive additional growth in the coming years, including the establishment of a dedicated Real Estate Solutions team that will guide the Commonwealth’s historic investment in site development that was recently approved by the General Assembly and Governor.
We are working collaboratively to position Virginia for a healthy economic recovery, focused on economic development initiatives that will accelerate Virginia’s return to pre-COVID-19 employment levels, as well as drive robust state job and wage growth over the next several years while leveraging all regions of the Commonwealth in our economic progress.
This annual report highlights some of VEDP’s notable accomplishments in FY22, all of which were made
possible in large part by the great work and support of our local, regional, and state partners, including Governor Youngkin, Secretary of Commerce and Trade Caren Merrick, former Governor Northam, former Secretary of Commerce and Trade Brian Ball, the Virginia General Assembly, members and staff of the Major Employment and Investment (MEI) Commission, The Port of Virginia, the Virginia Chamber of Commerce, the Virginia Economic Developers Association (VEDA), county and city government leaders, and hundreds of state, local, and regional economic development partners, among others.
Through a combination of leadership, dedicated staff work, and active support from our partners, VEDP and Virginia have made substantial progress toward achieving each of our five transformational goals (see page 49). Indeed, we are further along than any of us could have imagined when we completed our Strategic Plan in FY18. Nevertheless, there is much left to do.
Over the next few years, VEDP’s mission will be more important than ever as Virginia works to fully recover from the pandemic and achieve rapid economic growth with success in every region.
Thank you for your interest in VEDP, as well as your support of economic development in the Commonwealth of Virginia. Together we are positioning Virginia for a healthy and vibrant economic future.
DAN M. PLEASANT Board Chair FY22
JASON EL KOUBI President and CEO
12
 Big Meadows, Shenandoah National Park, Madison County
A Stellar Year for Business Development in the Commonwealth
VEDP-assisted project announcements
102 PROJECTS
VEDP, in collaboration with its local, regional, and state partners, had a tremendous FY22, substantially exceeding all business investment goals. The year's remarkable performance was highlighted by an astonishing $34 billion in new capital investment.
17,203 DIRECT JOBS
VEDP-generated leads
$34b CAPITAL INVESTMENT
378 LEADS CREATED
211 LEADS CONVERTED
14
FY22 LEAD GENERATION PROGRAM BY THE NUMBERS
Prospect calls completed by VEDP’s Call Center
Prospects targeted
Prospect meetings conducted by VEDP’s business managers
New leads generated for Virginia
Corporate prospects visited Virginia as a result of VEDP-generated leads
Project wins for Virginia from VEDP-generated leads
BUSINESS INVESTMENT: PARTNER AND CLIENT SATISFACTION
VEDP implements partner and client surveys to assist in evaluating project management effectiveness. The program received high approval in FY22.
Project management
Strongly Agree Agree Disagree
Overall average response that VEDP effectively manages economic development projects
15
~44,000 33,000+ ~1,275 378 149 58
77% 22% 1%
INTERNATIONAL TRADE
COMPANIES PARTICIPATED IN INTERNATIONAL TRADE PROGRAMS AND SERVICES IN FY22 377
151 Market research by VEDP staff and a network of in-country consultants helps Virginia exporters access opportunities and market information in more than 123 countries.
91 Trade missions and trade shows place Virginia exporters directly in front of potential international customers, including eight missions hosted by VEDP per year and participation in seven major international trade shows.
75 State Trade Expansion Program (STEP) offers grant funding for international travel and global marketing activities.
64 Virginia Leaders in Export Trade (VALET) Program, a two-year export accelerator program, assists participating companies to develop and implement an international sales strategy utilizing the full range of VEDP’s export development resources.
56 Regional Export Program (REP) gives exporters access to a range of VEDP International Trade services and ongoing counseling to reach specific export goals in just one year.
53 Trade show program (TSP) provides resources for Virginia exporters exhibiting individually at international trade shows.
29 Supply Chain Optimization Program helps companies evaluate and streamline their supply chain management and import processes through counseling, strategy development, and resources to improve performance and reduce costs.
24 Global Defense Program (GDP) is designed to meet the specific needs of exporters in the defense industry and provides participants with access to VEDP’s services to target one or two global markets over one year.
16
INTERNATIONAL TRADE CLIENT SATISFACTION
International Trade achieved exceptionally high scores for the quality of its programs and services in FY22.
99% Companies that were “extremely likely” or “likely” to recommend VEDP’s export assistance programs to other Virginia companies
96% Companies that rated the quality of VEDP International Trade’s export assistance as “excellent” or “above average”
99% Companies that were “extremely likely” or “likely” to use VEDP International Trade for export assistance in the future
97% Companies that say VEDP International Trade helped their company work toward achieving its strategic international goals
It’s really nice to have VEDP with so many resources to just step in and help guide and ensure success in expanding internationally.
NANCI HARDWICK CEO,
PERFORMANCE METRICS
In FY22, more than 370 Virginia companies utilized VEDP’s export assistance and supply chain optimization programs and services to expand their international sales and meet new customers overseas. These companies reported strong international sales numbers, attributing over $800 million in new or existing sales to their work with VEDP. In total, over 7,300 jobs in the Commonwealth in FY22 can be attributed to the work of VEDP’s International Trade Division.

17
Aeroprobe Corporation
Aeroprobe Corporation, Christiansburg
Performance Metric (FY22) Description Actual Companies enrolled in programs Number of companies enrolled in VEDP Trade programs 377 International sales Existing international sales attributed to VEDP Trade programs $470M New or increased international sales attributed to VEDP Trade programs $343M Total international sales attributed to VEDP Trade programs $813M Trade-supported jobs Trade-supported jobs from companies enrolled in VEDP Trade programs 7,319

Harkness Screens in Botetourt County manufactures high-quality movie screens for major cinema companies around the world. Impacted by the global pandemic, the company turned to VEDP’s International Trade Division to increase its international customer base.

Our sincere thanks to VEDP for the funding that enabled us to participate in the trade shows last August and April. We received a large order from an international customer operating on three continents. There is no question that the meetings we had with them at the trade shows last August and April made a big contribution to making this happen. We are now moving ahead with recruiting nine new positions based in the Roanoke plant.
ANTHONY KELLY SVP Americas, Harkness Screens
VIRGINIA JOBS INVESTMENT PROGRAM (VJIP)
256 Client projects supported with the VJIP incentive
80 Localities which had a VJIP-supported project
50% Half of VEDP-assisted project wins supported by the VJIP incentive
$30.06 Average hourly wage for VJIP projects
24 VEDP-assisted project wins led by the Talent Solutions regional team (projects representing 1,587 jobs and $248 million CapEx)
100% FY22 VJIP Client Satisfaction Survey respondents "strongly agree" or "agree" that VJIP contributed to their growth and success
20

Alarm.com, Fairfax County
With three locations in Virginia, Speyside Bourbon Cooperage, Inc. has supported and strengthened its workforce through funding from the Virginia Jobs Investment Program. At the Smyth County location, employee Connor Patton benefited from that support by obtaining the additional training needed to move from his role as an operator into a lead position.
I joined the Speyside team with zero manufacturing experience, but I was eager to learn. After working in the Stave Department, I became well versed in the equipment and operation. Eventually, I was asked be a part of the actual barrel assembly, which is where I feel most comfortable. My hard work and knowledge of the equipment was recognized, and I was promoted, first to Team Lead and most recently to Production Supervisor. I am excited to see the company grow and to see myself grow along with it.
CONNOR PATTON Production Supervisor, Speyside Bourbon Cooperage


Rocket
Lab, Accomack County
01 Virginia Talent Accelerator Program Holds Strong at No. 2 in the Nation 02 International Trade Plan Progress Includes Supply Chain Optimization and Program Enhancements 03 VEDP Creates Real Estate Solutions Division, Advances Virginia Business Ready Sites Program 04 VEDP Focuses on Progress and Opportunities for Rural Virginia 05 The Virginia Skills Initiative Will Help Virginia Identify Talent 06 Supporting Our Local and Regional Partners FEATURES
Virginia Talent Accelerator Program Holds Strong at No. 2 in the Nation
When Governor Youngkin announced the LEGO Group’s plans to create over 1,761 jobs in Chesterfield, it pushed the total number of jobs that the Virginia Talent Accelerator Program helped to create across Virginia over 10,000 since the program commenced operations in FY20.
In FY22, the Virginia Talent Accelerator Program helped the Commonwealth secure over 6,800 new jobs for Virginians. And the LEGO Group wasn’t even the biggest win. That honor belongs to Blue Star NBR, which in October 2021 announced plans to create over 2,500 new jobs in Wythe County.
These two mega-project wins are indicative of the Virginia Talent Accelerator Program's impact across the Commonwealth. In FY22, 53% of the project wins were in rural or small metros. The other 47% were in larger metros. Similarly, 53% of the wins were companies new to Virginia, and the other 47% were expansions of existing Virginia businesses.
Helping Virginia win projects regardless of the region they’re considering is exactly what the Virginia Talent Accelerator Program was designed to do. The program’s highly equipped and expert staff can be immediately deployed anywhere in the Commonwealth to rapidly recruit and train workers on an employer’s unique processes, equipment, procedures, and culture. The program’s customized training solutions are integrated with community college support on every manufacturing project to ensure that client companies receive both short- and long-term support.
The Virginia Talent Accelerator Program team now includes 30 highly experienced professionals with expertise in talent acquisition, video services, animation, instructional design, learning technologies, manufacturing technologies, and organizational development. Business Facilities recognizes Virginia as the No. 2 customized training leader, and Area Development recognizes Virginia as the No. 2 state for workforce development programs with a significant focus on customized programs.
There are so many criteria when we select a site … I’ve never seen [anything] like the Virginia Talent Accelerator Program, and I’ve been to many places around the world to look at facilities. I have never seen the dedication, the willingness, the want to help support Virginia, future employees, and the LEGO Group in making sure we have the right fit. It’s phenomenal.
Services include:
Recruiting
■ Ad design/production
■ AI-enabled ad placements
■ Website design
■ Event coordination
Training
■ Hands-on training
■ Simulations
■ Classroom training
■ E-learning
■ 3D Illustrations
■ Animations
■ Broadcast-quality video
26
CARSTEN RASMUSSEN COO, The LEGO Group

27
The LEGO Group rendering, Chesterfield County
Area Development Business Facilities State workforce program rankings 2018–projected 2023 1 2 3 4 5 6 7 8 9 10 2018 2019 2020 2021 2022 2023 History Forecast
Source: Area Development; Business Facilities; VEDP forecast
International Trade Plan Progress Includes Supply Chain Optimization and Program Enhancements
Building upon the progress made toward the foundation-setting goals of the International Trade Strategic Plan (ITSP) in FY21, VEDP tackled several new initiatives with funding received in FY22 to provide resources to Virginia companies for supply chain management and imports, to enhance the ability to capture available federal grants, and to expand existing international trade programs and services.
In FY22, Virginia launched the nation’s first official state-led Supply Chain Optimization Program. Designed to help Virginia businesses evaluate and streamline their supply chain management and import processes, the program provides quarterly training sessions, counseling assistance, and referrals to supply chain-related experts. With VEDP assistance, participating companies also receive supply chain assessments and tackle initiatives such as implementing supply chain-related Key Performance Indicators (KPIs), applying for duty drawback, improving supplier scorecards, and conducting forecast modeling to improve buffer stock, among other activities.
To enhance the ability to capture available federal grants and manage federal grant programs, VEDP hired a dedicated Grants Manager to secure more federal funding through the U.S. Small Business Administration (SBA) State Trade Expansion Program (STEP) Grant, and worked to optimize internal resources and tools to streamline grant administration. The dedicated grants manager is also working to identify additional sources of grant funding to support Virginia companies with their international growth.
VEDP also made progress in expanding existing programs and services by adding an additional regional International Trade Manager and enhancing program capacity to accept additional participants.
The new International Trade Manager will serve and recruit 40 additional companies to utilize VEDP programs and services, including the Virginia Leaders in Export Trade (VALET) Program, Regional Export Program, Trade Show Program, trade missions and trade shows, and international market research.
These activities represent important progress in implementing Virginia’s strategy to help businesses become stronger, more resilient, and more competitive in the international marketplace. In preparation for receiving additional funding for the plan in FY23, VEDP also made progress in developing plans to introduce a comprehensive training curriculum to develop international business capacity for companies across Virginia, to develop an international trade intern program to provide Virginia businesses with trained interns from partnering Virginia universities, and to launch customized international business services targeted to high-volume/high-value Virginia businesses.
VEDP looks forward to continuing progress on these initiatives and implementing new initiatives to achieve the significant goals of the ITSP, including reaching more Virginia companies with VEDP export and supply chain assistance programs. In FY22 the International Trade Division served 377 companies, surpassing their goal of 360, and in FY23 plans to serve 450 companies, a 25% increase in the number of Virginia companies utilizing these services. VEDP is also focused on ensuring that as the reach and scope of international trade services expand, they remain valuable to the businesses utilizing them. In FY22, companies served by VEDP International Trade attributed $813 million in international sales to having used VEDP export assistance services. Indicating the high value companies place on these services, 99% of those assisted by VEDP International Trade in FY22 said they would recommend them to other companies.
28
PARTNER AGENCIES:


29
VIRG I NIA
Norfolk International Terminals, Norfolk
VEDP Creates Real Estate Solutions Division, Advances Virginia Business Ready Sites Program
With short speed-to-market timelines and significant utility capacity requirements, large projects require substantial upfront investment in site development. Too often, these projects go to competitors due to Virginia’s lack of large project-ready sites. The lack of prepared sites has been a primary cause of the Commonwealth losing out on projects representing over 52,000 direct jobs and $120 billion in capital investment since 2016.
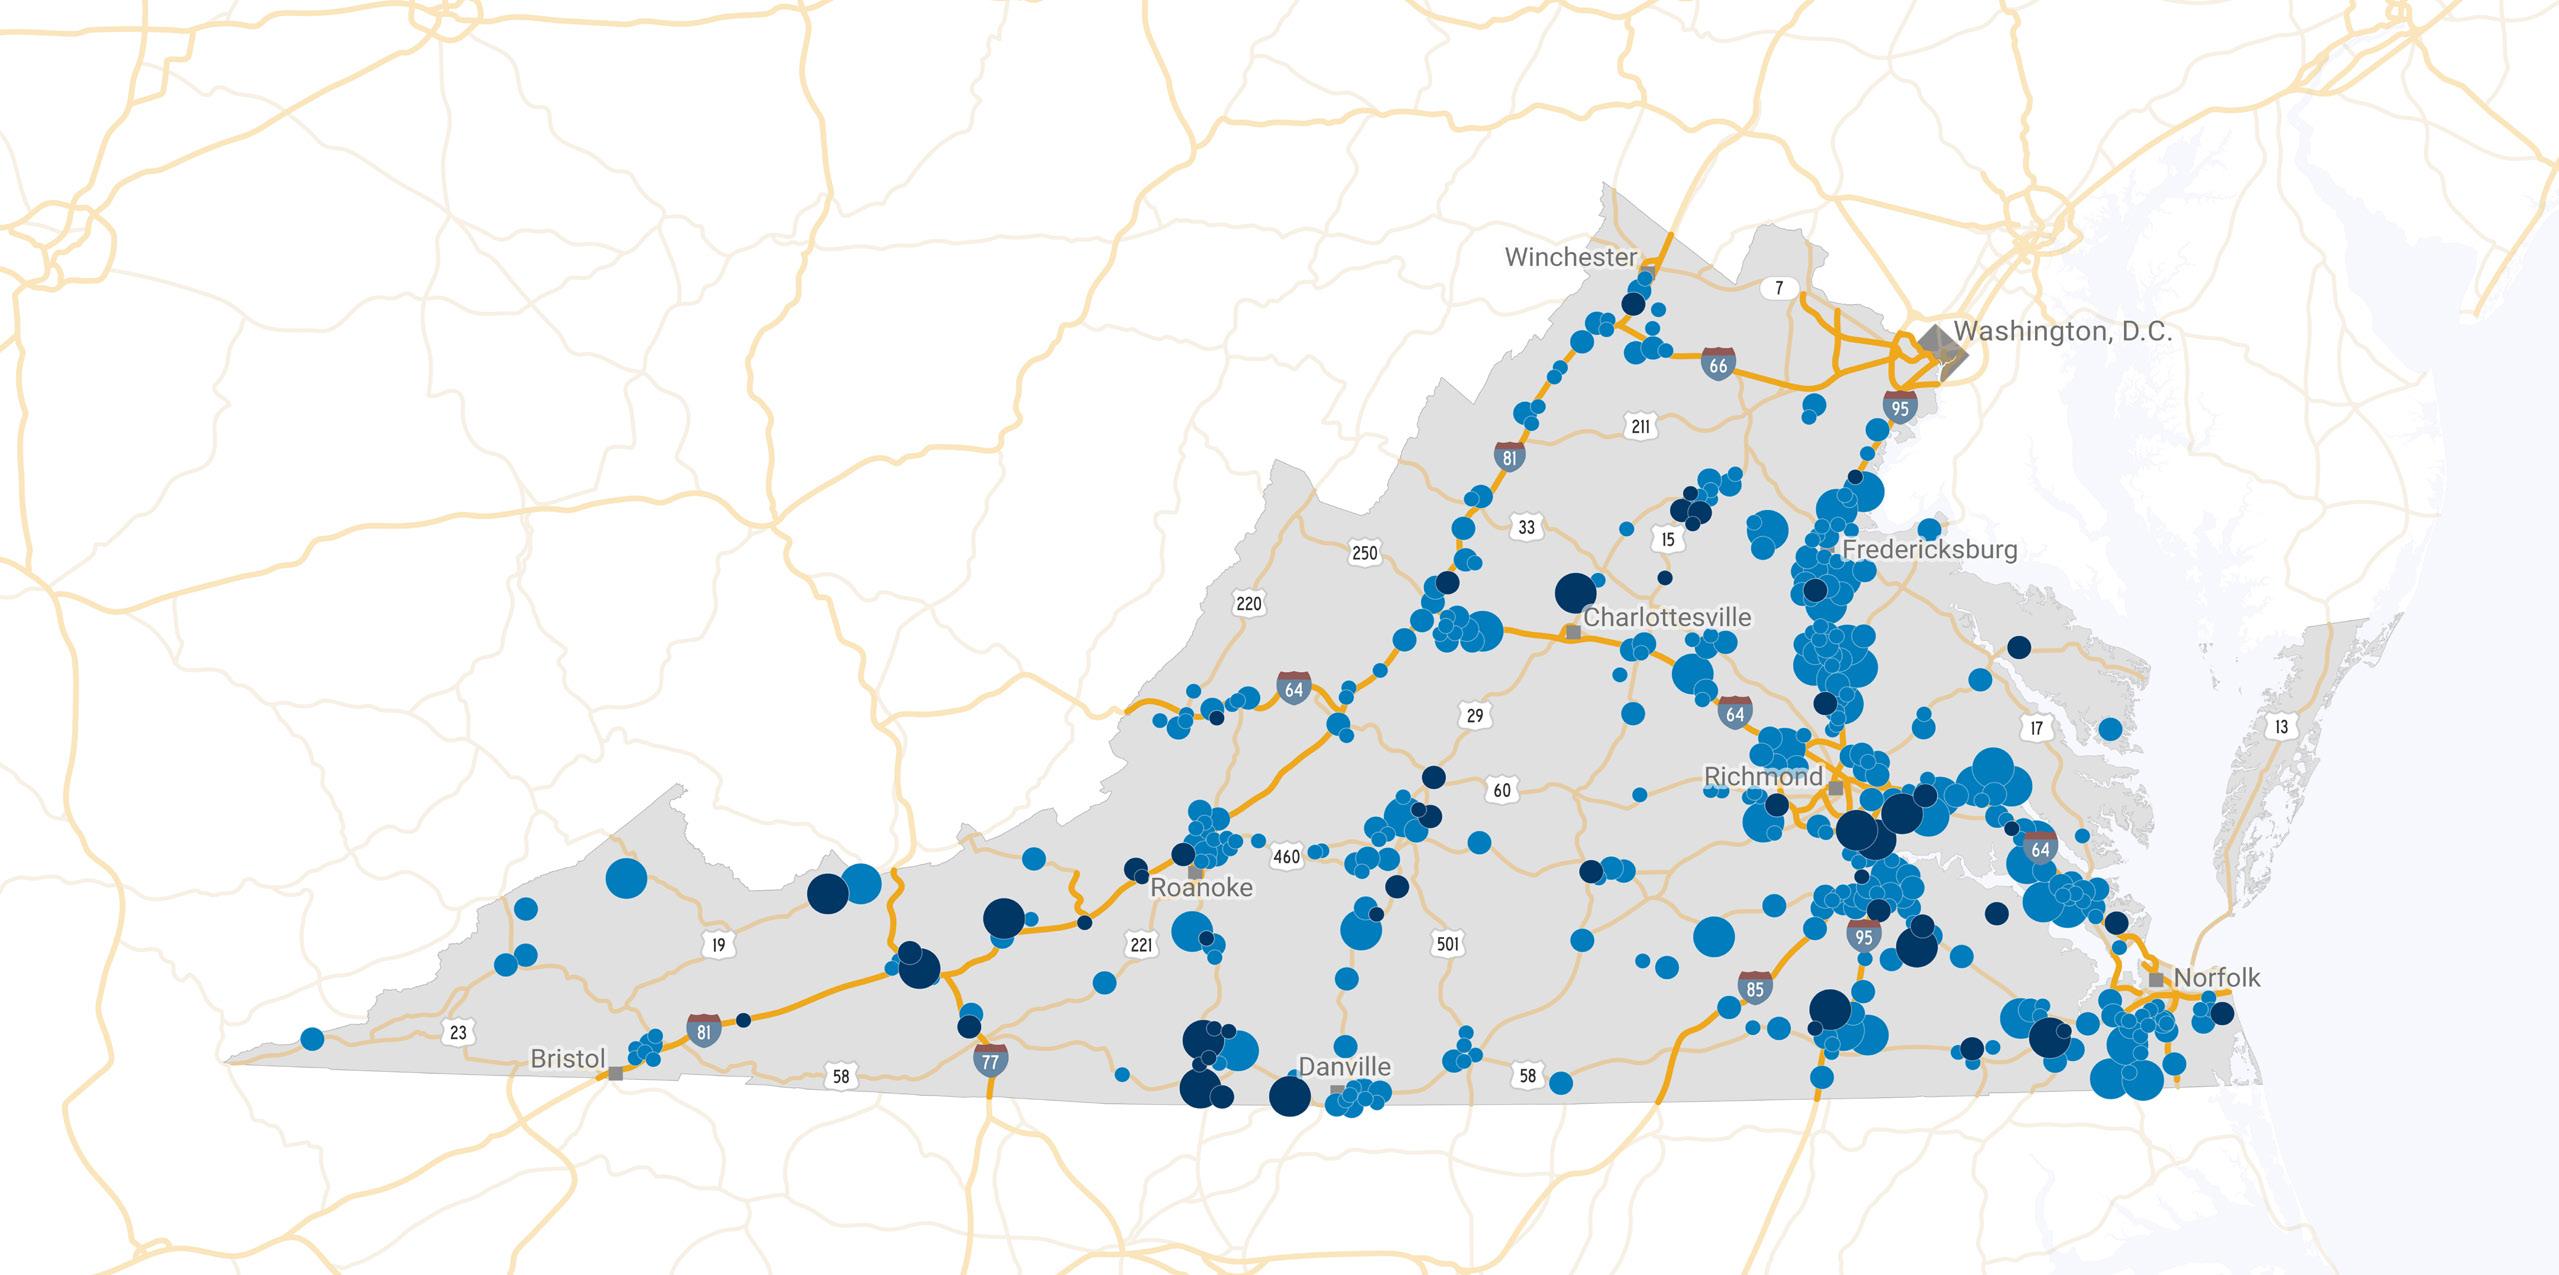
Building on the momentum generated by the novel, first-in-the-country site characterization initiative that evaluated more than 460 sites, VEDP created the Real Estate Solutions Division to strengthen support for site development in the Commonwealth. Real Estate Solutions integrates the existing Sites and Buildings team under a VP-level position to strategically pursue current and future site development opportunities. The division analyzes, develops, and implements solutions to the site and building needs of economic development projects across Virginia.
The Real Estate Solutions Division also administers the Virginia Business Ready Sites Program (VBRSP). With new funding for VBRSP approved in 2021, Virginia invested $7 million in 11 strategic sites, improving their readiness to compete for economic development projects. Thanks to an unprecedented level of support from the General Assembly and Governor this year, VEDP is preparing to make further VBRSP investments of $159 million over the 2022–2024 biennium. These improvements will bring jobs and capital investment to the Commonwealth by filling critical gaps in Virginia’s site portfolio.
VEDP is also collaborating with partners to strengthen other site development programs. For example, VEDP worked with VDOT to update the Economic Development Access Program, which provides funding for access road improvements. The changes, which were unanimously approved by the Commonwealth Transportation Board, will broaden the use of the program. VEDP is working with the State Corporation Commission to develop and implement a program to encourage and expedite infrastructure investments by investor-owned electric utilities. The Real Estate Solutions Division is also consulting with developers to better understand how to strengthen public-private partnerships in site development, with the goal of engaging more private funding sources for site investments.
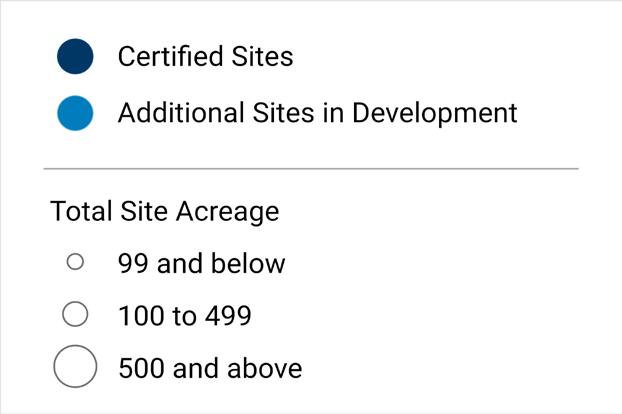
Size and certification status of sites across Virginia

 Summit View Business Park, Franklin County
White Oak Technology Park, Henrico County
Summit View Business Park, Franklin County
White Oak Technology Park, Henrico County
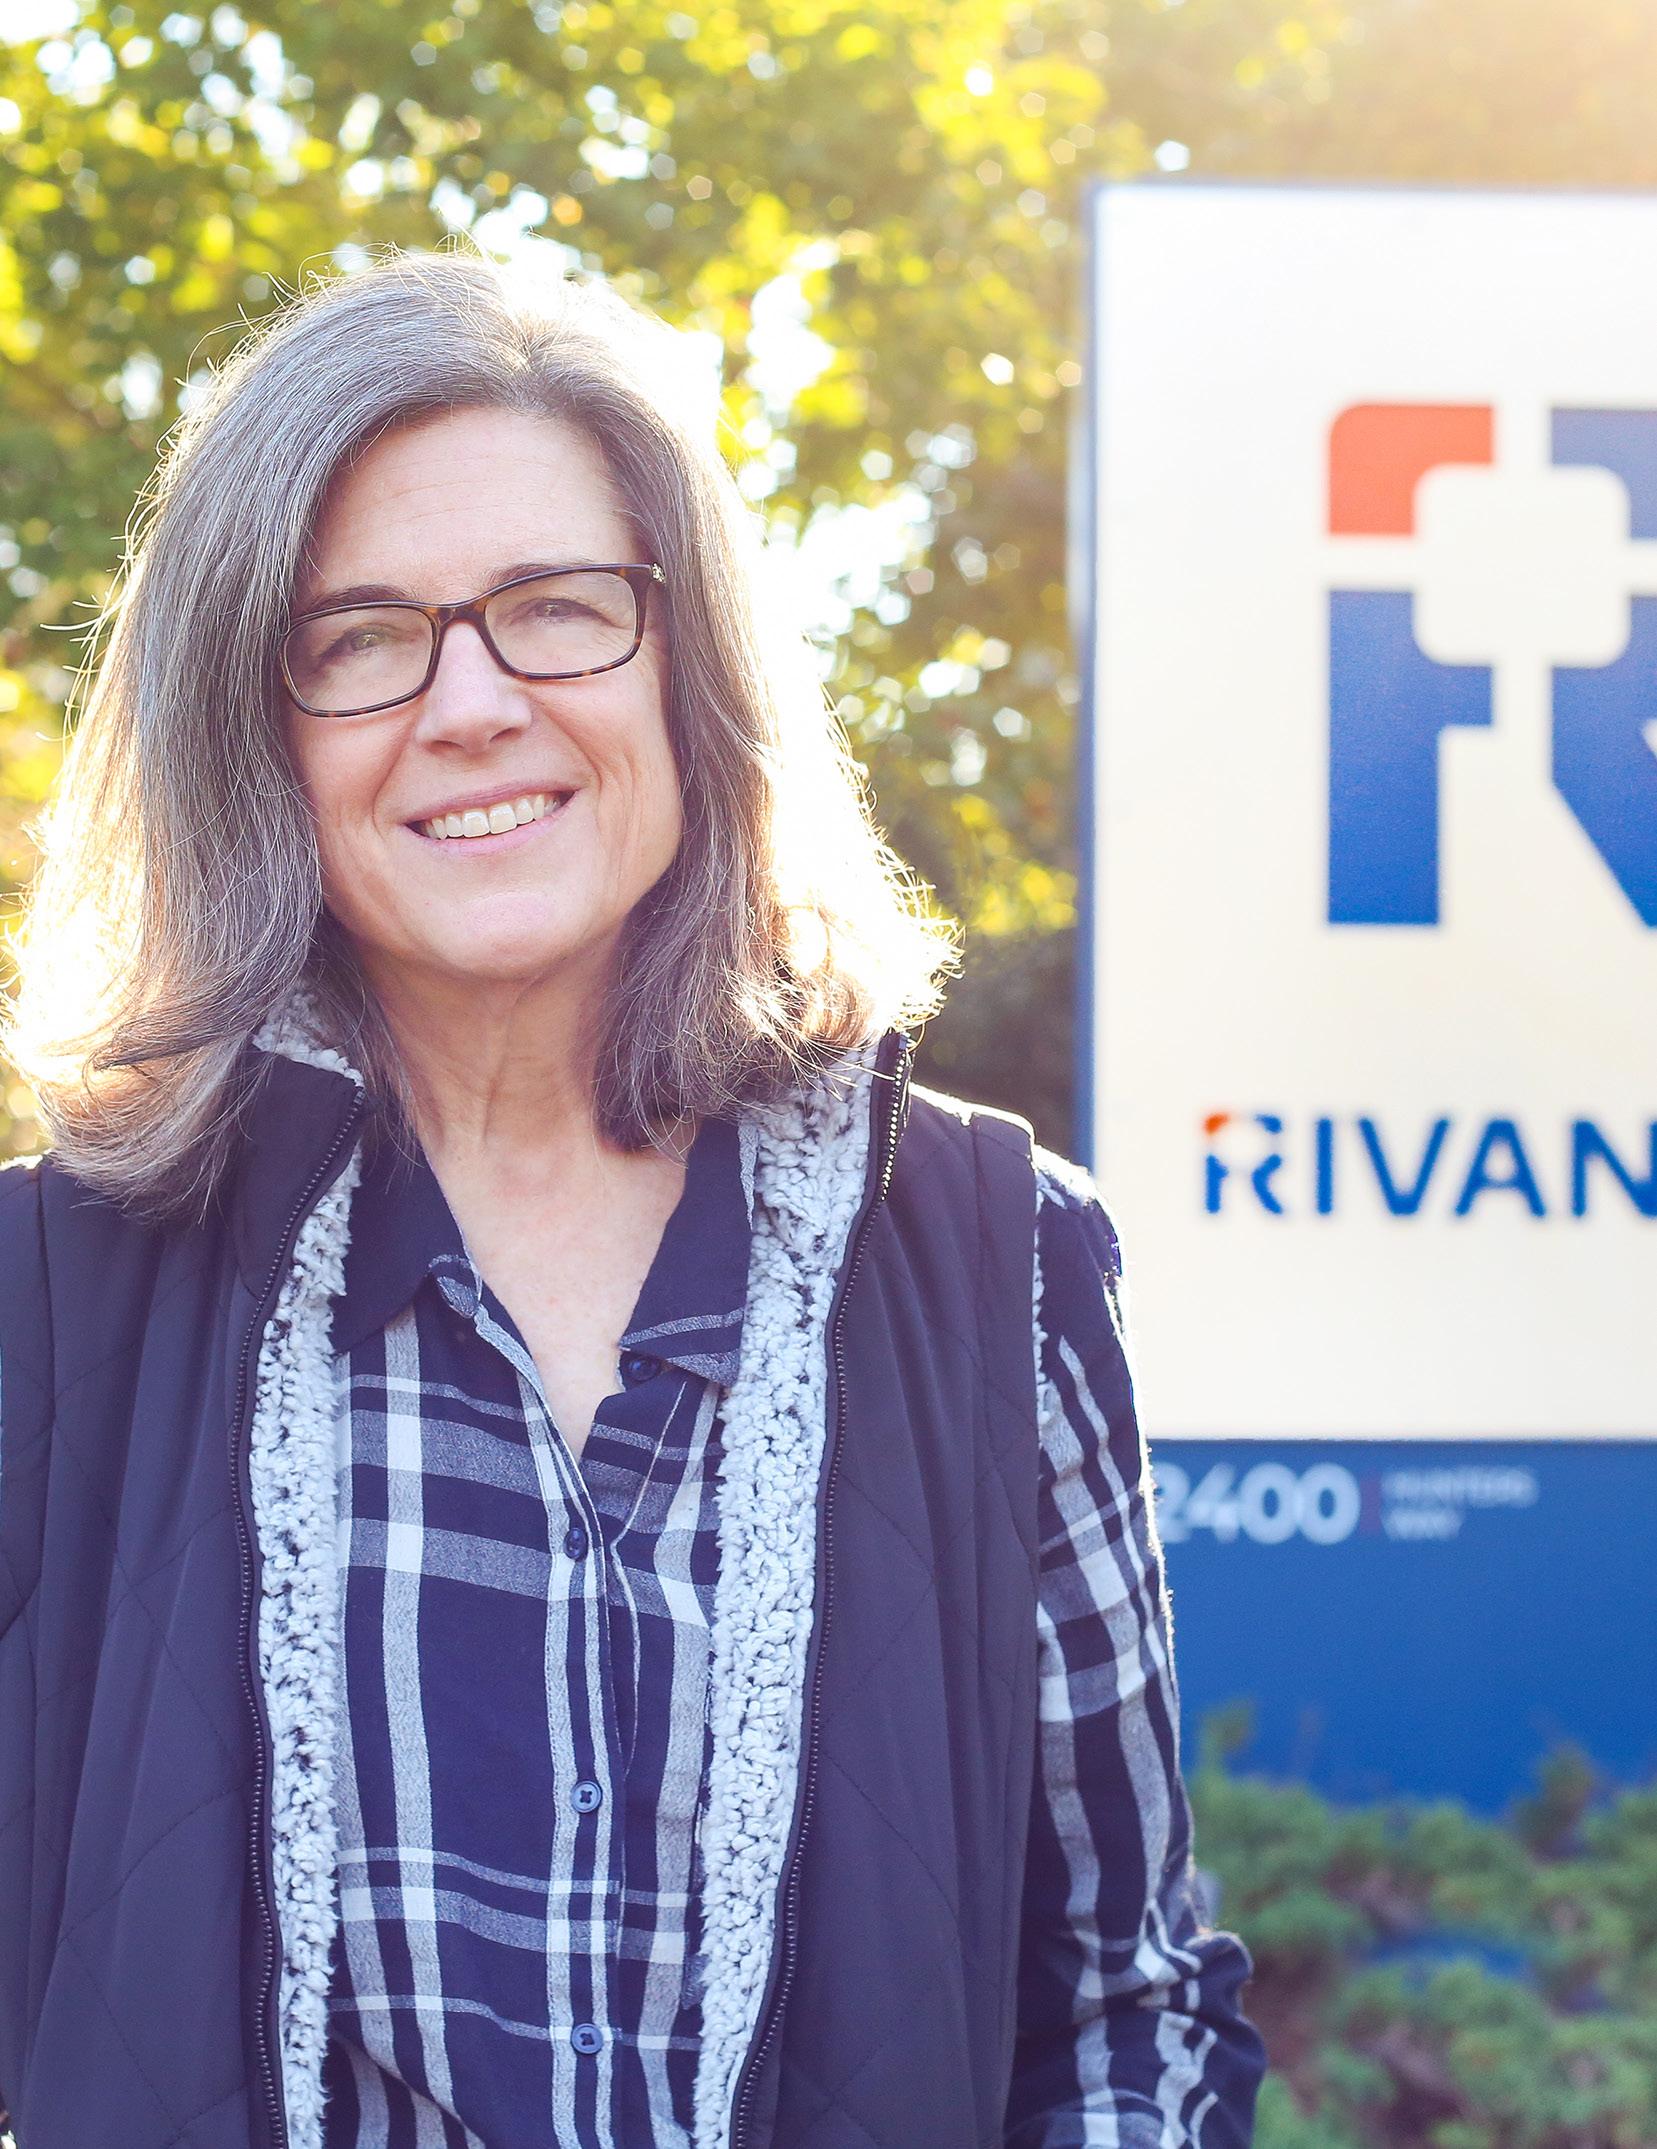
RIVANNA® participated in Economic Gardening in Q4 of 2021. In December 2021, former Governor Ralph Northam announced an expansion project at RIVANNA to invest $260,000 to expand and renovate its facility in Albemarle County and create 18 new jobs. The Virginia Jobs Investment Program (VJIP) will support the company’s recruitment and training activities for the project. RIVANNA is also currently participating in VEDP’s VALET Program.
The Economic Gardening Program provided our marketing team with a playbook for reaching an entirely new demographic, including digital tactics, social watering holes to engage with, and specific intel defining our target demographic. The research has equipped us with the knowledge to launch a campaign; more importantly, the tactics provided have made us aware of the resources necessary to ensure a successful campaign.
VICKI BROTHERS Director of Marketing, RIVANNA®

VEDP Focuses on Progress and Opportunities for Rural Virginia
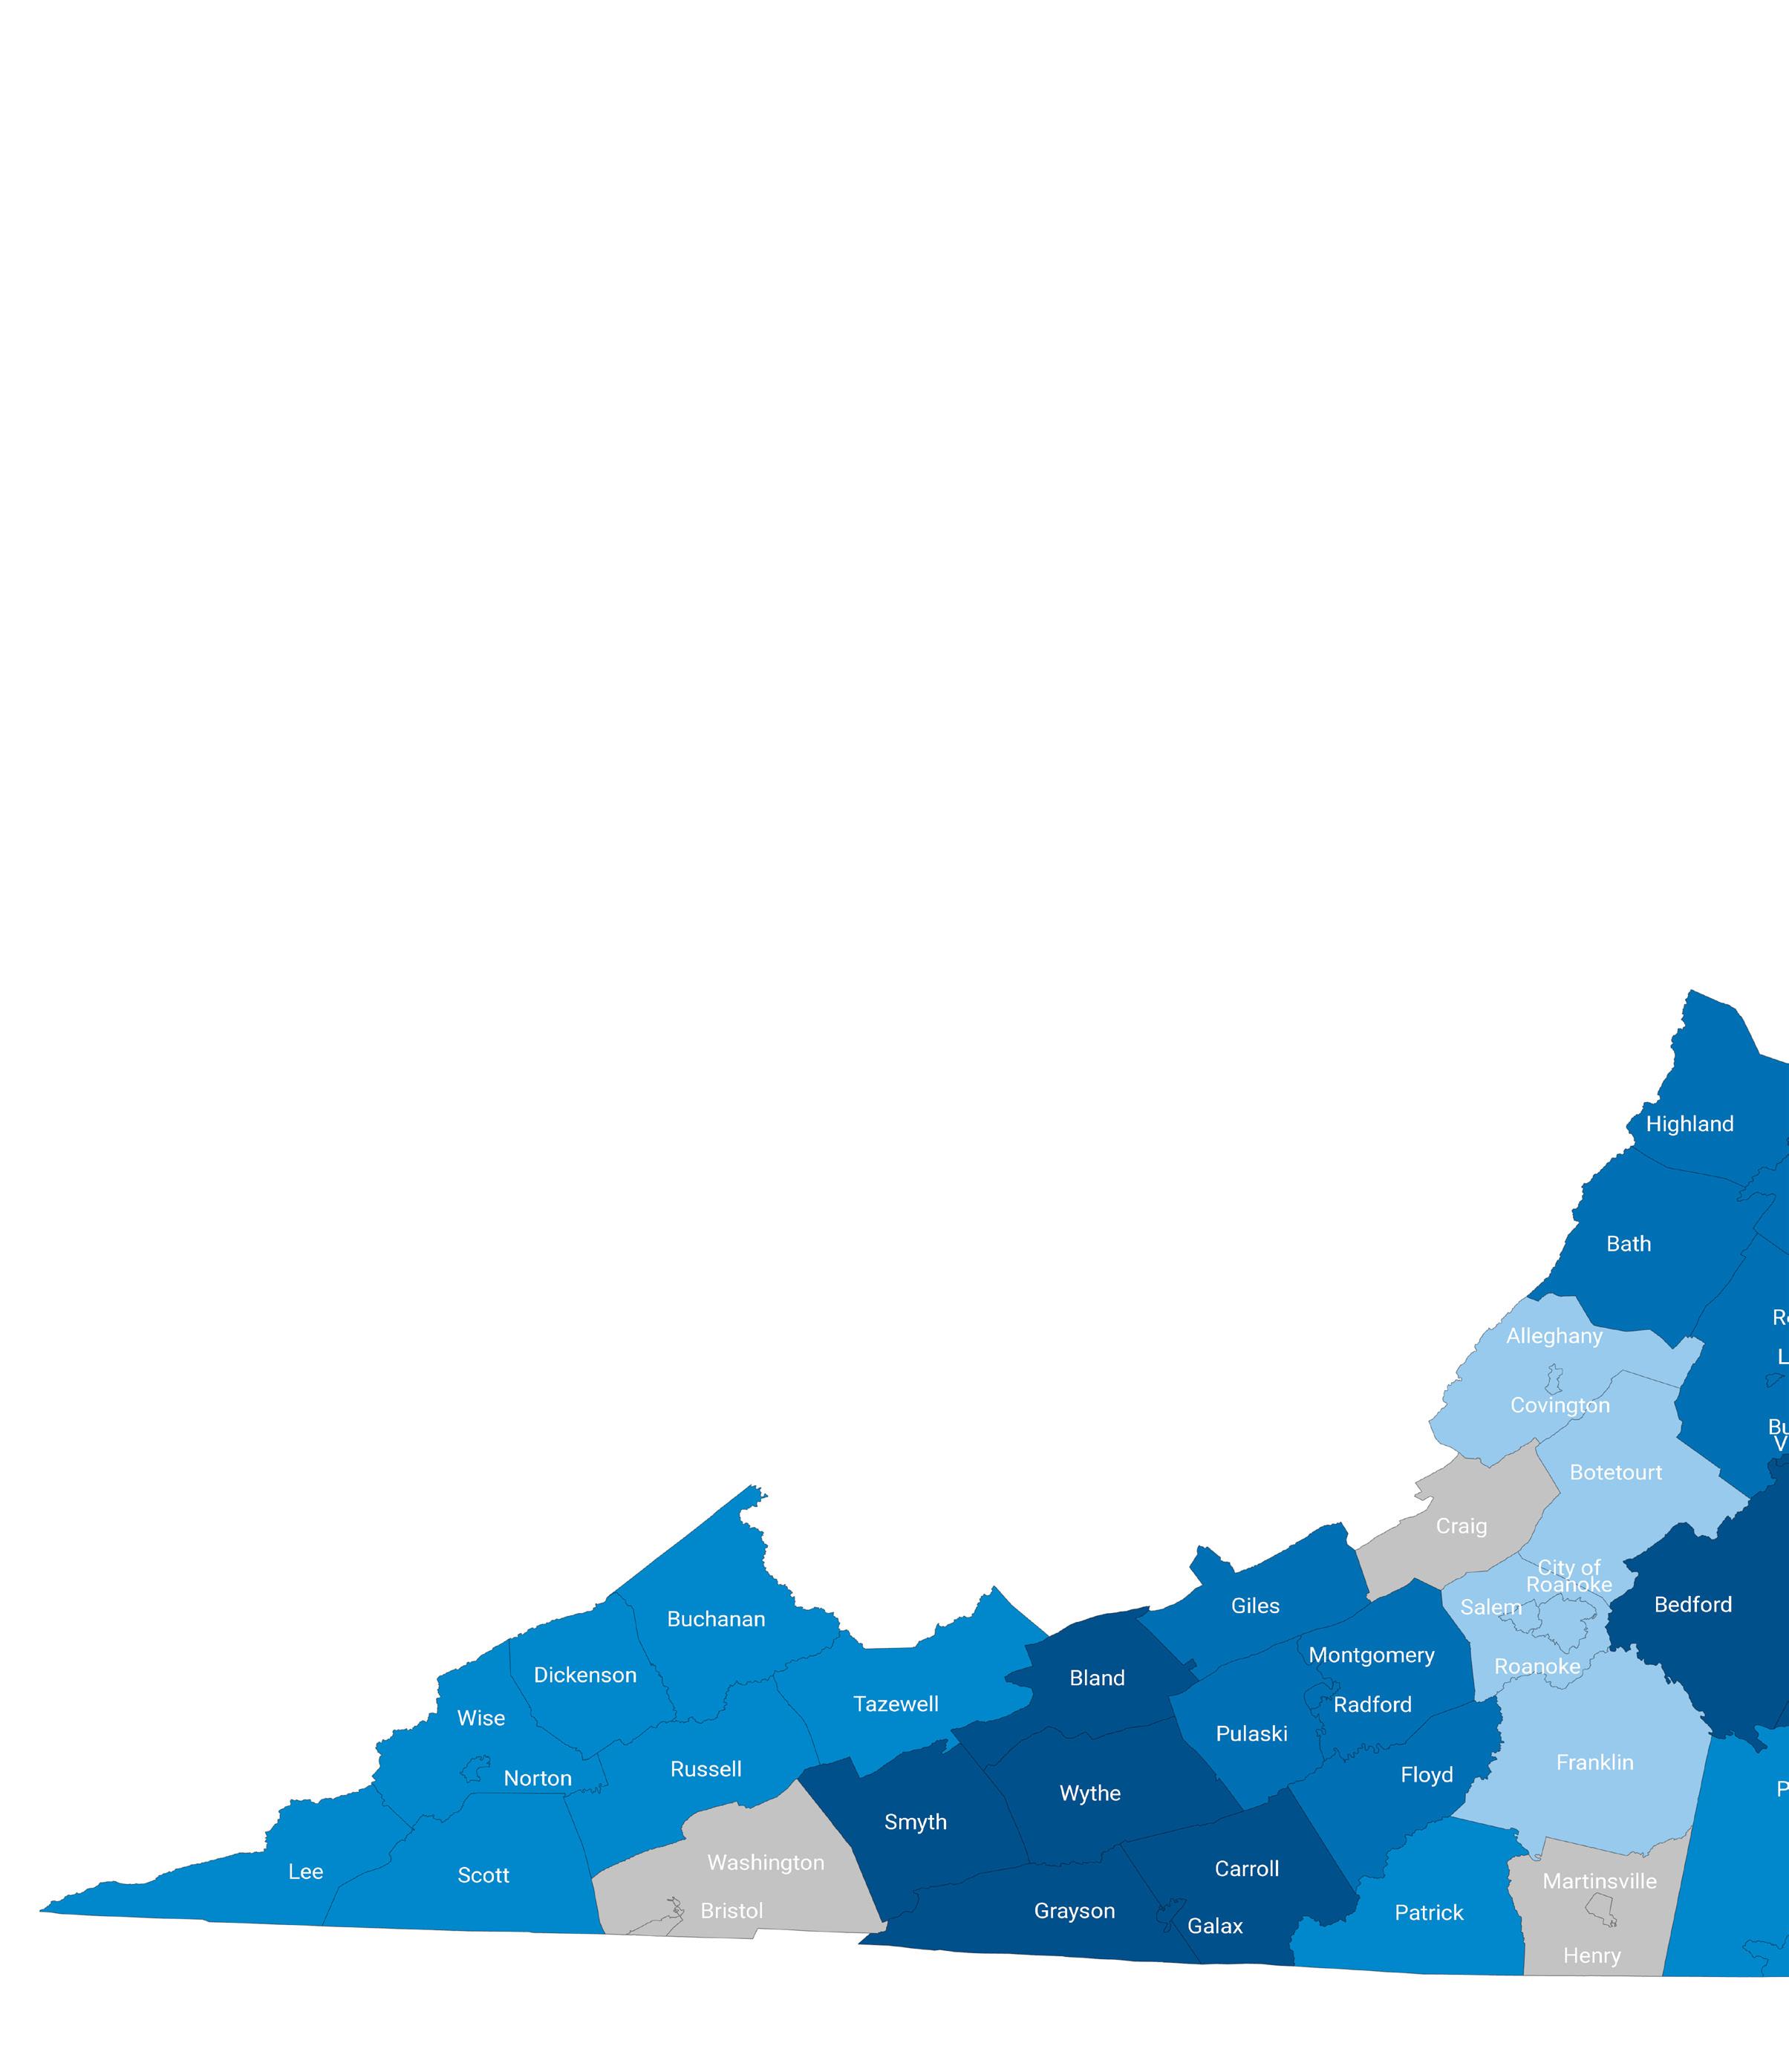
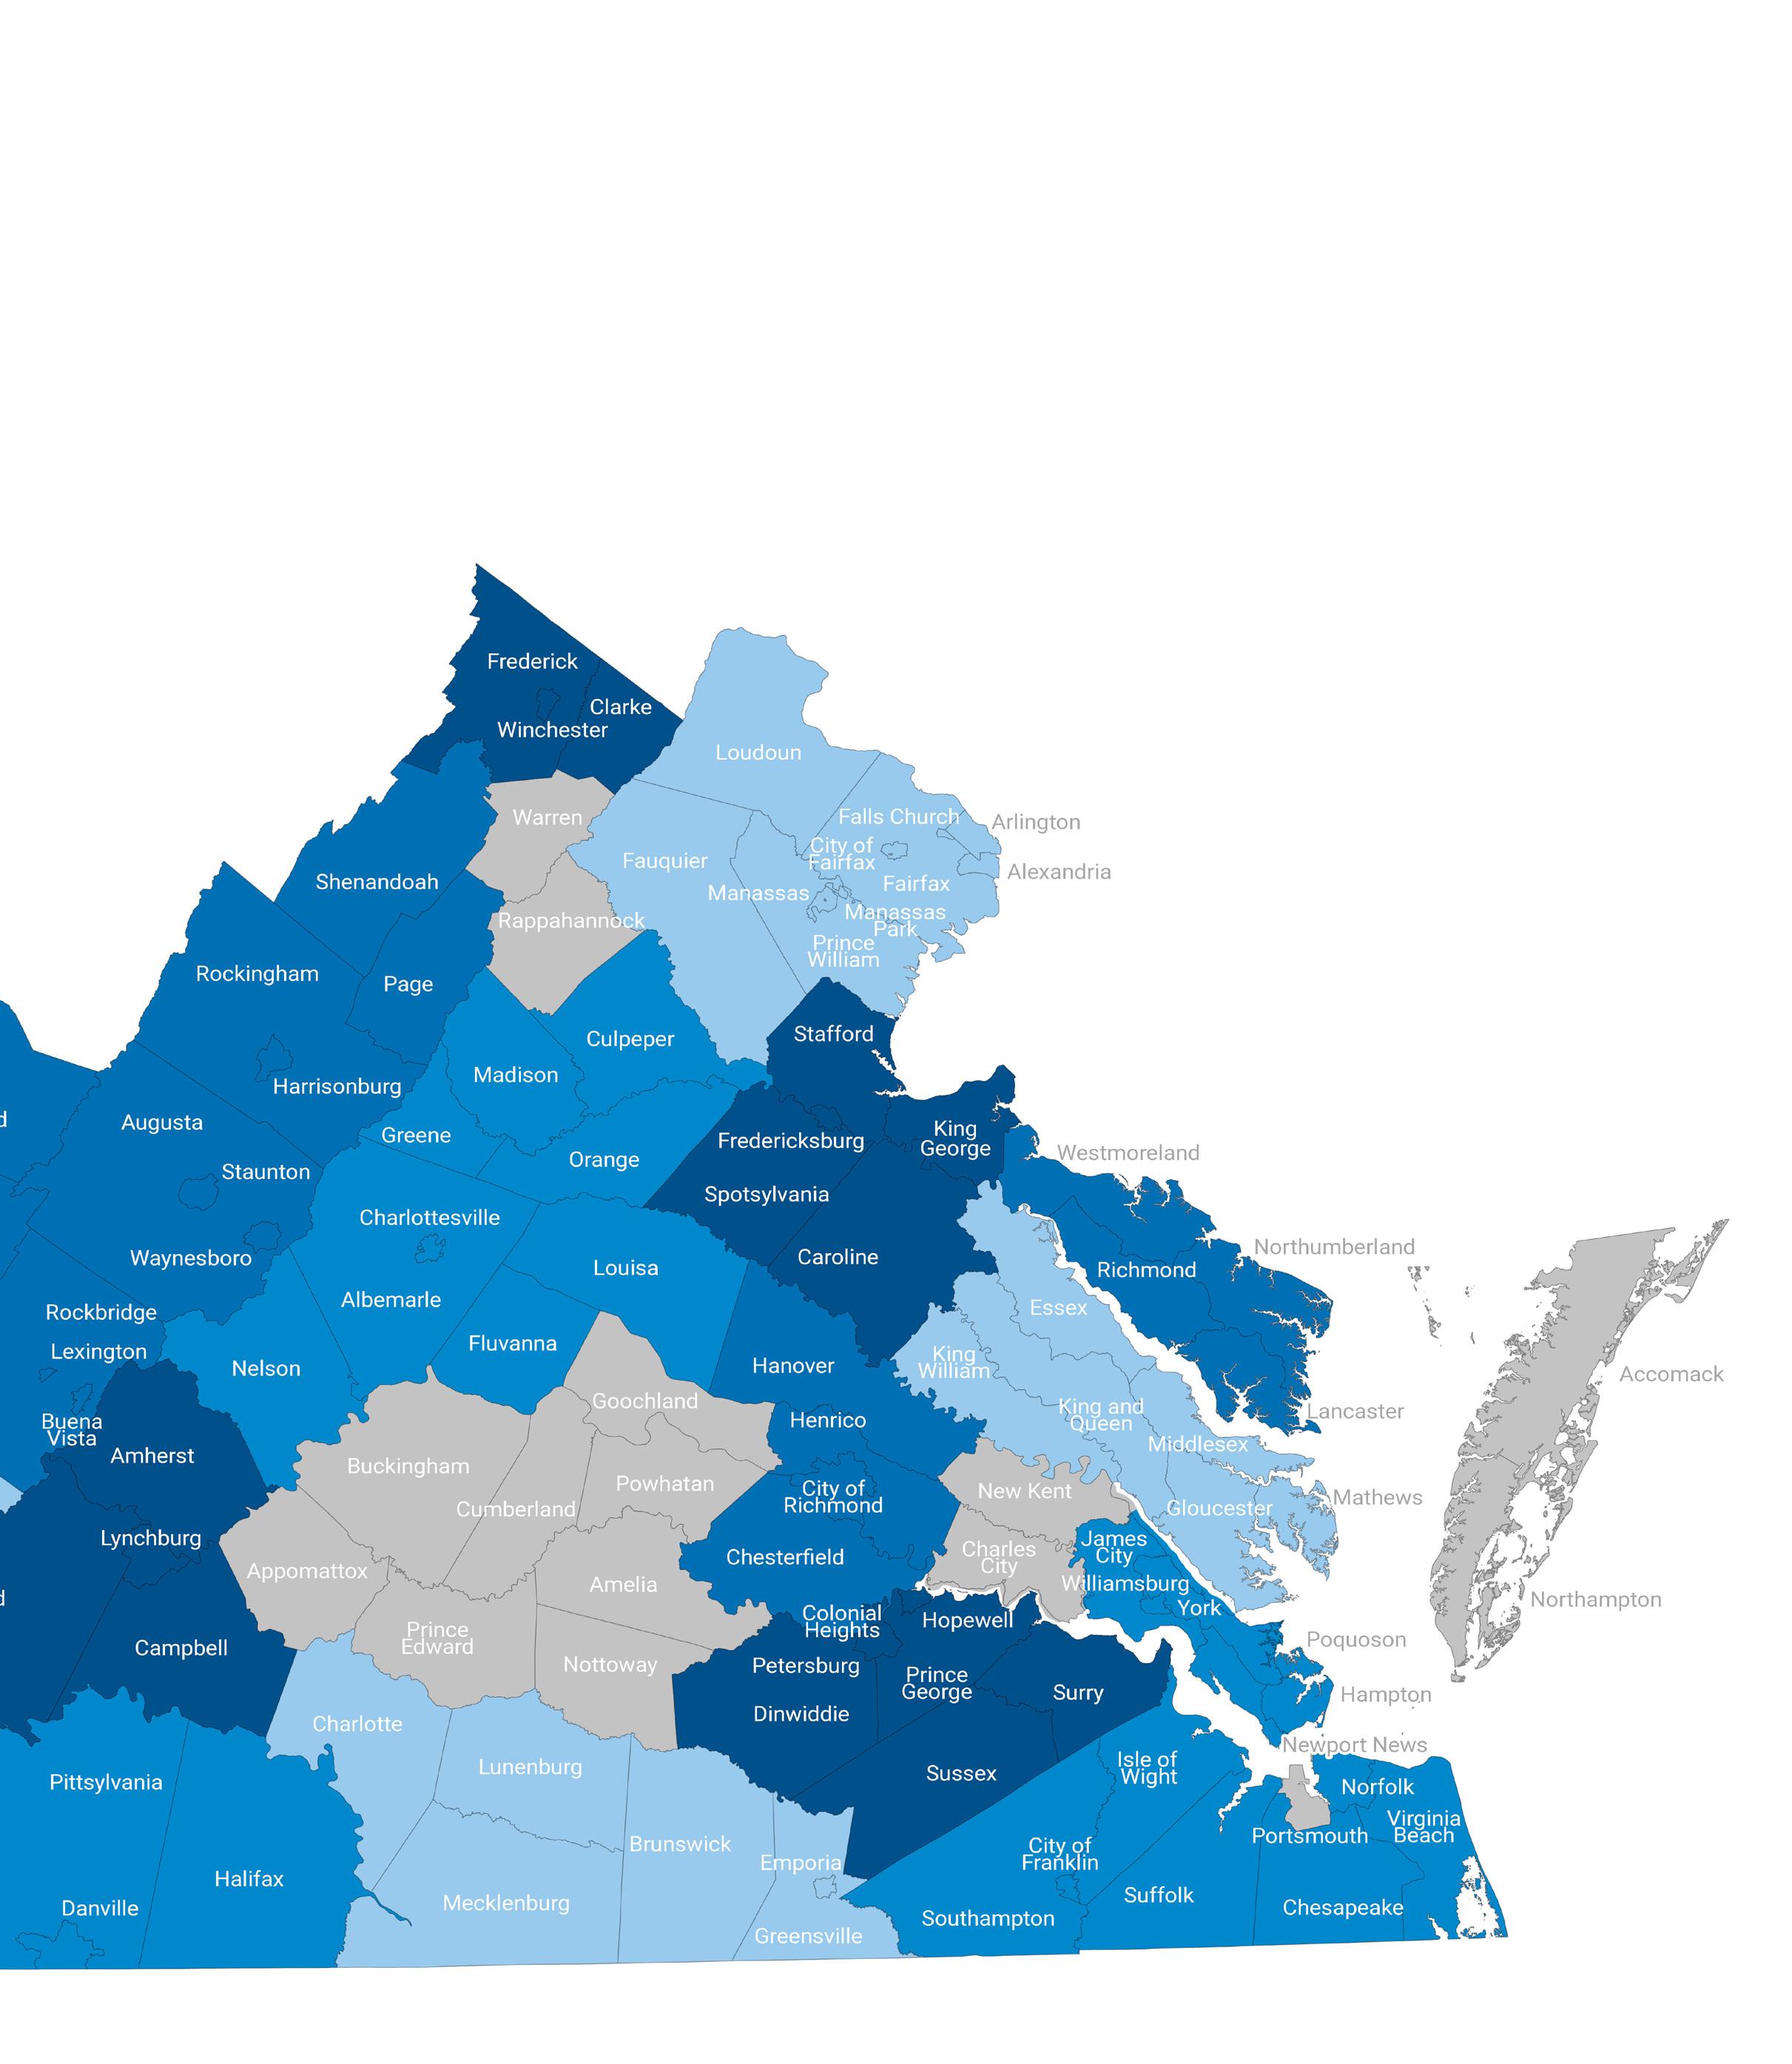
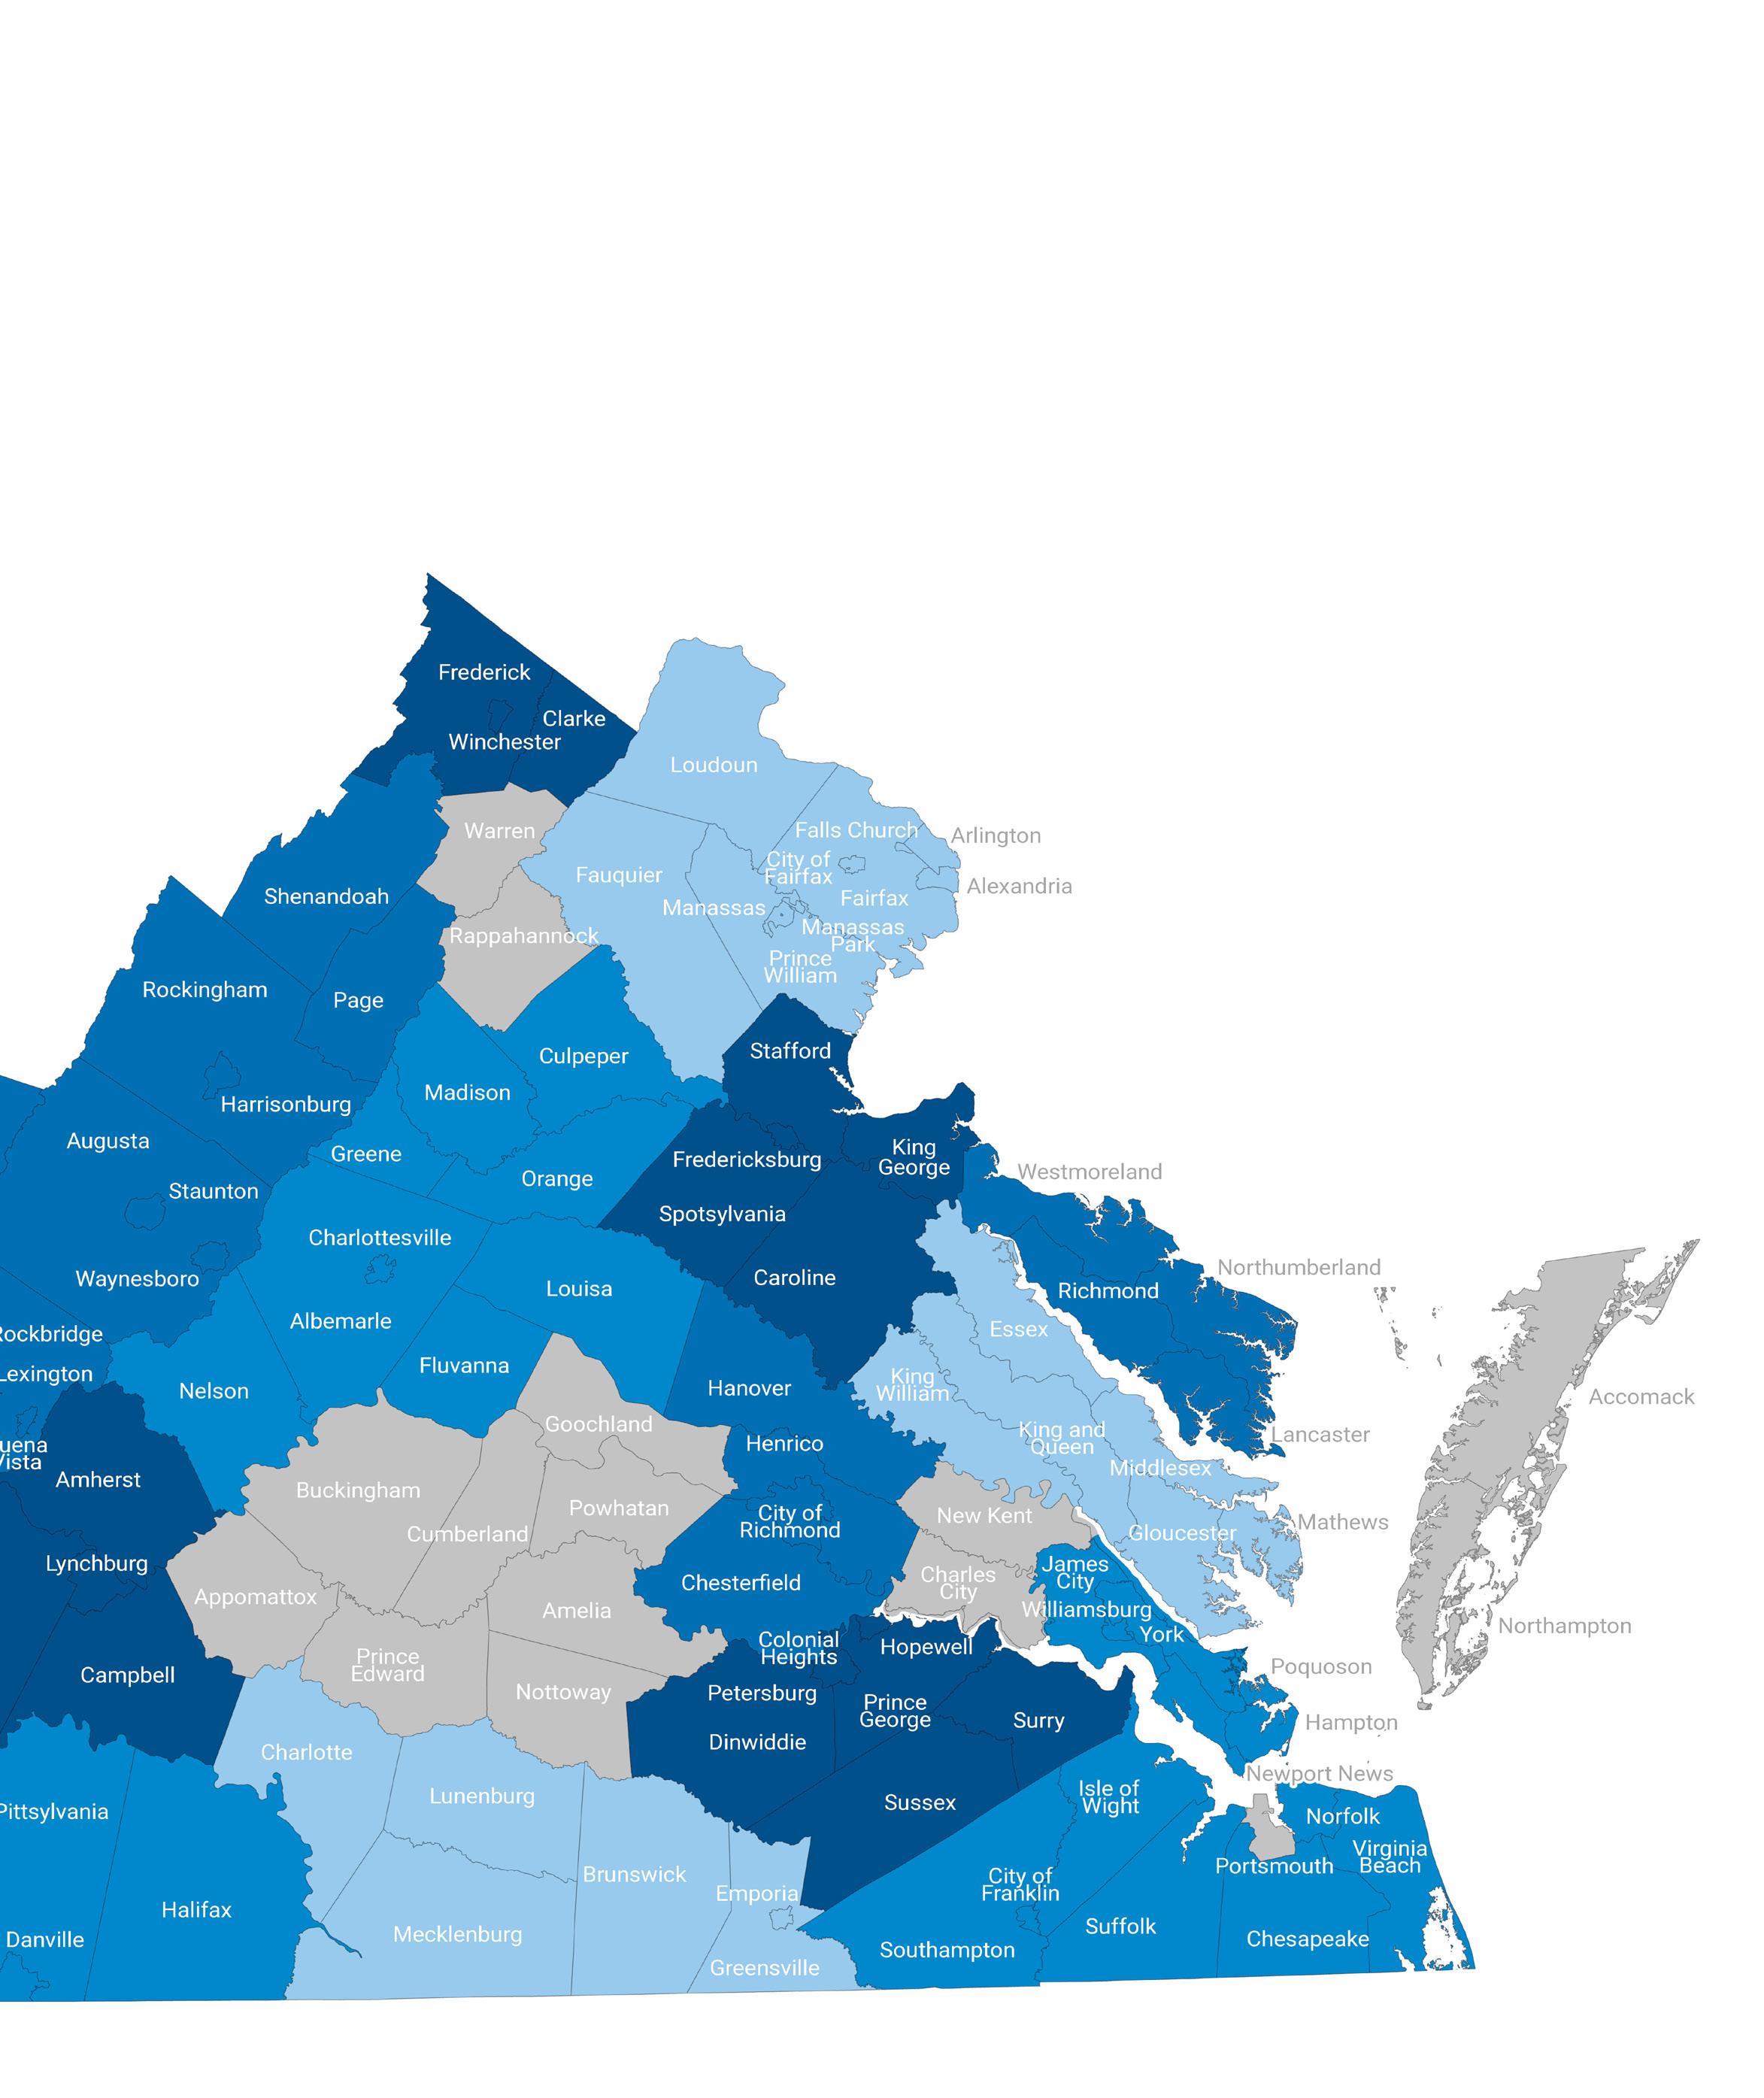
Rural regions and smaller metro areas across the Commonwealth – and the nation as a whole – face substantial economic headwinds. From underinvestment in sites and infrastructure to aging populations and limited economic development capacity, these unique challenges have translated into countless missed opportunities for new jobs and investment that have compounded over decades. Such rural localities represent the bulk of Virginia’s geography, as well as 17% of Virginia’s total employment and 24% of the population. The Commonwealth has made a commitment that these areas cannot be left behind, and that every region should participate in the growth of the Commonwealth.
The past year has seen the disruption and pain of the COVID-19 pandemic increasingly give way to healing and new opportunity. While Virginia’s rural regions were initially forecasted to significantly lag their urban peers in the recovery, rural economies proved highly resilient and recovered lost jobs at a faster pace. The permanent expansion of hybrid and remote work freed many Virginians to leave expensive urban areas for rural communities, allowing a number of rural areas to turn around long-standing demographic decline in 2021. Finally, the disruptions in international supply chains and a historic expansion of U.S. industrial policy led to a flurry of new opportunities in industries ranging from battery manufacturing to life sciences and semiconductors.
VEDP worked strategically over the course of FY22 to leave no opportunity on the table for rural Virginia. This resulted in a number of significant wins for rural Virginia, such as Blue Star in Wythe County and Scholle IPN in Smyth County. Looking into the next fiscal year, VEDP’s pipeline continues to remain strong; notably, over half of the projects in the pipeline continue to be manufacturing projects that are critical for delivering new jobs and investment to rural communities and small metros.
In this context, VEDP also continues to collaborate with rural development leaders and stakeholders to identify, prioritize, and advance consensus initiatives to increase competitiveness and spark economic opportunities.
Thanks to support from the Governor’s Administration, General Assembly, regional and local economic developers, and other partners, VEDP saw significant progress on those initiatives for FY22:
■ VEDP worked with the Administration and General Assembly to secure $159 million over the biennium for the Virginia Business Ready Sites Program (VBRSP). Many sites that could utilize this funding are located in distressed or doubly distressed communities in smaller metros and rural regions.
■ With the help of the Virginia Talent Accelerator Program, Virginia was able to secure large project wins in rural Virginia, including Blue Star in Wythe County, Scholle IPN in Smyth, Rocket Lab in Accomack, and Tyson in Danville/Pittsylvania, to name a few.
■ Effectively conveying the many assets and qualities of rural regions to prospects is extremely important to position these communities to secure new jobs and capital investment. As Virginia’s marketing efforts grow, VEDP will work on branding rural regions of the Commonwealth as the most attractive rural locations across the country for key industries such as manufacturing and business process outsourcing.
■ Rebuilding civic leadership with the next generation in rural Virginia is key to developing a successful economic strategy from the ground up. The Center for Rural Virginia launched its inaugural cohort of the Virginia Rural Leadership Institute and held its first session in Danville in May, where VEDP presented on developing the assets and workforce to create strong rural communities ripe for economic success.
Substantial progress has been achieved even as Virginia’s rural regions were rocked by the public health and economic impacts of the pandemic. However, more work remains to fully implement these initiatives, and other initiatives are still to come. In particular, VEDP is committed to investing in building a portfolio of projectready sites, sustaining a pipeline of talent to meet the needs of current and future industries, and improving Virginia’s overall business climate to enable all regions of the Commonwealth to participate in Virginia’s economic growth.

The
Colonial Center for the Performing Arts, South Hill
The Virginia Skills Initiative Will Help Virginia Identify Talent


In today’s fast-paced labor market, skills and competencies are becoming an even more essential and rapidly evolving currency for both workers and employers. Focusing on skills will help to answer some important questions for talent development in Virginia. What skills do students and workers in the Commonwealth have? What skills are needed today and in the future, and how do we train for them?
Skills information can also promote more inclusive hiring, targeted workforce development opportunities, and information for students and workers to make choices about their own life-long learning. Until now, Virginia has had very little data about the skills workers and students possess beyond basic information on their degrees and credentials.
In FY22, the Virginia Office of Education Economics (VOEE) began work on the Virginia Skills Initiative, building the foundation for a two-year project that will result in the development of two new unique skills-focused data sets for the Commonwealth. Together, these data sets will provide Virginia with a wealth of information on the skills workers and students possess. This data will inform decision-making processes for a variety of stakeholders, including policy makers, students and job seekers, employers, higher education institutions, and others.
The first data set will look at the pathways Virginia graduates take. The Alumni Career Data Set will collect self-disclosed social profile data of graduates from Virginia higher education institutions. This data set will fill existing gaps in our knowledge about how Virginia graduates use their degrees, how they share information on the skills they have acquired, and where they are working.
The second data set is the Virginia Educational Program Skills Data Set. This data set will scan a strategic selection of programs from Virginia educational institutions for learning outcomes and skills information. This data set will also translate course learning outcomes into skills, providing a better understanding of the many skills Virginia students acquire in higher education related to demand in the labor market.
The project is funded through the Workforce Innovation Opportunity Act via the U.S. Department of Labor.
36
Virginia Tech
Danville Community College


37
James Madison University
Central Virginia Community College

Jeffrey Duah graduated from the College of Engineering at Virginia Commonwealth University (VCU) in 2022 and now works at CGI Federal Inc. as a programmer analyst. His projects as a student, particularly in the Isosceles Lab at VCU, prepared him for a career focused on improving healthcare information technology for diverse populations.
Computer Science is one field that can greatly change how humanity lives. From the internet, to mobile phones, as well as machine learning and AI, Computer Science is helping to make life less stressful and taxing. Focusing on improving people's quality of life should be a goal in this field.
JEFFREY DUAH Computer Science Graduate, Virginia Commonwealth University

Supporting Our Local and Regional Partners
Over the past year, VEDP supported partner efforts to capture an unprecedented amount of economic development-focused grant dollars that became available as part of the federal government’s COVID-19 recovery efforts. The American Rescue Plan, the primary driver of new funding, provided the Economic Development Administration (EDA) with over $3 billion in resources across several grant programs, including the Build Back Better Regional Challenge (BBBRC), the Good Jobs Challenge, and the Economic Adjustment Assistance program. This significant investment represented a once-in-a-generation opportunity to transform our local and regional economic assets in Virginia.

To ensure that Virginia’s localities and regions were able to put the best applications forward, VEDP leveraged the Virginia Office of Education Economics (VOEE) along with the Talent Solutions, Economic Competitiveness, and Research divisions to assist over 20 applications with strategic thought partnership, data analysis, and letters of support. In addition, VEDP provided partners with matching funds to seek specialized analysis and content development for their BBBRC applications.

More than 500 organizations across the nation applied for the BBBRC grant opportunity. Virginia was one of a small number of states that had two organizations among the 50 finalists in contention for the BBBRC’s top funding prize. The Automated-Connected-Electrified (ACE) Transportation Cluster Coalition, led by Virginia Tech, developed a proposal for a transportation manufacturing cluster in Southern and Southwest Virginia. The Alliance for Building Better Medicine, led by Activation Capital, pursued an advanced pharmaceutical manufacturing cluster in the Greater Richmond-Petersburg region. After months of collaboration to support both applicants, the Alliance for Building Better Medicine won a $52.9 million grant to execute their cluster development plan. This grant will provide a transformational opportunity for the region, and VEDP has pledged coalition support to ensure the cluster’s success. VEDP also will continue to work with other partners across the Commonwealth to pursue other funding opportunities and continue the momentum established during this process.
VEDP received strong positive feedback from partners regarding support to advance these opportunities, and there is widespread interest in maintaining this kind of collaboration around other regional and local initiatives. Based on this feedback, VEDP is tracking opportunities within the federal Infrastructure Investment and Jobs Act (IIJA), the Inflation Reduction Act, and the CHIPS Act. VEDP is keeping partners up to date on new grant opportunities as they arise and is working with them to identify strategic investments that would enhance local and regional economic development assets.
40


 Downtown Wakefield
Downtown Culpeper
Alexandria Waterfront
Downtown Wakefield
Downtown Culpeper
Alexandria Waterfront
Only the Best is Good Enough: Virginia Lands The LEGO Group
The name LEGO is an abbreviation of the Danish phrase leg godt, meaning “play well,” which is exactly what the LEGO Group has helped children and families around the world do since its founding in 1932 in Billund, Denmark. The privately held company is one of the world’s largest toy manufacturers and a beloved global enterprise that spans theme parks, video games, board games, films, clothing, and more.
To address growth demands in North America, the LEGO Group conducted a competitive, multistate site location search to establish a new, environmentally sustainable manufacturing factory. The company will invest more than $1 billion to build a new 1.7 million-square-foot precision manufacturing facility and create 1,760 new jobs.
"Only the Best is Good Enough" is a LEGO Group motto used since the 1930s. The successful state had to deliver a comprehensive, best-in-class solution to meet the company’s proven standards of excellence and provide strong synergies with its corporate values. VEDP worked with the General Assembly’s Major Employment Investment Commission, Chesterfield County, and the Greater Richmond Partnership to do just that. The Virginia solution centered on an attractive pad-ready site, a commitment to renewable energy, comprehensive workforce solutions, and a competitive community and state incentive package.
The Meadowville Technology Park in Chesterfield County offered a ready-to-go site located within a thriving metro area where people live, work, and play well. Its robust utility infrastructure could support current and future demands with renewable solutions. The site also had ample acreage to develop an on-site solar farm. Chesterfield County provided a temporary building to accommodate packing and training operations while the new facility is under construction.
The LEGO Group will be eligible to receive an MEI custom performance grant of $56 million as well as site development improvements estimated at up to $19 million, subject to approval by the Virginia General Assembly.
As soon as the LEGO Group committed to Virginia, the Virginia Talent Accelerator Program started working with the company to develop innovative recruiting tools designed to leverage publicity from the upcoming Governor’s announcement to capture talent. This featured a recruitment website fully customized to the LEGO Group’s Virginia jobs. It went live with the Governor’s announcement and, within one minute, the first job candidate registered. Within four hours of the announcement, over 500 people had registered. Within 36 hours, the talent pool had grown to over 3,000. It is now over 7,500. And that’s just the beginning of the highly customized talent recruitment and training services the Virginia Talent Accelerator Program will provide to support the company. The services are being delivered in partnership with the Community College Workforce Alliance and Brightpoint Community College, who will focus on supporting the LEGO Group’s long-term needs.
The LEGO Group’s decision to locate in Virginia is a testament to the Commonwealth’s position as a top state for business, and Virginia’s ability to deliver custom solutions that meet the complex site location requirements of today’s companies.
KEY PARTNERS:
•
• Dominion Energy
• Chesterfield County
• Greater Richmond Partnership
•
• The Port of Virginia
•
42 CASE STUDY
Administration of Governor Glenn Youngkin
Brightpoint Community College
Community College Workforce Alliance
Virginia General Assembly and MEI Commission
We were impressed with all that Virginia has to offer, from access to a skilled workforce, support for highquality manufacturers, and great transport links. We appreciate support for our ambition to build a carbonneutral run facility and construct a solar park and are looking forward to building a great team with support from the Virginia Talent Accelerator Program.
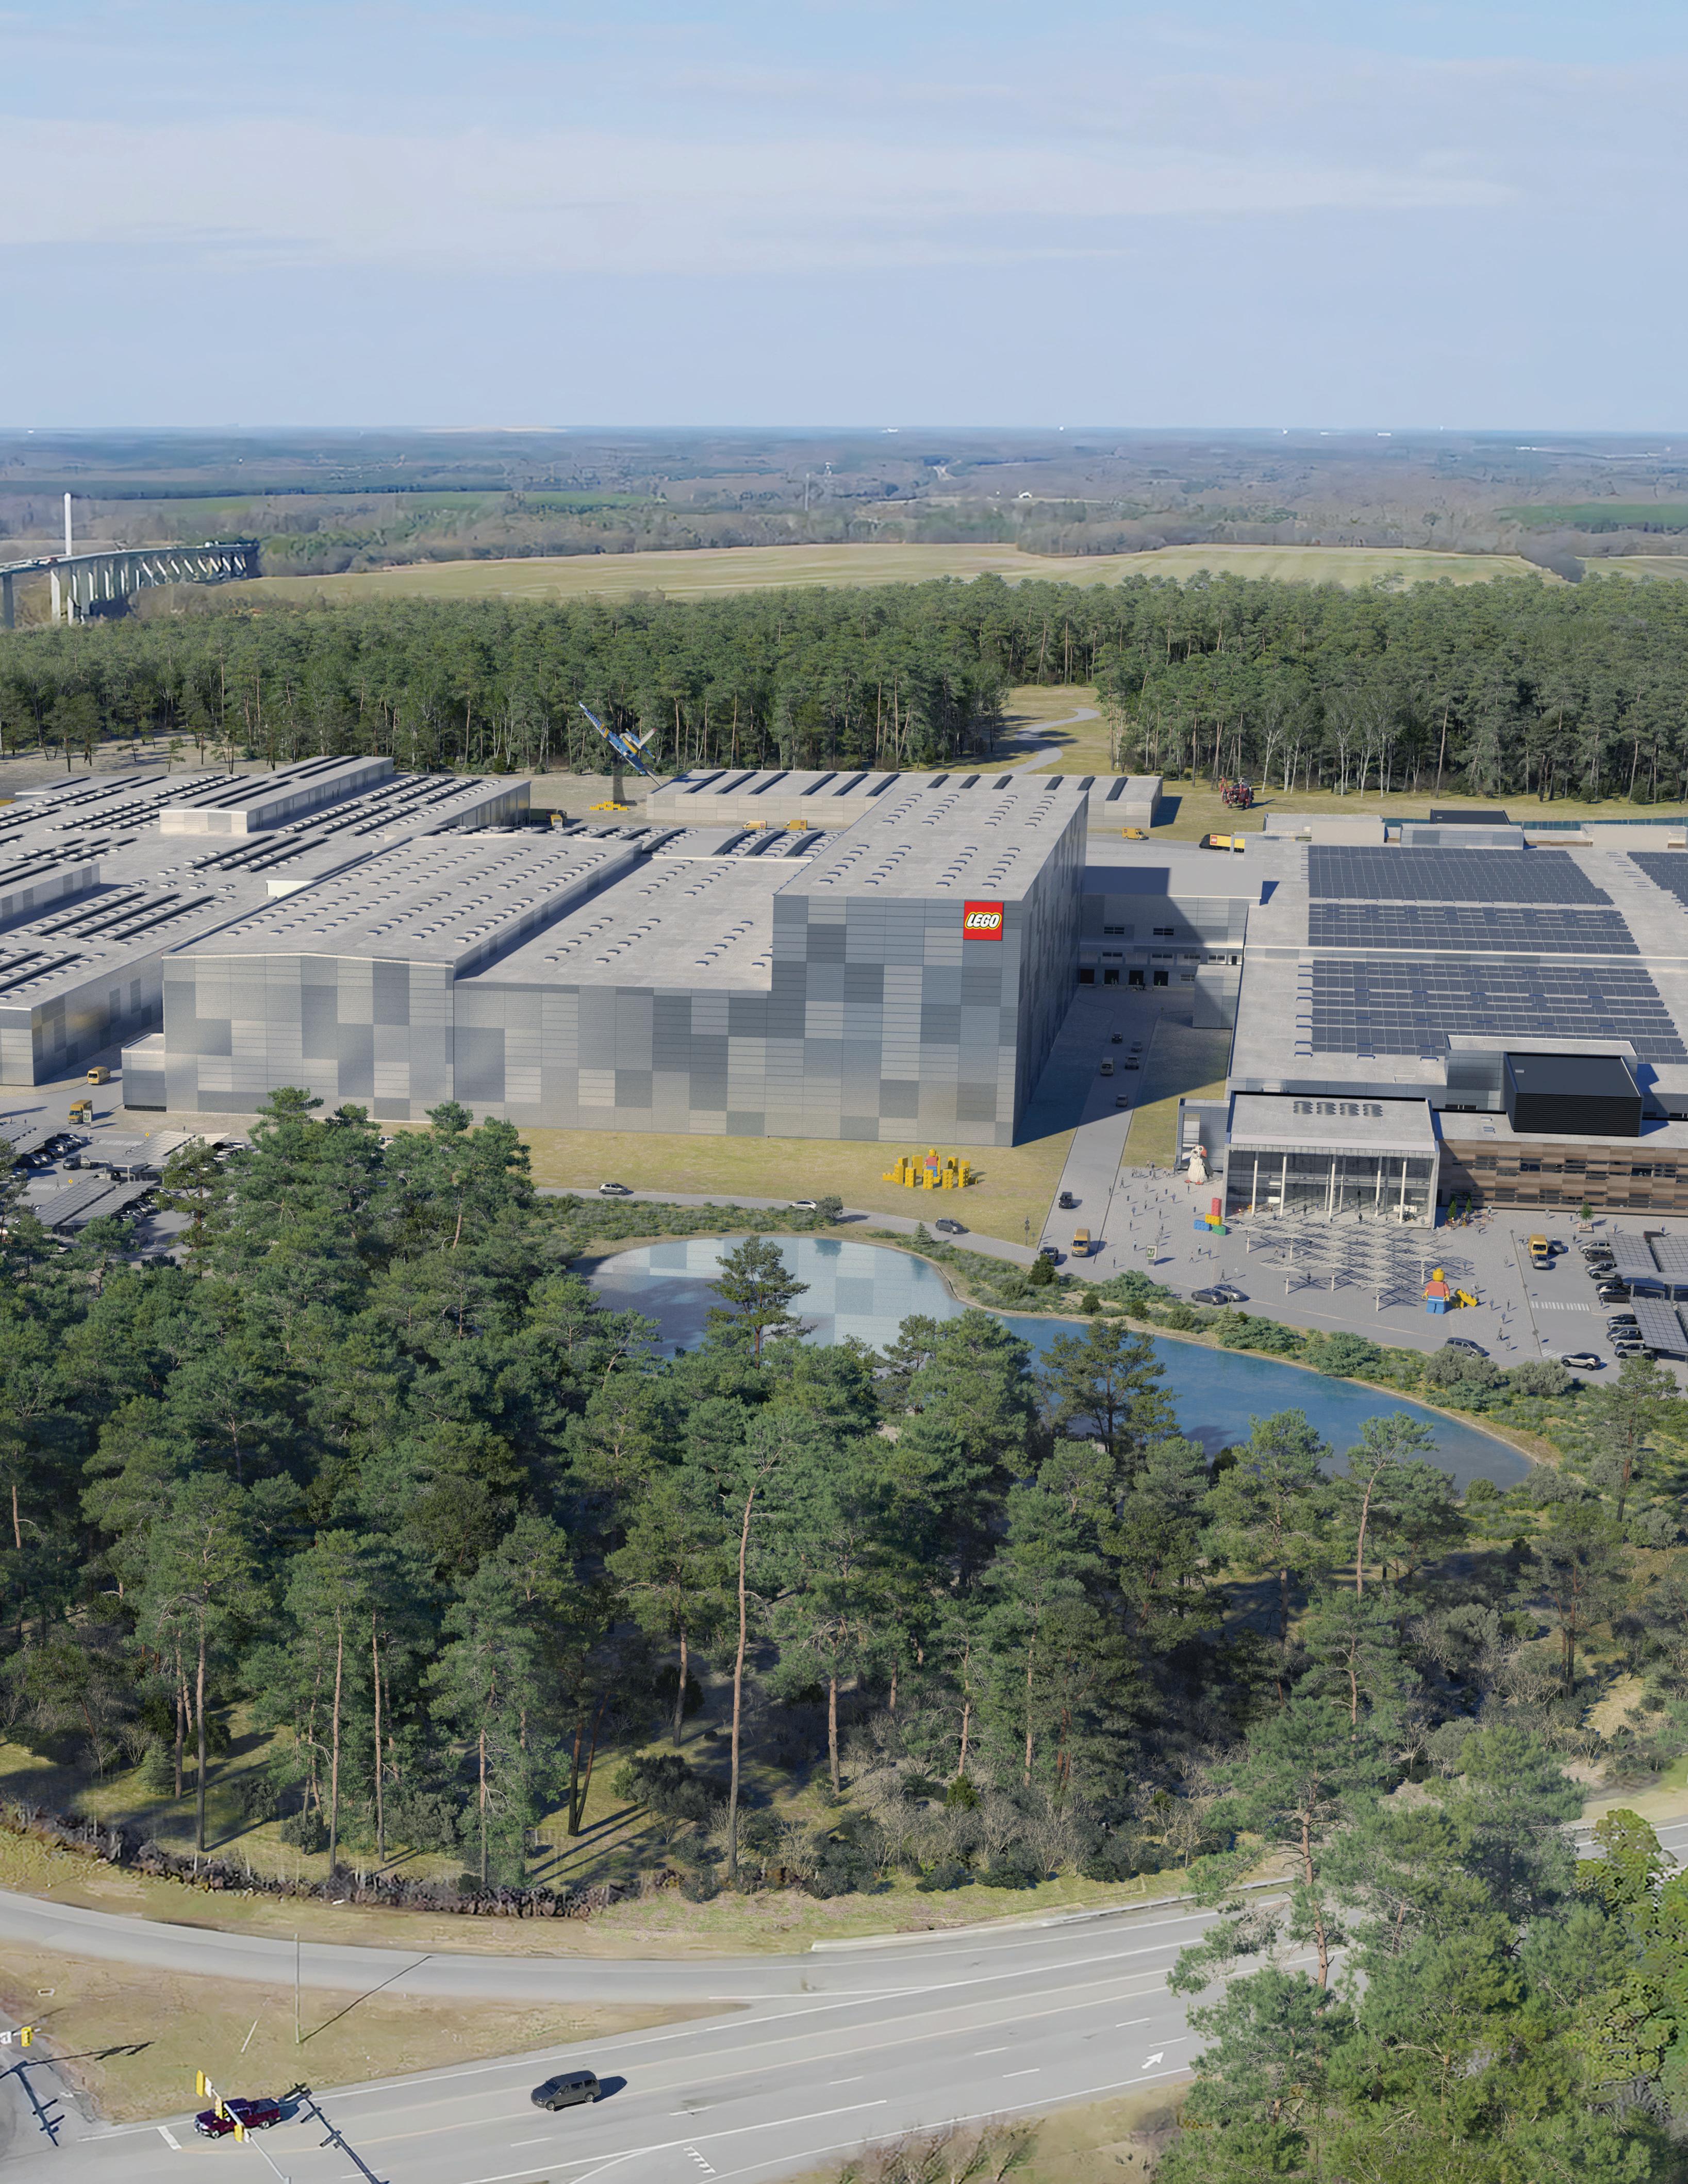 The LEGO Group rendering, Chesterfield County
NIELS B. CHRISTIANSEN CEO, The LEGO Group
The LEGO Group rendering, Chesterfield County
NIELS B. CHRISTIANSEN CEO, The LEGO Group
Neutron is a new generation of rocket that will advance the way space is accessed. As one of only four states in the U.S. with an FAA spaceport license for missions to Earth orbit or on interplanetary trajectories, Virginia is home to an active and experienced aerospace workforce that we can pull from to support Neutron’s development and launch. The Commonwealth’s enthusiasm and backing of Neutron made it difficult to see anywhere else but Virginia as Neutron’s future home.
PETER BECK Founder and CEO, Rocket Lab

Rocket Lab rendering, Accomack County
CASE STUDY
Rocket Lab Manufacturing and Launching in Virginia
Founded in 2006, Rocket Lab is an end-to-end space company delivering reliable launch services, spacecraft, satellite components, and on-orbit management. The company has three launch pads across two countries. Their Electron rocket is the second most frequently launched U.S. rocket since 2019. Today, over 1,700 satellites in orbit feature Rocket Lab technology. Rocket Lab conducted a strategic site selection process that identified Virginia as the prime location for manufacturing and launching their newest launch vehicle in development, Neutron. The company will invest $103 million to build a more than 200,000-square-foot manufacturing facility and create 246 new jobs on Virginia’s Eastern Shore.
Virginia’s Mid-Atlantic Regional Spaceport (MARS) located on Wallops Island is the home of Rocket Lab’s Launch Complex 2. This facility will be used to launch the company’s first Electron rocket mission from U.S. soil this year, with additional launches to follow. The company will also utilize the MARS facility to launch its Neutron rocket, a mega constellation launcher that will be capable of deep space missions and human space flight. Neutron’s inaugural launch is targeted for 2024. The rocket will be American made and is designed as a reusable rocket that will be both manufactured and refurbished at the facility in Accomack, Virginia.
Rocket Lab selected Virginia as the location of its Neutron expansion due to extensive support from the Commonwealth of Virginia. The Virginia solution for this project location included a $30 million state appropriation to Virginia Space to strengthen the infrastructure and operational systems at the Mid-Atlantic Regional Spaceport, which offers full-service multipurpose launch services for small- and mid-class rockets, along with payload processing and integration and control. The MEI Project Approval Commission approved an additional investment of up to $15 million to support site improvements and construction of a building to be owned by Virginia Space and leased to Rocket Lab as a manufacturing and operations facility. Virginia Space acquired land adjacent to the gates of the Wallops Flight Facility for this purpose, allowing Rocket Lab convenient access from the manufacturing facility to the launch pad.
The unique advantages of the Wallops Flight Facility and MARS positioned this site to be the preferred manufacturing location for Rocket Lab. The Commonwealth of Virginia is strategically investing in infrastructure to ensure this facility will be a successful home to Rocket Lab’s manufacturing and launch operations for Neutron, as well as other space companies.

KEY PARTNERS:
Accomack County
• Administration of former Governor Ralph Northam
•
Administration of Governor Glenn Youngkin
• Virginia Space
• NASA
• Virginia General Assembly and MEI Commission
45
CoStar Group Doubles Down on Virginia
CoStar Group is the world’s leading provider of commercial real estate information, analytics, and online marketplaces, producing and maintaining the largest and most comprehensive database of real estate information. Headquartered in Washington, D.C., CoStar maintains offices throughout the U.S. and in Europe, Canada, and Asia with a staff of approximately 4,800 worldwide.
In October 2016, CoStar relocated its research function from Washington, D.C., to Richmond, establishing its new research and software development headquarters and creating 732 new jobs. In just over five years in Virginia’s capital city, CoStar became one of the largest employers in Richmond with more than 1,000 team members. CoStar selected Virginia as the home for its new research hub over competitors because the Commonwealth’s business-friendly environment enabled the company to recruit a diverse and inclusive workforce.
CoStar has been an important corporate partner in the Richmond region from the beginning. The company funds the CoStar Group Endowed Chair in Real Estate Analytics at Virginia Commonwealth University, participates in local philanthropic activities through CoStar Group Builds, and promotes environmental sustainability through LEED-certified buildings.
When it came time to select the location for the company’s new Innovation Campus, CoStar looked to Richmond again. After a comprehensive site selection process, CoStar chose to invest $460 million to build a two-building complex, which coupled with its existing building in downtown Richmond will create a corporate campus and welcome an additional 2,000 new jobs. The company will construct a 26-story, LEED-certified office tower with 750,000 square feet of space. In addition, CoStar will build a six-story, mass-timber, multipurpose building to house conference and training space, fitness and wellness amenities, an auditorium, 50,000 square feet of green roof terraces, retail space, and restaurants and dining options for employees of CoStar and other downtown businesses, as well as those who attend many of the outdoor events and festivals at Brown’s Island across the street from the campus.
The Innovation Campus will drive many of the latest research and development efforts for CoStar – focusing on new technology such as drone imagery, 3D visualization, digital imagery, forecasting, machine learning, econometrics, and photogrammetry. CoStar’s partnerships with Virginia higher education institutions will be essential for the company as it continues to lead the digital transformation of the real estate industry.
VEDP worked with the General Assembly’s Major Employment and Investment (MEI) Commission, the City of Richmond, and the Greater Richmond Partnership to secure the project for the Commonwealth. In addition to local incentives, CoStar will leverage up to $15 million in public infrastructure upgrades funded by the Commonwealth to address commuter and pedestrian access, roadway and traffic improvements, safety, and off-site utility extensions around the new campus. The ability to create an inclusive, welcoming hub not just for CoStar, but also for the community, was a key tenet in CoStar’s growth plan. Richmond’s location, connectivity, and talent pipeline provided a unique solution for the company’s future. CoStar’s decision to expand its presence in Virginia is a testament to the Commonwealth’s leadership in innovation and exceptional business climate.
KEY PARTNERS:
• Greater Richmond Partnership
•
• Virginia Commonwealth University
•
46 CASE STUDY
Administration of former Governor Ralph Northam
Administration of Governor Glenn Youngkin • City of Richmond
Virginia General Assembly and MEI Commission
Richmond is a growing community with access to a deep pool of diverse, highly skilled workers, a vibrant culture of innovation, and a wonderful quality of life for our existing and future employees. The strong partnerships we have established with the Commonwealth of Virginia, the City of Richmond, and institutions of higher education such as VCU will be critical for our continued growth. Virginia, Richmond, and CoStar Group all have bright futures ahead, and we are excited to grow together.

CoStar Group rendering, Richmond
ANDY FLORANCE Founder and Chief Executive Officer, CoStar Group
Progress Reports
This section offers an update on progress made by the Virginia Economic Development Partnership Authority (VEDP) in FY22 relative to VEDP’s Strategic, Operational, and Marketing Plans. These plans were previously submitted in accordance with Code and other requirements. Because most elements of these plans are treated with confidentiality and are exempted from mandatory disclosure provisions (Code of Virginia §2.2-3705.7. 33.), this progress report references specific elements of the plans without revealing information that is protected by the Code for competitive purposes.
Strategic Plan
The Strategic Plan for Economic Development of the Commonwealth of Virginia adopted by the VEDP Board in FY21 is an updated five-year plan (FY21-FY25) for which implementation began in January 2021.
Key highlights of strategic plan implementation for FY22:
With the support of the Administration, the General Assembly, and hundreds of partners, much progress has been made implementing many of the initiatives detailed in the Strategic Plan. Following are just a few examples (not comprehensive):
■ With new state funding, VEDP awarded $7 million in Virginia Business Ready Sites Program (VBRSP) grants to 11 site development projects.
■ VEDP established the Real Estate Solutions Division for the purpose of analyzing, developing, and implementing real estate solutions for economic development projects across Virginia.
■ With additional state funding and support, the Virginia Talent Accelerator Program is advancing as a national leader in the delivery of world-class, customized recruitment and training solutions.
■ With additional state funding and support, VEDP expanded its export development programs, established capabilities to leverage additional federal grant dollars, and developed and launched a program to assist companies in managing their international supply chains.
■ With new state funding and support, VEDP established the Virginia Office of Education Economics (VOEE), which completed the first phase of its web platform development for sharing data and insights with partners and began developing a supply-demand model for Virginia’s workforce.
■ In conjunction with Team Virginia, VEDP hosted top site selection consultants at three Consultant Symposiums, and met with over 100 consultants one on one throughout the year to pitch Virginia and its assets.
■ To fully demonstrate Virginia’s value-add for companies during prospect pitches, VEDP completed its value proposition content across all target industries and began developing a process for maintaining information and updating content over time.
■ Leveraging federal grant funding from the Economic Development Administration, VEDP, regional partners, and consultants completed a strategic assessment for growing key industries as the economy emerges from the pandemic, and shared the content broadly with partners to support various efforts to cultivate emerging sectors.
■ Working in collaboration with state, regional, and local partners, VEDP supported over 30 federal grant applications, including Virginia’s two Build Back Better Regional Challenge finalists that competed among 50 other regions to secure up to $100 million each in funding for regional cluster development.
■ Working in collaboration with state, regional, and local partners, VEDP exceeded its FY22 business development goals, with VEDP-assisted projects resulting in 17,203 announced jobs and $34 billion in capital investment.
Despite the strong progress that has been made on several fronts, many initiatives detailed in the Strategic Plan have not yet been implemented. Accordingly, while substantial progress has been made with respect to all five of the following transformational goals, Virginia has not yet fully achieved them.
48
Five Transformational Goals
The Strategic Plan includes five transformational goals, the achievement of which would require implementation of dozens of new initiatives over a period of years (multiple biennium budgets). The five transformational goals are outlined below, as well as a progress indicator, rating the Commonwealth’s status in achieving each of these goals:
Transformational Goal Description Outlook
1. Robust state job growth Position Virginia to achieve a growth rate in employment and median earned income among that of the top 5–10 states in the U.S.
2. Every region wins Ensure that every region participates in the growth of the Commonwealth (i.e., all with positive growth in employment and median earned income).
3. Best states for business Restore Virginia to its previous position near the top of the national business climate rankings (i.e., average rank among the top 3–5 states).
4. Top state EDO Reestablish and sustain VEDP as one of America's most effective state economic development organizations.
5. Super collaborator Exhibit collaboration and coordination as hallmarks of VEDP (i.e., place a central focus on the "P" in VEDP).
On track to achieve long-term goal
Not on track to achieve goal
Substantial progress has occurred, but not yet on track to fully achieve goal
Not started, or strategy shift under consideration
Some of the initiatives in the Strategic Plan require new funding to implement and, therefore, achievement of the five transformational goals will depend on resourcing levels.
Progress Report: Strategic Plan Initiatives
Status update on 35 detailed initiatives
The Strategic Plan provides for 35 detailed initiatives for phased implementation over a period of years (multiple biennium budgets). Some of the initiatives have not been funded, slowing progress toward achieving the transformational goals outlined in the Strategic Plan. Enhance Virginia's Economic Competitiveness
SP1 Build out the best turnkey, customized workforce recruitment and training incentive program in the U.S.
SP2 Invest in Virginia's pipeline of computer science talent through $1.1 billion Tech Talent Investment Program
SP3 Develop mechanisms to ensure sufficient supply of high-impact baccalaureate+ degrees in critical fields
SP4 Develop sub-baccalaureate talent pathways and signaling mechanisms to drive inclusive economic growth
SP5 Upgrade Virginia's labor market data infrastructure to empower data-driven decision-making
SP6 Work toward creating a comprehensive ecosystem for talent development and deployment
SP7 Strategically enhance Virginia's portfolio of development-ready sites
SP8 Develop a program to enhance Virginia's portfolio of project-ready buildings
SP9 Build a best-in-class Economic Competitiveness team within VEDP
SP10 Pursue a national rankings initiative to develop strategies and plans for marked improvement
SP11 Proactively address key elements of local and regional economic competitiveness
SP12 Assess Virginia's state/local tax burdens and propose targeted solutions to improve tax competitiveness
SP13 Conduct a review of Virginia's incentive portfolio to identify targeted competitiveness improvements
SP14 Pursue a focused economic development strategy sufficient to position rural Virginia for growth
SP15 Marshal the Commonwealth's full support behind expanding broadband access
50
Enhance VEDP's Capabilities
SP16 Adhere to protocols for alignment and coordination
SP17 Implement a talent management and organizational development program for VEDP
SP18 Implement a robust marketing, branding, and site consultant cultivation program for Virginia
SP19 Upgrade VEDP's lead generation capabilities
SP20 Implement a strategic site consultant cultivation program
SP21 Expand VEDP's Business Retention and Expansion (BRE) Program
SP22 Implement Virginia’s International Trade Plan in collaboration with internal and external stakeholders
SP23 Strengthen VEDP's approach to project management to communicate Virginia's total value proposition
SP24 Launch a Project Development and Special Opportunities Fund
SP25 Develop best-in-class incentives reporting and administration functions
SP26 Position Virginia to secure transformational economic development projects
SP27 In partnership with the Virginia Chamber, launch Team
Cultivate Target Industry Clusters
SP28 Position Virginia to be one of America’s leading states for traded-sector tech growth
SP29 Collaborate with The Port of Virginia to enhance its economic development impact
SP30 Enhance the toolkits, strategies, and assets on hand to attract targeted firms
SP31 Implement the Rural and Small Metro Tech Centers Initiative
SP32 Support entrepreneurship and innovation ecosystem efforts
PC1 Explore opportunities to capture growth from teleworking trends
PC2 Explore opportunities to best position Virginia to thrive as supply chains adjust in the wake of COVID-19
PC3 Explore opportunities to best position Virginia to support workers' upgraded skills in response to COVID-19
51
Position
Virginia for Post-COVID Recovery
Virginia
Substantial progress has occurred, but not yet on track to fully achieve goal Not on track to achieve goal On track to achieve long-term goal Not started, or strategy shift under consideration
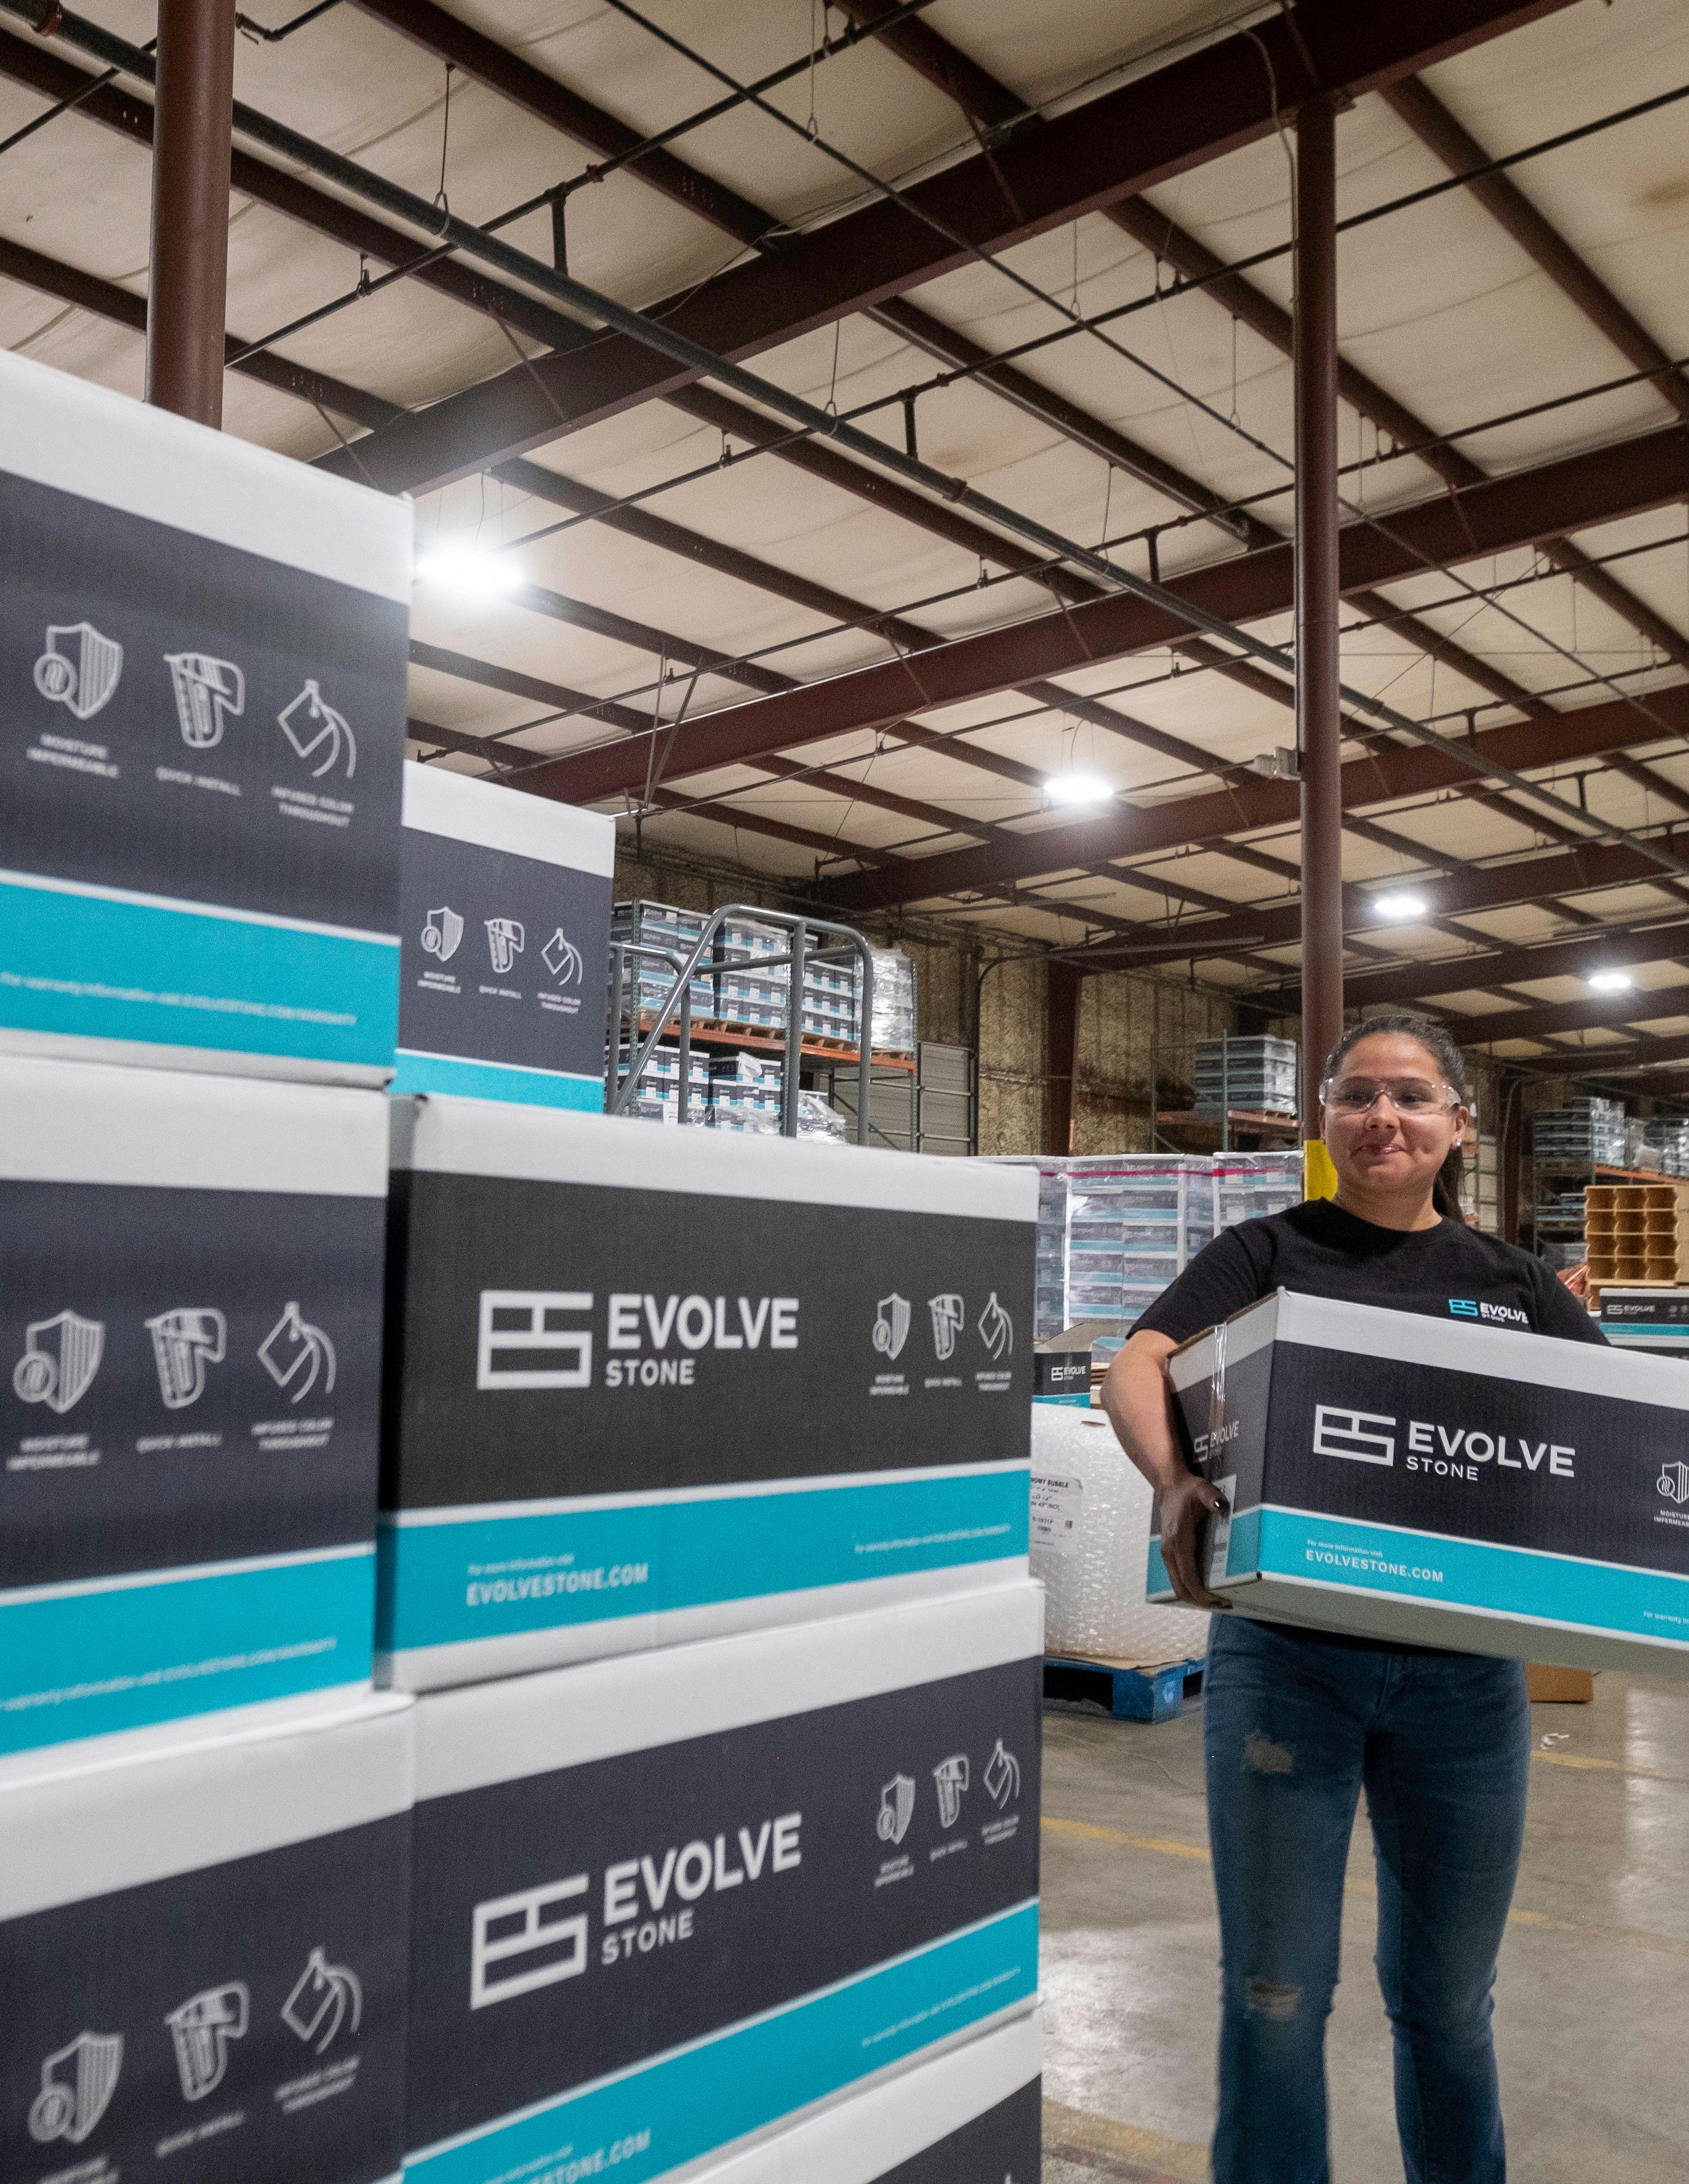
Evolve Services, Inc., Frederick County
Progress Report: Operational Plan
In typical circumstances, VEDP’s Operational Plan outlines specific and incremental actions for VEDP staff to undertake within a fiscal year in order to ultimately achieve the transformational goals of the organization’s Strategic Plan. FY22’s Operational Plan, covering the time period between July 1, 2021, and June 30, 2022, accomplishes not only this objective but also the need for VEDP to respond dynamically to the COVID-19 pandemic. The Plan contained 14 major initiatives that, along with workplans for each VEDP division, demonstrate this dynamic response while also furthering implementation of the Strategic Plan.
Major Initiatives
VEDP prioritized 14 major initiatives in its FY22 Operational Plan, as summarized below. These 14 major initiatives reflect the commitment of VEDP’s staff to work tirelessly on behalf of Virginia.
Major Initiative Status
Develop a playbook to become one of America’s top states for tech sector growth across Virginia
Build out the best customized workforce recruitment and training incentive program in the U.S.
Expand the Virginia Business Ready Sites Program with a strategic approach and statewide participation
Expand exports and imports through implementation of high-priority initiatives in the International Trade Plan
Establish, design, and launch the newly created Virginia Office of Education Economics within VEDP
Develop and implement a comprehensive HR talent management strategy
Complete launch and implementation of Team Virginia to enhance consultant and executive perceptions of Virginia
Complete value proposition materials for all target sectors and facilitate ongoing updates
Build processes and capabilities needed to effectively and efficiently produce holistic project responses
Further develop and execute strategies to capture post-COVID economic recovery and growth opportunities
Implement a best-in-class BRE Program, including clear protocols, high productivity, and reporting of insights
Develop a comprehensive strategy for supporting local and regional EDOs
Improve data management and capabilities to expand utilization across VEDP to better guide activities
Fully leverage IT platforms to enhance organizational effectiveness
Partially completed
Did not achieve goal Goal achieved as planned
Change in approach/focus
53
Progress Report: Marketing Plan
VEDP executes a variety of marketing initiatives each year to build awareness among executives and site selection consultants of Virginia’s attractive business climate and many assets for businesses. Because business site-selection processes rely on both quantitative assessments as well as qualitative perceptions of regions and states, strategic marketing efforts can make a substantial impact on a state’s ability to attract investment. VEDP focuses its marketing efforts on eight key industry sectors and several related subsectors.
FY22 Marketing Highlights:
■ Implemented a targeted site selection consultant cultivation effort to raise awareness and improve perceptions of Virginia as a premier business destination among this highly valued influencer group.
■ In partnership with Team Virginia, hosted dozens of top site consultants in Richmond for Consultant Symposiums.
■ Published four editions of Virginia Economic Review, a quarterly magazine featuring Virginia’s assets and advantages for business, including rural Virginia, as well as interviews with national and in-state thought leaders.
■ Implemented a C-level testimonial campaign featuring companies located in Virginia.
■ Oversaw implementation of VEDP’s event marketing program.
■ Produced and maintained a high-quality web presence on VEDP.org and ExportVirginia.org.
■ Placed multiple, limited ad campaigns to raise awareness and improve perceptions of Virginia as a business destination.

■ Created new brochures and website content for several industry sectors.
Note: To shield strategic initiatives from competitors, the update provided in this document is purposely high-level. Additional details about VEDP’s marketing and lead generation activities can be provided to in-state partners through in-person briefings.
Informing and Transforming How VEDP Markets Key Industries:
In FY22, VEDP completed a major refresh of its value proposition materials — with deep dives on Virginia’s key industry sectors — to better position the Commonwealth. Consistently branded, the new value proposition collateral and content provides comprehensive looks at the state’s assets and the advantages of a Virginia location. From brochures to web to branded collateral, these pivotal pieces help guide how the organization markets Virginia to prospects and target audiences.
54
The second quarter 2022 issue of Virginia Economic Review (pictured top right) featured every region of the Commonwealth in highlighting innovative partnerships between companies and institutions to provide a pipeline of skilled talent while creating better employment outcomes for workers.


Focus on Regions in Proximity to High-Unemployment Areas:
VEDP balances its marketing efforts by highlighting all regions of Virginia (including rural areas and assets) through social media, Virginia Economic Review, site selection consultant and media familiarization tours, and inclusion of regional and local partners in lead generation events.
In FY22, 10 of the 41 partners from across the Commonwealth that participated in marketing Virginia with VEDP at its 88 lead generation events were from a rural locality or region.
Most (59%) of the partner mentions in FY22 on VEDP’s Twitter account were of a rural locality or region.
55
Pictured right (from top to bottom): Virginia Economic Review; Issues Q2 2022, Q1 2022, Q4 2021, and Q3 2021

Nassawadox Creek, Northampton County
APPENDIX
Virginia Economic Development Partnership
Audited Basic Financial Statements
Fiscal Year 2022
VEDP.org
Audited Basic Financial Statements For the Fiscal Year Ended June 30, 2022 - TABLE OF CONTENTSPages INTRODUCTORY SECTION Appointed Officials 2 FINANCIAL SECTION Management’s Discussion and Analysis 3-8 Basic Financial Statements Statement of Net Position 9 Statement of Activities 10 Balance Sheet-Governmental Funds 11 Statement of Revenues, Expenditures, and Changes in Fund Balances of Governmental Funds 12 Reconciliation of the Statement of Revenues, Expenditures, and Changes in Fund Balances of Governmental Funds to the Statement of Activities 13 Statement of Revenues, Expenditures, and Changes in Fund Balances, Budget and Actual-Cash Basis-General and Special Revenue Funds 14 Notes to Financial Statements 15-77 Required Supplementary Information 78-96 Independent Auditor’s Report on Financial Statements 97-100
Virginia Economic Development Partnership
INTRODUCTORY SECTION
VIRGINIA ECONOMIC DEVELOPMENT PARTNERSHIP
Richmond, Virginia
APPOINTED OFFICIALS
As of June 30, 2022
Board of Directors
Dan M. Pleasant, Chair
The Honorable Caren Merrick, Ex-Officio, Vice Chair
Nancy Howell Agee
Carrie Hileman Chenery
C. Daniel Clemente
Gregory B. Fairchild
Deborah K. Flippo
Richard “Rick” O. Harrell, III
Ned W. Massee
Vincent J. Mastracco
Marianne Radcliff
Xavier R. Richardson
Steven David Stone
The Honorable Stephen Cummings, Ex-Officio
April Kees, Ex-Officio
Anne Oman, Ex-Officio
Stephen Edwards, Ex-Officio
President and Chief Executive Officer
Jason R. El Koubi
2
FINANCIAL SECTION
VIRGINIA ECONOMIC DEVELOPMENT PARTNERSHIP MANAGEMENT’S DISCUSSION AND ANALYSIS (UNAUDITED)
AS OF JUNE 30, 2022
The Virginia Economic Development Partnership (the Partnership) management offers the readers of the Partnership’s financial statements this narrative overview and analysis of its financial activities for the fiscal year ended June 30, 2022. We encourage the reader to consider this information presented here in conjunction with the financial statements and accompanying notes.
Overview of the Financial Statements
Government-Wide Financial Statements
The government-wide financial statements are designed to provide readers with a broad overview of the Partnership in a manner similar to a private sector business.
The Statement of Net Position presents information on all of the Partnership’s assets and liabilities, with the difference between the two reported as net position Over time, increases or decreases in net position may serve as a useful indicator of whether the financial position of the Partnership is improving or deteriorating.
The Statement of Activities presents information showing how the Partnership’s net position changed during the most recent fiscal year. All changes in net position are reported as soon as the underlying event giving rise to the change occurs, regardless of the timing of the related cash flows. Thus, revenues and expenses are reported in this statement for some items that will only result in cash flows in future fiscal periods. For example, expenses that are accrued for the net pension liability in the current period are expected to be paid with future funding appropriations from the Commonwealth of Virginia (COV).
Fund Financial Statements
A fund is a grouping of related accounts that is used to maintain control over resources that have been segregated for specific activities or objectives. The Partnership, like other political subdivisions of the COV, uses fund accounting to ensure and demonstrate compliance with finance-related legal requirements. The financial activities of the Partnership are reported in governmental funds.
Governmental Funds: Governmental funds are used to account for essentially the same functions reported as governmental activities in the government-wide financial statements. However, unlike the government-wide financial statements, governmental fund financial statements focus on near-term inflows and outflows of spendable resources, as well as on balances of spendable resources available at the end of the fiscal year. Such information may be useful in evaluating the Partnership’s near-term financing requirements.
3
Reconciliations between Government-Wide and Fund Financial Statements
There are two reconciliations between the government-wide and the fund financial statements. The first is found on the Balance Sheet and explains the difference between the fund balance on the Balance Sheet and net position on the Statement of Net Position. The second is found on the Reconciliation of the Statement of Revenues, Expenditures, and Changes in Fund Balances of Governmental Funds to the Statement of Activities, which reconciles the difference between the net change in fund balances on the fund-based statement and the change in net position on the government-wide based statement. Both statements describe in sufficient detail the amounts and the reasons for those differences.
Government-Wide Financial Analysis
As noted earlier, net position may serve over time as a useful indicator of an organization’s financial position At the close of the fiscal year ended June 30, 2022, the Partnership had a net position of $3,754,784 compared to a net position of ($2,426,766) as of June 30, 2021 Following is an analysis of the changes in the net position of the Partnership.
Net Position
4
2022 2021 Increase (Decrease) Current and other assets $19,903,691 $13,185,453 $ 6,718,238 Capital assets, net of depreciation and amortization 20,520,737 3,144,118 17,376,619 Total assets 40,424,428 16,329,571 24,094,857 Deferred outflows of resources 6,281,662 6,625,970 (344,308) Total assets and deferred outflows 46,706,090 22,955,541 23,750,549 Current and other liabilities 3,994,198 1,815,431 2,178,767 Non-current liabilities 30,019,183 22,010,730 8,008,453 Total liabilities 34,013,381 23,826,161 10,187,220 Deferred inflows of resources 8,937,925 1,556,146 7,381,779 Total liabilities and deferred inflows 42,951,306 25,382,307 17,568,999 Net position: Net investment in capital assets 1,078,608 2,095,003 (1,106,395) Restricted 954,220 557,238 396,982 Unrestricted 1,721,956 (5,079,007) 6,800,963 Total net position $ 3,754,784 $ (2,426,766) $ 6,181,550
Total assets increased this fiscal year by $24,094,857 when compared to last year due to an increase of $6,718,238 in Current and other assets along with an increase of $17,376,619 in Capital assets, net of depreciation and amortization. The increase in Current and other assets consists of an increase in the Current asset, cash of $6,397,879 due to unspent FY2022 funding for the Virginia Business Ready Sites Program and the Talent Solutions – Talent Accelerator Program, an increase of $396,982 in the Restricted net other postemployment asset recorded in compliance with GASB 75, Accounting and Financial Reporting for Postemployment Benefits Other Than Pension (GASB 75), related to the Partnership’s participation in the Virginia Retirement System Disability Insurance Program, and an increase in other current assets of $2,982. These increases were offset by a decrease in Operating grants receivable of $79,605 due to the timing of reimbursement payments in connection with the Federal STEP grant.
The increase of $17,376,619 in Capital assets, net of depreciation and amortization, is due primarily to the Partnership’s implementation of GASB Statement No. 87, Leases (GASB 87), that requires the value of leases with non-cancellable terms in excess of twelve months be recorded on the statement of net position as a right to use intangible lease asset (lease asset). The Partnership recorded $20,168,580 in additional lease assets along with the corresponding lease liability upon adoption of this new standard effective July 1, 2021. This increase in lease assets was offset by lease assets amortization of $2,213,428, as well as normal depreciation expense on leasehold improvements, furniture, and equipment at the Partnership’s James Center headquarters location.
Deferred outflows of resources decreased by $344,308 This decrease is due primarily to differences between projected and actual earnings on plan investments, offset by increases due to changes in assumptions, changes in proportion and differences between employer contributions and proportionate share of contributions, and an increase in the Partnership’s FY2022 employer contributions subsequent to the measurement date related to the Partnership’s participation in the Virginia Retirement System pension and other postemployment benefit plans, recorded in compliance with GASB Statement No. 68, Accounting and Financial Reporting for Pensions (GASB 68) and GASB 75.
Total liabilities increased by $10,187,220 due to an increase of $18,597,215 in Long-term lease liability due to the Partnership’s adoption of GASB 87, which requires recognition of a lease liability. This increase was offset by a decrease of $7,931,757 related to the Partnership’s Net pension liability, a decrease of $327,968 in Net other postemployment liability, and a net decrease of $150,270 in other current and long-term liabilities primarily related to Financed purchase obligations.
Deferred inflows of resources increased by $7,381,779. This increase is due mainly to differences between projected and actual earnings on plan investments, as well as differences between expected and actual experience related to the Partnership’s participation in the Virginia Retirement System pension and other postemployment benefit plans, recorded in compliance with GASB 68 and GASB 75.
Net investment in capital assets consists primarily of right to use intangible lease assets, leasehold improvements, furniture, computers, and technology equipment used to deliver program services to clients, net of long-term lease liability and financed purchase obligation The Partnership considers technology a vital asset in its efforts to market Virginia and will continue to invest in technology to ensure that its equipment and software are updated to take advantage of the latest data handling capabilities and increased processing speeds.
Restricted Net position represents the portion of fund balance related to the Restricted net other postemployment asset recorded in compliance with GASB 75 due to the Partnership’s participation in the Virginia Retirement System Disability Insurance Program. The remaining Net position balance of $1,721,956 is classified as unrestricted The Partnership has recorded $12,265,339 of net pension liability and net other postemployment benefits liabilities that are expected to be paid with future appropriations from the COV The Partnership’s Current and other assets exceed its Current and other liabilities by $15,909,493.
5
Changes in Net Position
Net position for the Partnership increased by $6,181,550 during the current fiscal year. The total revenues increase of $12,298,465 is due primarily to an $11,089,371 increase in General Fund appropriations from the COV related to funding for new and existing programs, including Virginia Business Ready Sites, Talent Solutions
Talent Accelerator, and the International Trade Plan, along with an increase of $1,112,475 in Federal grant funding for the Economic Development Administration economic strategy grant and the International Trade STEP grant
Total expenses for the Partnership increased by $5,896,765 This increase is due primarily to additional spending in International Trade for the International Trade plan of $2,304,501, continued expansion of the Talent Solutions – Talent Accelerator Program with an increase of $1,251,380, and spending in VOEE and Real Estate Solutions that were new divisions for FY2022.
6
2022 2021 Increase (Decrease) Revenues: Program revenues: Charges for services $ 429,388 $ 329,620 $ 99,768 Operating grants 1,420,877 308,402 1,112,475 General revenues: General Fund appropriations 45,941,579 34,852,208 11,089,371 Other 168,165 171,314 (3,149) Total revenues 47,960,009 35,661,544 12,298,465 Expenses: Talent Solutions - VJIP 968,801 986,112 (17,311) Talent Solutions - TAP 5,129,156 3,877,776 1,251,380 VOEE 741,623 - 741,623 Business Investment 6,080,516 5,464,594 615,922 International Trade 9,419,071 7,114,570 2,304,501 Research 2,652,568 2,981,245 (328,677) Marketing and Communications 4,408,323 3,758,613 649,710 Economic Competitiveness 938,420 884,706 53,714 Real Estate Solutions 463,789 - 463,789 Information Technology 1,760,515 1,382,487 378,028 Incentives 709,903 676,353 33,550 Administration 6,030,684 5,746,094 284,590 Pass-Through Payments 2,475,000 3,009,144 (534,144) Total expenses 41,778,459 35,881,694 5,896,765 Increase (Decrease) in net position 6,181,550 (220,150) 6,401,700 Beginning net position (2,426,766) (2,206,616) (220,150) Ending net position $ 3,754,784 $ (2,426,766) $ 6,181,550
–
Governmental Funds Analysis
The Partnership records all its financial activities in the General Fund, with the exception of International Trade and Administration federal grant programs that are recorded in the Special Revenue Fund. The financial position of the Partnership improved by $6,229,605 in FY2022 primarily due to the increase in Cash, offset by an increase in current liabilities as noted in the Government-Wide Financial Analysis, resulting in a fund balance of $17,932,782 as of June 30, 2022. $1,591,153 of the fund balance consists of Prepaid expenses and Lease deposits and is nonspendable, with the remaining balance of $16,341,629 unassigned. The Special Revenue fund records revenues and expenditures in equal amounts and has no fund balance. Activity for the Special Revenue fund increased from $308,402 in FY2021 to $1,420,877 in FY2022 due to the timing of payments for the Economic Development Administration economic strategy grant and the International Trade STEP grant.
General and Special Revenue Fund Budgetary Highlights
The Statement of Revenues, Expenditures, and Changes in Fund Balance, Budget and Actual-Cash Basis is presented to provide information on the budget as originally prepared and the final budget on which the Partnership operated for the fiscal year. Also, the final budget is compared to the cash basis actual results by revenue source and expenditure activity. The Partnership’s budget, as originally prepared, included revenue provided by the COV of approximately $45.0 million. This amount was increased by $1.4 million for economic development opportunity project funding, offset by a $ 5 million reduction for marketing and trade mission funding.
Actual expenditures were below the final budget by approximately $16.1 million for the fiscal year. This underspending was primarily in the Talent Solutions – Talent Accelerator Program and Pass-through Payments for the Virginia Business Ready Sites Program. All divisions have some amount of underspending due to staff vacancies.
FY2023 Outlook
The COVID-19 pandemic initially resulted in policy changes necessary to protect public health causing a substantial economic downturn. The Partnership made the decision to implement teleworking in March 2020 to protect the health and safety of its staff, with limited office access following CDC guidelines. The Partnership continued to telework for most of FY2022, with staff returning to work in the office in May 2022. The economic effects of COVID-19 are not expected to continue into the next fiscal year and should not impact FY2023 performance metrics.
The Partnership received FY2023 COV funding for some of its key initiatives, including expansion of the Talent Solutions – Talent Accelerator customized, turnkey workforce recruitment and training incentive program, Virginia’s International Trade Plan implementation, and funding to address staff capacity issues. The Partnership will continue to seek funding for other important initiatives critical to its success.
7
Notes to the Financial Statements
The notes provide additional information that is essential to a full understanding of the data provided in the government-wide and fund financial statements. The notes describe the nature of the Partnership’s reporting entity and the relationship to the COV as a whole, the basis on which the financial statements were prepared, and the methods used for presentation. Further, the notes provide explanations of specific accounts with significant balances.
Requests for Information
This financial report is designed to provide a general overview of the Partnership’s finances for all those with an interest. Questions concerning any of the information provided in this report or requests for additional financial information should be addressed to the President and Chief Executive Officer, Virginia Economic Development Partnership, P.O. Box 798, Richmond, Virginia, 23218-0798.
8
BASIC FINANCIAL STATEMENTS
VIRGINIA ECONOMIC DEVELOPMENT PARTNERSHIP STATEMENT OF NET POSITION
As of June 30, 2022
The accompanying notes are an integral part of the financial statements.
Governmental Activities Assets Cash and cash equivalents (Note 2) 17,244,448 $ Travel advances 13,774 Operating grants receivable 100,096 Prepaid expenses 1,576,242 Lease deposits (Note 5) 14,911 Restricted net other postemployment asset (Note 13) 954,220 Capital assets, net of accumulated depreciation and amortization (Note 6) Leasehold improvements, furniture, and equipment 2,565,585 Right to use intangible lease assets 17,955,152 Total assets 40,424,428 Deferred outflows of resources (Notes 10, 11, 12, 13, and 14) 6,281,662 Total assets and deferred outflows of resources 46,706,090 Liabilities Accounts payable 500,223 Accrued payroll 327,603 Unearned revenue 156,950 Long-term liabilities due within one year Financed purchase obligation (Note 8) 135,594 Compensated absences (Note 9) 943,479 Long-term lease liability (Note 7) 1,881,654 Net other postemployment liability (Note 14) 48,695 Long-term liabilities due in more than one year Financed purchase obligation (Note 8) 709,320 Compensated absences (Note 9) 328,963 Long-term lease liability (Note 7) 16,715,561 Net pension liability (Note 10) 9,513,136 Net other postemployment liability (Notes 11, 12, and 14) 2,752,203 Total liabilities 34,013,381 Deferred inflows of resources (Notes 10, 11, 12, 13, and 14) 8,937,925 Total liabilities and deferred inflows of resources 42,951,306 Net position Net investment in capital assets 1,078,608 Restricted for net other postemployment asset (Note 13) 954,220 Unrestricted 1,721,956 Total net position 3,754,784 $
9
VIRGINIA ECONOMIC DEVELOPMENT PARTNERSHIP STATEMENT OF ACTIVITIES
For the Fiscal Year Ended June 30, 2022
Program Revenues
Net (Expense) Revenue and Charges forOperatingChanges in ExpensesServicesGrantsNet Position Governmental Activities Talent Solutions - VJIP 968,801 $ (968,801) $ Talent Solutions - TAP 5,129,156 56,703 (5,072,453) VOEE 741,623 (741,623) Business Investment 6,080,516 (6,080,516) International Trade 9,419,071 270,435 277,618 (8,871,018) Research 2,652,658 (2,652,658) Marketing and Communications 4,408,323 57,250 (4,351,073) Economic Competitiveness 938,420 (938,420) Real Estate Solutions 463,789 (463,789) Information Technology 1,760,515 (1,760,515) Incentives 709,903 45,000 (664,903) Administration 6,030,684 - 1,143,259 (4,887,425) Pass-through Payments 2,475,000 (2,475,000) Total governmental activities 41,778,459 429,388 1,420,877 (39,928,194) General Revenues Revenue provided by the General Fund of the Commonwealth (Note 4) 45,941,579 Interest revenue 49,822 Loss on disposal of capital assets (26,740) Other revenue 145,083 Total general revenues 46,109,744 Increase in net position 6,181,550 Net position, July 1, 2021 (2,426,766) Net position, June 30, 2022 3,754,784 $
The accompanying notes are an integral part of the financial statements.
10
VIRGINIA ECONOMIC DEVELOPMENT PARTNERSHIP BALANCE SHEET GOVERNMENTAL FUNDS
As of June 30, 2022
Amounts reported for governmental activities in the statement of net position are different because:
Capital assets used in governmental activities are not financial resources and, therefore, are not reported in the funds.
Restricted net other postemployment asset is not a financial resource and, therefore, is not reported in the funds.
Deferred outflows and deferred inflows associated with pension and other postemployment benefit related costs are longterm in nature and, therefore, not reported in the funds.
Noncurrent liabilities (compensated absences, financedpurchase obligation, long-term lease liability,net pension liability and net other postemployment obligation) are not due and payable with current financial resources and, therefore, not reported in the funds.
The accompanying notes are an integral part of the financial statements.
Special Total GeneralRevenue Governmental Fund Fund Funds Assets Cash and cash equivalents (Note 2) 17,244,448 $ $ 17,244,448 $ Travel advances 13,774 13,774 Due from the special revenue funds 100,096 Operating grants receivable 100,096 100,096 Prepaid expenses 1,576,242 1,576,242 Lease deposits (Note 5) 14,911 14,911 Total assets 18,949,471 $ 100,096 $ 18,949,471 $ Liabilities and Fund Balances Liabilities: Accounts payable 500,223 $ 500,223 $ Accrued payroll 327,603 327,603 Compensated absences 31,913 31,913 Due to the general fund 100,096 Unearned revenue 156,950 156,950 Total liabilities 1,016,689 100,096 1,016,689 Fund Balances: Nonspendable 1,591,153 1,591,153 Unassigned fund balance 16,341,629 16,341,629 Total fund balances 17,932,782 17,932,782 Total liabilities and fund balances 18,949,471 $ 100,096 $ 18,949,471 $ Fund balances, Governmental Funds 17,932,782 $ 20,520,737 954,220 (2,656,263) (32,996,692) Total net position of governmental activities 3,754,784 $
11
VIRGINIA ECONOMIC DEVELOPMENT PARTNERSHIP STATEMENT OF REVENUES, EXPENDITURES, AND CHANGES IN FUND BALANCES OF GOVERNMENTAL FUNDS
For the Fiscal Year Ended June 30, 2022
Special Total GeneralRevenueGovernmental Fund Fund Funds Revenues Revenue provided by the General Fund of the Commonwealth (Note 4) 45,941,579 $ $ 45,941,579 $ Participation fees 327,685 327,685 Operating grants 1,420,877 1,420,877 Interest revenue 49,822 49,822 Other revenue 246,786 246,786 Total revenues 46,565,872 1,420,877 47,986,749 Expenditures Talent Solutions - VJIP 993,665 993,665 Talent Solutions - TAP 5,038,480 5,038,480 VOEE 800,690 800,690 Business Investment 6,216,448 6,216,448 International Trade 8,069,873 277,618 8,347,491 Research 2,700,658 2,700,658 Marketing and Communications 4,451,135 4,451,135 Economic Competitiveness 923,377 923,377 Real Estate Solutions 454,111 454,111 Information Technology 1,678,793 1,678,793 Incentives 707,167 707,167 Administration 5,836,870 1,143,259 6,980,129 Pass-through Payments 2,475,000 2,475,000 Total expenditures 40,346,267 1,420,877 41,767,144 Revenues over expenditures 6,219,605 6,219,605 Other Financing Sources Proceeds from sale of capital assets 10,000 10,000 Total other financing sources 10,000 - 10,000 Total Increase in Fund Balance 6,229,605 - 6,229,605 Fund balance, July 1, 2021 11,703,177 11,703,177 Fund balance, June 30, 2022 17,932,782 $ $ 17,932,782 $
12
The accompanying notes are an integral part of the financial statements.
RECONCILIATION OF THE STATEMENT OF REVENUES, EXPENDITURES, AND CHANGES IN FUND BALANCES OF GOVERNMENTAL FUNDS TO THE STATEMENT OF ACTIVITIES
For the Fiscal Year Ended June 30, 2022
Amounts reported for governmental activities in the statement of activities are different because:
Governmental funds report capital outlays as expenditures. However, in the statement of activities the cost of those assets is allocated over their estimated useful livesand reported as depreciation and amortization expense. This is the amount by which depreciationand amortization expense exceeded capital outlays in the current period.
Some expenses reported in the statement of activities (compensated absences, financedpurchase obligation, long-term lease liability,net pension liability and net other post employment asset and obligation) do not require the use of current financial resources and, therefore, are not reported as expenditures in governmental funds.
The accompanying notes are an integral part of the financial statements.
Net increase (decrease) in fund balance of the governmental funds 6,229,605 $ (2,791,961) 2,743,906 Increase in net position of governmental activities 6,181,550 $
13
VIRGINIA ECONOMIC DEVELOPMENT PARTNERSHIP STATEMENT OF REVENUES, EXPENDITURES, AND CHANGES IN FUND BALANCES
BUDGET AND ACTUAL - CASH BASIS GENERAL AND SPECIAL REVENUE FUNDS
For the Fiscal Year Ended June 30, 2022
The accompanying notes are an integral part of the financial statements.
SpecialVariances with GeneralRevenueFinal BudgetFund FundPositive OriginalFinalActualActual(Negative) Revenues Revenue provided by the General Fund of the Commonwealth (Note 4) 45,011,549 $ 45,941,579 $ 45,941,579 $ $ $ Participation fees 483,000 330,000 327,685 (2,315) Operating grants 200,000 1,500,000 1,500,482 482 Interest revenue 25,000 50,000 49,822 (178) Other revenue 191,370 250,000 246,786 (3,214) Total revenues 45,910,919 48,071,579 46,565,872 1,500,482 (5,225) Expenditures Talent Solutions - VJIP 1,092,544 1,092,544 983,560 108,984 Talent Solutions - TAP 11,223,069 11,223,069 4,999,904 6,223,165 VOEE 800,000 800,000 786,121 13,879 Business Investment 6,337,915 6,337,915 6,148,523 189,392 International Trade 8,815,586 8,815,586 8,107,684 277,618 430,284 Research 2,964,875 2,964,875 2,680,829 284,046 Marketing and Communications 4,712,844 4,712,844 4,491,255 221,589 Economic Competitiveness 1,033,198 1,033,198 909,792 123,406 Real Estate Solutions 1,200,000 1,200,000 443,530 756,470 Information Technology 1,446,265 1,525,000 1,511,310 13,690 Incentives 658,969 725,000 703,352 21,648 Administration 4,847,005 7,210,000 6,065,450 1,143,259 1,291 Pass-through Payments 10,179,666 10,179,666 2,475,000 7,704,666 Total expenditures 55,311,936 57,819,697 40,306,310 1,420,877 16,092,510 Revenues over (under) expenditures (9,401,017) (9,748,118) 6,259,562 79,605 16,087,285 Other Financing Sources Proceeds from sale of capital assets 10,000 10,000 Total other financing sources 10,000 10,000 Total Increase in Fund Balance 6,269,562 79,605 6,349,167 Fund balance, July 1, 2021 9,401,017 9,748,118 10,209,499 537,647 999,028 Fund balance, June 30, 2022 (Note 3) $ $ 16,479,061 $ 617,252 $ 17,096,313 $
Budgeted Amounts 14
NOTES TO FINANCIAL STATEMENTS
VIRGINIA ECONOMIC DEVELOPMENT PARTNERSHIP
NOTES TO FINANCIAL STATEMENTS
AS OF JUNE 30, 2022
1. SUMMARY OF SIGNIFICANT ACCOUNTING POLICIES
A. Reporting Entity
The Virginia Economic Development Partnership (the Partnership) was established on July 1, 1996, by Chapter 638 of the 1995 Acts of Assembly and operates as an authority in accordance with the provisions of Chapter 22 of Title 2.2 of the Code of Virginia The Partnership’s major activities are to encourage, stimulate, and support the development and expansion of the economy of the Commonwealth.
The Partnership is a component unit of the Commonwealth of Virginia A separate report is prepared for the Commonwealth of Virginia, which includes all agencies, boards, commissions, and authorities over which the Commonwealth exercises or has the ability to exercise oversight authority. The Partnership is an integral part of the reporting entity of the Commonwealth of Virginia; accordingly, the Partnership’s financial statements are included in the financial statements of the Commonwealth as a discretely presented component unit.
B. Measurement Focus, Basis of Accounting, and Financial Statement Presentation
The accompanying financial statements have been prepared in accordance with general ly accepted accounting principles. The Statement of Net Position and the Statement of Activities are referred to as “government-wide” financial statements and are reported using the economic resources measurement focus and the accrual basis of accounting Revenues are recorded when earned and expenses are recorded when a liability is incurred, regardless of the timing of related cash flows. Interfund activity and balances between the General Fund and Special Revenue Fund have been eliminated in the government -wide financial statements. The Statement of Activities shows the extent that direct expenses of governmental functions are offset by program revenues. In cases where certain indirect costs have been allocated to the various divisions by headcount, program expenses will include both direct and indirect costs. Program revenues include charges for services and operating grants. Charges for services are comprised primarily of participation fees, sponsorship fees, and shared mission reimbursements. Operating grants are grants awarded to the Partnership from the federal government and other sources. Net investment in capital assets consists of leasehold improvements, furniture, computers and peripheral technology equipment used to deliver program services to clients, net of financed purchase obligations, as well as right to use intangible lease assets recorded in accordance with GASB 87, Leases (GASB 87). Restricted Net position represents the portion of fund balance related to the Restricted net other postemployment asset recorded in compliance with GASB 75 due to the Partnership’s participation in the Virginia Retirement System Disability Insurance Program. The r emaining Net position balance is classified as unrestricted.
The Balance Sheet and the Statement of Revenue s, Expenditures, and Changes in Fund Balances are referred to as “governmental fund” financial statements and are reported using the current financial resources measurement focus and the modified accrual basis of
15
accounting. Revenues are recognized as soon as they are both measurable and available. Revenues are considered available when they are collectible within the current period or soon enough thereafter to pay liabilities of the current period. For this purpose, the Partnership considers revenues to be available if they are collected within 60 days of the end of the current fiscal period. Expenditures generally are recorded when a liability is incurred, as in accrual accounting. However, debt service payments and expenditures related to compensated absences are only recorded when payment is due. The Partnership reports its activities in governmental funds. The general fund is used for its pr imary operating fund and accounts for all financial transactions not accounted for in the special revenue funds The special revenue fund is used to account for grant revenues and related expenditures for operating grants awarded to the Partnership by the federal government and other sources Both the General Fund and Special Revenue Fund are reported as major governmental funds.
Fund balances for the Partnership’s governmental funds financial statements are classified in accordance with Governmental Accounting Standards Board (GASB) Statement No. 54, “Fund Balance Reporting and Governmental Fund Type Definitions .” Fund balances are classified as restricted, committed or assigned if the related resources reported in governmental funds have either externally or internally imposed restrictions on their usage. Nonspendable fund balances represent assets such as prepaid expenses and lease deposits that are unavailable to be spent on future operations. The unassigned fund balances represents the remainder of the fund balances funds.
C Operating Grants Receivable
Operating grants receivable represents the amount due from the federal government for grants that are funded based on reimbursement of expenses paid by the Partnership.
D. Prepaid Expenses
The Partnership’s prepaid expenses include amounts paid for promotional activities, other services and portions of insurance premiums for which the economic benefits had not been received as of June 30, 2022.
E. Capital Assets
Capital assets are defined by the Partnership as those assets with an initial, individual cost of more than $5,000 and an estimated useful life in excess of two years. Such assets are recorded at historical cost or estimated historical cost. Donated capital assets are reported at acquisition value, measured at estimated market value at the date of donation. Capital assets are comprised of leasehold improvements, furniture, and equipment. The cost of normal maintenance and repairs that do not add to the value of the asset or materially extend asset lives are not capitalized.
Capital assets are depreciated using the st raight-line method over useful lives of five to ten years.
F. Leases
The Partnership adopted GASB 87 on July 1, 2021. Beginning adjustments to record right to use intangible lease assets (lease asset) and lease liabilities had no effect on beginning net position. For new or modified contracts, the Partnership determines whether the contract is a
16
lease. If the lease contains a non-cancellable term in excess of 12 months (including any options to extend or terminate the lease when ex ercise is reasonably certain), the Partnership records a lease asset and lease liability. The lease liability is measured at the present value of payments expected to be made during the lease term, and then is reduced by the principal portion of lease payments made. Lease payments are apportioned between interest expense and principal based on an amortization schedule. The lease asset is measured as the initial amount of the lease liability, adjusted for lease payments made at or before the lease commencement date, plus certain initial direct costs, then amortized on a straight line basis over a period that is the shorter of the lease term or the useful life of the asset. The Partnership reports lease assets with a present value of $50,000 or greater and an expected useful life of more than one year.
The Partnership is a lessee for non-cancellable leases of certain office space. The Partnership has recorded a lease liability and lease asset on the Statement of Net Position. Leases with an initial, non-cancellable term of 12 months or less are not recorded on the Statement of Net Position and expense is recognized as incurred over the lease term.
Key estimates and judgments related to leases include how the Partnership determines (1) the discount rate it uses to discount the expected lease payments to present value, (2) lease term, and (3) lease payments. GASB 87 requires a lessee to discount its unpaid lease payments using the interest rate implicit in the lease or, if that rate cannot be determined, its incremental borrowing rate. Since the Partnership cannot determine the interest rate implicit in its leases, the Partnership uses its estimated incremental borrowing rate as the discount rate for its leases.
The lease term for all the Partnership’s leases includes the noncancellable period of the lease plus any additional periods covered by either the Partnership’s option to extend the lease that the Partnership is reasonably certain to exercise, or an option to extend the lease controlled by the lessor.
The Partnership monitors changes in circumstances that would require remeasurement of its leases and will remeasure the lease asset and liabilit y if certain changes occur that are expected to significantly affect the amount of the lease liability.
G. Unearned Revenue
Unearned revenue includes amounts received for sponsorship and participation fees at June 30, 2022, for various events to be held in the next fiscal period.
H. Compensated Absences
Compensated absences represent the amounts of vacation, sick, and compensatory leave earned by the Partnership employees, but not taken at June 30, 2022. Compensated absences were calculated in accordance with GASB Statement No. 16, “Accounting for Compen sated Absences.” This statement requires the accrual of Social Security and Medicare taxes to be paid by the Partnership on all accrued compensated absences.
I Pensions
The Virginia Retirement System (VRS) State Employee Retirement Plan is a single employer pension plan that is treated like a cost-sharing plan. For purposes of measuring the net pension liability, deferred outflows of resources and deferred inflows of resources related to pensions,
17
and pension expense, information about the fiduciary net position of the VRS State Employee Retirement Plan; and the additions to/deductions from the VRS State Employee Retirement Plan’s fiduciary net position have been determined on the same basis as they were reported by VRS. For this purpose, benefit payments (including refunds of employee contributions) are recognized when due and payable in accordance with the benefit terms. Investments are reported at fair value.
J State Employee Health Insurance Credit Program
The VRS State Employee Health Insurance Credit Program is a single employer plan that is presented as a multiple-employer, cost-sharing plan. The State Employee Health Insurance Credit Program was established pursuant to §51.1-1400 et seq. of the Code of Virginia, as amended, and which provides the authority under which benefit terms are established or may be amended. The State Employee Health Insurance Credit Program is a defined benefit plan that provides a credit toward the cost of health insurance coverage for retired state employees. For purposes of measuring the net State Employee Health Insurance Credit Program OPEB liability, deferred outflows of resources and deferred inflows of resources related to the State Employee Health Insurance Credit Program OPEB, and the State Employee Health Insurance Credit Program OPEB expense, information about the fiduciary net position of the VRS State Employee Health Insurance Credit Program; and the additions to/deductions from the VRS State Employee Health Insurance Credit Program’s fiduciary net position have been determined on the same basis as they were reported by VRS. For this purpose, benefit payments are recognized when due and payable in accordance with the benefit terms. Investments are reported at fair value.
K. Group Life Insurance Program
The VRS Group Life Insurance Program is a multiple employer, cost -sharing plan. It provides coverage to state employees, teachers, and employees of participating political su bdivisions. The Group Life Insurance Program was established pursuant to §51.1-500 et seq. of the Code of Virginia, as amended, and which provides the authority under which benefit terms are established or may be amended. The Group Life Insurance Program is a defined benefit plan that provides a basic group life insurance benefit for employees of participating employers. For purposes of measuring the net Group Life Insurance Program OPEB liability, deferred outflows of resources and deferred inflows of resources related to the Group Life Insurance Program OPEB, and Group Life Insurance OPEB expense, information about the fiduciary net position of the VRS Group Life Insurance Program OPEB and the additions to/deductions from the VRS Group Life Insurance Pr ogram OPEB’s net fiduciary position have been determined on the same basis as they were reported by VRS. In addition, benefit payments are recognized when due and payable in accordance with the benefit terms. Investments are reported at fair value.
L Disability Insurance Program
The VRS Disability Insurance Program (Virginia Sickness and Disability Program) is a single employer plan that is presented as a multiple -employer, cost-sharing plan. The Disability Insurance Program was established pursuant to §51.1-1100 et seq. of the Code of Virginia, as amended, and which provides the authority under which benefit terms are established or may be amended. The Disability Insurance Program is a managed care program that provides sick,
18
family and personal leave and short-term and long-term disability benefits for state employees. For purposes of measuring the net Disability Insurance Program OPEB asset, deferred outflows of resources and deferred inflows of resources related to the Disability Insurance Program OPEB, and Disability Insurance Progr am OPEB expense, information about the fiduciary net position of the VRS Disability Insurance Program OPEB Plan and the additions to/deductions from the VRS Disability Insurance Program OPEB Plan’s net fiduciary position have been determined on the same basis as they were reported by VRS. In addition, benefit payments are recognized when due and payable in accordance with the benefit terms. Investments are reported at fair value.
M Pre-Medicare Retiree Healthcare Plan
The Commonwealth of Virginia State Health Plans Program for Pre -Medicare Retirees (PreMedicare Retiree Healthcare Plan) is a single -employer defined benefit OPEB plan that is treated like a cost-sharing plan for financial reporting purposes. This program was established by Title 2.2, Chapter 28 of the Code of Virginia for retirees who are not yet eligible to participate in Medicare. It is the same health insurance program offered to active employees and managed by the Virginia Department of Human Resource Management. After retirement, the Partnership no longer subsidizes the retiree’s premium; however, since both active employees and retirees are included in the same pool for purposes of determining health insurance rates, retiree rates are effectively lower than w hat might otherwise be available outside of this benefit.
N. Deferred Inflows and Outflows of Resources
Deferred outflows of resources are defined as the consumption of net assets applicable to a future reporting period. The deferred outflows of resources have a positive effect on net position similar to assets.
Deferred inflows of resources are defined as the acquisition of net assets applicable to a future reporting period. The deferred inflows of resources ha ve a negative effect on net position similar to liabilities.
O. Budgets and Budgetary Accounting
The Partnership’s budget was primarily established by the Appropriation Act as enacted by the General Assembly of Virginia for the fiscal year ended June 30, 2022, which is the second year of the biennium ended June 30, 2022. No payments were made to the Partnership out of the state treasury except in pursuance of appropriations made by law. Payments from the state treasury were deposited into Partnership bank accounts in accordance with the provisions of Chapter 22 of Title 2.2 of the Code of Virginia and expended for purposes as stated in those provisions. The budget is prepared on the cash basis. The budget is prepared collecti vely to include both the General Fund and Special Revenue Fund.
19
2. CASH AND CASH EQUIVALENTS
Cash and cash equivalents represent deposits not with the Treasurer of Virginia and cash in the Local Government Investment Pool (LGIP) with the Treasurer of Virginia. As of June 30, 2022, the Partnership’s deposits with the LGIP were $17,095,867 and the Partnership’s deposits not with the Treasurer of Virginia were $148,581 Cash on deposit is held in demand deposit accounts maintained for operating and payroll costs and is covered by federal depository insurance and carry no significant risk. Cash on deposit includes a deposit in European Union Euros used to pay the Partnership’s international vendors and is valued in U S dollars at cost. As of June 30, 2022, the Partnership’s holding in European Union Euros was valued at $24,225 The LGIP funds are held in pooled accounts, are considered cash equivalents and, accordingly, also carry no significant risk as defined by Statement 40 of the Governmental Accounting Standards Board. The LGIP enables governmental entities to maximize their return on investments by providing for a State administered fund where monies can be commingled for investment purposes in order to realize the economies of large -scale investing and professional funds management. The LGIP is managed in accordance with the requirements of Governmental Accounting Standards Board (GASB) Statement No. 79. The LGIP is in compliance with all of the standards of GASB Statement No. 79 and elects to report its investments f or financial reporting at amortized cost. Participants in the LGIP should also report their investments in the LGIP at amortized cost. The LGIP is rated AAAm by Standard & Poor’s rating service. The Partnership deposits are secured in accordance with the provisions of the Virginia Security for Public Deposit Act § 2.2-4400 of the Code of Virginia.
3. RECONCILIATION OF BUDGETARY FUND BALANCE TO GAAP FUND BALANCE
The accompanying Statement of Revenues, Expenditures, and Changes in Fund Balances - Budget and Actual - Cash Basis – General and Special Revenue Funds presents comparisons of the legally adopted budget prepared on the cash basis with actual data prepared on the cash basis. To enhance this comparison, actual data on the cash basis is reconciled to actual data on the GAAP basis as follows:
20
Total all Funds Fund balance, cash basis, June 30, 2022 $ 17,096,313 Add: Prepaid expenses and other accrued receivables 1,676,338 Less: Accrued expenses and unearned revenues (839,869) Fund balance, GAAP basis, June 30, 2022 $ 17,932,782
4. REVENUE PROVIDED BY THE GENERAL FUND OF THE COMMONWEALTH
The original appropriation from the General Fund of the Commonwealth has been adjusted as follows:
provided by the General Fund of the Commonwealth $ 45,941,579
5 LEASE DEPOSITS
The Partnership maintains offices in Fredericksburg, Virginia, Virginia Beach, Virginia, Munich, Germany, and Tokyo, Japan. Each landlord requires a lease deposit as part of the lease agreement for those locations
The Fredericksburg lease deposit is held in U.S. dollars in a noninterest - bearing account and is valued at $1,664. The Virginia Beach lease deposit is held in U.S. dollars in a noninterest -bearing account and is valued at $400. The Munich lease deposit is held in a noninterest-bearing account in the amount of 3,720 European Union Euros and was valued at $4,254 at June 30, 2022. The Tokyo lease deposit is held in a noninterestbearing account in the amount of 930,000 Japanese Yen and was valued at $8,593 at June 30, 2022.
21
Original appropriation,
552 $ 43,752,309 Add: Economic Development Opportunity Funding 1,427,000 Central Appropriations Adjustments 762,270 Revenue
Chapter
6. CAPITAL ASSETS
Capital asset activity for the fiscal year ended June 30, 2022, was as follows:
*Capital Asset beginning balances as of July 1, 2021, have been restated to include right to use intangible lease assets pursuant to GASB 87. In 2022, the Partnership recognized the value of office space leased under longterm contracts per implementation of GASB 87. These assets were previously accounted for as operating leases and not recognized on the financial statements.
22
Assets Being Depreciated or Amortized Balance July 1, 2021* Increases Decreases Balance June 30, 2022 Leasehold improvements, furniture and equipment $ 4,981,640 $ 43,361 $ (121,444) $ 4,903,557 Right to use intangible leased assets 20,168,58020,168,580 25,150,220 43,361 (121,444) 25,072,137 Less accumulated depreciation and amortization for: Furniture and equipment 1,837,522 585,154 (84,704) 2,337,972 Right to use intangible leased assets - 2,213,428 - 2,213,428 Total accumulated depreciation and amortization 1,837,522 2,798,582 (84,704) 4,551,400 Capital assets, net of accumulated depreciation and amortization $ 23,312,698 $(2,755,221) $ (36,740) $ 20,520,737
Capital
7. LONG-TERM LEASE LIABILITY
As a result of adopting GASB 87, the Partnership recognized lease liabilities of $20,168,580 with a corresponding right to use intangible lease asset for the same amount. The Partnership is committed under leases for various office space through October 2030. A summary of changes in long-term lease liability for the fiscal year ended June 30, 2022 follows:
Future principal and interest payments related to the long-term lease liability as of June 30, 2022 are as follows:
8 FINANCED PURCHASE OBLIGATION
The Partnership has entered into an equipment lease agreement that is accounted for as a financed purchase obligation. The agreement has a seven year term and ownership of the assets will pass to the Partnership at the end of the lease term. A summary of changes in finance purchase obligation for the fiscal year ended June 30, 2022 follows:
23
Balance Balance July 1, 2021 Increases Decreases June 30, 2022 $ 20,168,580 $ - $ 1,571,365 $ 18,597,215 Due Within One Year (1,881,654) Due in More Than One Year $ 16,715,561
Years Ending June 30 Principal Interest Total 2023 $ 1,881,654 $ 532,253 $ 2,413,907 2024 1,920,976 475,183 2,396,159 2025 2,021,649 416,262 2,437,911 2026 2,132,572 354,097 2,486,669 2027 2,247,858 288,545 2,536,403 2028-2032 8,392,506 442,117 8,834,623 Total $ 18,597,215 $ 2,508,457 $ 21,105,672
Balance Balance July 1, 2021 Increases Decreases June 30, 2022 $ 1,049,115 $ - $ 204,201 $ 844,914 Due Within One Year (135,594) Due in More Than One Year $ 709,320
Gross minimum lease payments, as well as the present value of the net minimum lease payments as of June 30, 2022, are as follows:
Total gross minimum lease payments 890,147
Less: amount representing interest (45,233)
Present value of minimum lease payments $ 844,914
At June 30, 2022, assets purchased under the financed purchase agreement were included in depreciable capital assets as follows:
Gross capital assets $ 977,278
Less: accumulated depreciation (244,320)
Net book value $ 732,958
24
Year Ending Lease June 30 Payments 2023 $ 148,358 2024 148,358 2025 148,357 2026 148,358 2027 148,358 2028-2032 148,358
9. COMPENSATED ABSENCES
Compensated absences activity for the fiscal year ended June 30, 2022, was as follows:
10 PENSION PLAN
General Information about the Pension Plan
Plan Description
All Partnership full-time, salaried permanent employees are automatically covered by the VRS State Employee Retirement Plan upon employment. This plan is administered by the Virginia Retirement System (the System) along with plans for other employer groups in the Commonwealth of Virginia. Members earn one month of service credit for each month they are employed and for which they and their employer pay contributions to VRS. Members are eligible to purchase prior service, based on specific criteria as defined in the Code of Virginia, as amended. Eligible prior service that may be purchased includes prior public service, active military service, certain periods of leave, and previously refunded service.
The System administers three different benefit structures for covered employees in the VRS State Employee Retirement Plan – Plan 1, Plan 2, and Hybrid Each of these benefit structures has different eligibility criteria. The specific information for each plan and the eligibility for covered groups within each plan are set out in the table below:
25
Balance Balance July 1, 2021 Increases Decreases June 30, 2022 $ 1,318,553 $ 972,704 $ 1,018,815 $ 1,272,442 Due Within One Year (943,479) Due in More Than One Year $ 328,963
RETIREMENT PLAN PROVISIONS BY PLAN STRUCTURE
PLAN 1 PLAN 2 HYBRID RETIREMENT PLAN
About Plan 1 Plan 1 is a defined benefit plan. The retirement benefit is based on a member’s age, service credit and average final compensation at retirement using a formula.
About Plan 2 Same as Plan 1.
About the Hybrid Retirement Plan
The Hybrid Retirement Plan combines the features of a defined benefit plan and a defined contribution plan.
• The defined benefit is based on a member’s age, service credit and average final compensation at retirement using a formula.
• The benefit from the defined contribution component of the plan depends on the member and employer contributions made to the plan and the investment performance of those contributions.
• In addition to the monthly benefit payment payable from the defined benefit plan at retirement, a member may start receiving distributions from the balance in the defined contribution account, reflecting the contributions, investment gains or losses, and any required fees.
Eligible Members
Employees are in Plan 1 if their membership date is before July 1, 2010, and they were vested as of January 1, 2013, and they have not taken a refund.
Eligible Members
Employees are in Plan 2 if their membership date is from July 1, 2010, to December 31, 2013, and they have not taken a refund, or their membership date is prior to July 1, 2010, and they were not vested as of January 1, 2013.
Eligible Members
Employees are in the Hybrid Retirement Plan if their membership date is on or after January 1, 2014. This includes:
• Full-time permanent, salaried state employees.*
26
RETIREMENT PLAN PROVISIONS BY PLAN STRUCTURE
PLAN 1 PLAN 2
HYBRID RETIREMENT PLAN
Eligible Members
• Members in Plan 1 or Plan 2 who elected to opt into the plan during the election window held January 1-April 30, 2014; the plan’s effective date for opt-in members was July 1, 2014
*Non-Eligible Members
Some employees are not eligible to participate in the Hybrid Retirement Plan. They include:
• Members of the Virginia Law Officers’ Retirement System (VaLORS)
Hybrid Opt-In Election
VRS Plan 1 members were allowed to make an irrevocable decision to opt into the Hybrid Retirement Plan during a special election window held January 1 through April 30, 2014.
The Hybrid Retirement Plan’s effective date for eligible Plan 1 members who opted in was July 1, 2014.
If eligible deferred members returned to work during the election window, they were also eligible to opt into the Hybrid Retirement Plan.
Hybrid Opt-In Election
Same as Plan 1.
Eligible Members
Those employees eligible for an optional retirement plan (ORP) must elect the ORP plan or the Hybrid Retirement Plan. If these members have prior service under Plan 1 or Plan 2, they are not eligible to elect the Hybrid Retirement Plan and must select Plan 1 or Plan (as applicable) or ORP.
27
RETIREMENT PLAN PROVISIONS BY PLAN STRUCTURE
PLAN 1 PLAN 2
Retirement Contributions
State employees, excluding state elected officials, and optional retirement plan participants, contribute 5% of their compensation each month to their member contribution account through a pre-tax salary reduction. Member contributions are tax-deferred until they are withdrawn as part of a retirement benefit or as a refund. The employer makes a separate actuarially determined contribution to VRS for all covered employees. VRS invests both member and employer contributions to provide funding for the future benefit payments
Service Credit
Service credit includes active service. Members earn service credit for each month they are employed in a covered position. It also may include credit for prior service the member has purchased or additional service credit the member was granted. A member’s total service credit is one of the factors used to determine their eligibility for retirement and to calculate their retirement benefit. It also may count toward eligibility for the health insurance credit in retirement, if the employer offers the health insurance credit.
Retirement Contributions
Same as Plan 1.
HYBRID RETIREMENT PLAN
Retirement Contributions
A member’s retirement benefit is funded through mandatory and voluntary contributions made by the member and the employer to both the defined benefit and the defined contribution components of the plan. Mandatory contributions are based on a percentage of the employee’s creditable compensation and are required from both the member and the employer. Additionally, members may choose to make voluntary contributions to the defined contribution component of the plan, and the employer is required to match those voluntary contributions according to specified percentages.
Service Credit
Same as Plan 1.
Service Credit Defined
Benefit Component: Under the defined benefit component of the plan, service credit includes active service. Members earn service credit for each month they are employed in a covered position. It also may include credit for prior service the member has purchased or additional service credit the member was granted.
28
RETIREMENT PLAN PROVISIONS BY PLAN STRUCTURE
PLAN 1 PLAN 2
HYBRID RETIREMENT PLAN
Service Credit
Defined Benefit Component: A member’s total service credit is one of the factors used to determine their eligibility for retirement and to calculate their retirement benefit. It also may count toward eligibility for the health insurance credit in retirement, if the employer offers the health insurance credit.
Defined Contributions
Component:
Under the defined contribution component, service credit is used to determine vesting for the employer contribution portion of the plan.
Vesting
Vesting is the minimum length of service a member needs to qualify for a future retirement benefit. Members become vested when they have at least five years (60 months) of service credit Vesting means members are eligible to qualify for retirement if they meet the age and service requirements for their plan.
Members also must be vested to receive a full refund of their member contribution account balance if they leave employment and request a refund.
Vesting
Same as Plan 1.
Vesting
Defined Benefit Component: Defined benefit vesting is the minimum length of service a member needs to qualify for a future retirement benefit. Members are vested under the defined benefit component of the Hybrid Retirement Plan when they reach five years (60 months) of service credit. Plan 1 or Plan 2 members with at least five years (60 months) of service credit who opted into the Hybrid Retirement Plan remain vested in the defined benefit component.
29
RETIREMENT PLAN PROVISIONS BY PLAN STRUCTURE
Vesting
PLAN 1 PLAN 2
Members are always 100% vested in the contributions that they make.
HYBRID RETIREMENT PLAN
Vesting Defined Contributions
Component:
Defined contribution vesting refers to the minimum length of service a member needs to be eligible to withdraw the employer contributions from the defined contribution component of the plan.
Members are always 100% vested in the contributions that they make.
Upon retirement or leaving covered employment, a member is eligible to withdraw a percentage of employer contributions to the defined contribution component of the plan, based on service.
• After two years, a member is 50% vested and may withdraw 50% of employer contributions.
• After three years, a member is 75% vested and may withdraw 75% of employer contributions.
• After four or more years, a member is 100% vested and may withdraw 100% of employer contributions.
Distributions not required, except as governed by law.
30
RETIREMENT PLAN PROVISIONS BY PLAN STRUCTURE
PLAN 1 PLAN 2
Calculating the Benefit
The basic benefit is determined using the average final compensation, service credit and plan multiplier. An early retirement reduction is applied to this amount if the member is retiring with a reduced benefit. In cases where the member has elected an optional form of retirement payment, an option factor specific to the option chosen is then applied.
Average Final Compensation
A member’s average final compensation is the average of their 36 consecutive months of highest compensation as a covered employee
Service Retirement Multiplier
The retirement multiplier is a factor used in the formula to determine a final retirement benefit. The retirement multiplier for non-hazardous duty members is 1.70%
Calculating the Benefit
See definition under Plan 1.
HYBRID RETIREMENT PLAN
Calculating the Benefit
Defined Benefit Component:
See definition under Plan 1.
Defined Contribution
Component:
The benefit is based on contributions made by the member and any matching contributions made by the employer, plus net investment earnings on those contributions.
Average Final Compensation
A member’s average final compensation is the average of their 60 consecutive months of highest compensation as a covered employee.
Service Retirement Multiplier
Same as Plan 1 for service earned, purchased or granted prior to January 1, 2013. For non-hazardous duty members the retirement multiplier is 1.65% for service credit earned, purchased, or granted on or after January 1, 2013.
Average Final Compensation
Same as Plan 2. It is used in the retirement formula for the defined benefit component of the plan.
Service Retirement Multiplier
Defined Benefit Component: The retirement multiplier for the defined benefit component is 1.00%.
For members who opted into the Hybrid Retirement Plan from Plan 1 or Plan 2, the applicable multipliers for those plans will be used to calculate the retirement benefit for service credited in those plans.
Defined Contribution
Component: Not applicable.
31
RETIREMENT PLAN PROVISIONS BY PLAN STRUCTURE
PLAN 1 PLAN 2
Normal Retirement Age Age 65.
Normal Retirement Age Normal Social Security retirement age.
HYBRID RETIREMENT PLAN
Normal Retirement Age
Defined Benefit Component: Same as Plan 2.
Defined Contribution
Component:
Members are eligible to receive distributions upon leaving employment, subject to restrictions.
Earliest Unreduced Retirement Eligibility
Age 65 with at least five years (60 months) of service credit or at age 50 with at least 30 years of service credit
Earliest Unreduced Retirement Eligibility
Normal Social Security retirement age with at least five years (60 months) of service credit or when their age and service equal 90.
Earliest Unreduced Retirement Eligibility
Defined Benefit Component: Same as Plan 2.
Defined Contribution
Component:
Members are eligible to receive distributions upon leaving employment, subject to restrictions.
Earliest Reduced Retirement Eligibility
Age 55 with at least five years (60 months) of service credit or age 50 with at least 10 years of creditable service.
Earliest Reduced Retirement Eligibility
Age 60 with at least five years (60 months) of service credit
Earliest Reduced Retirement Eligibility
Defined Benefit Component: Same as Plan 2.
Defined Contribution
Component:
Members are eligible to receive distributions upon leaving employment, subject to restrictions.
32
RETIREMENT PLAN PROVISIONS BY PLAN STRUCTURE
PLAN 1 PLAN 2
Cost-of-Living Adjustment (COLA) in Retirement
The Cost-of-Living Adjustment (COLA) matches the first 3% increase in the Consumer Price Index for all Urban Consumers (CPI-U) and half of any additional increase (up to 4%) up to a maximum COLA of 5%.
Eligibility:
For members who retire with an unreduced benefit or with a reduced benefit with at least 20 years of service credit, the COLA will go into effect on July 1 after one full calendar year from the retirement date.
For members who retire with a reduced benefit and who have less than 20 years of service credit, the COLA will go into effect on July 1 after one calendar year following the unreduced retirement eligibility date.
Exceptions to COLA Effective Dates:
The COLA is effective July 1 following one full calendar year (January 1 to December 31) under any of the following circumstances:
• The member is within five years of qualifying for an unreduced retirement benefit as of January 1, 2013.
• The member retires on disability.
Cost-of-Living Adjustment (COLA) in Retirement
The Cost-of-Living Adjustment (COLA) matches the first 2% increase in the CPI-U and half of any additional increase (up to 2%), for a maximum COLA of 3%.
Eligibility: Same as Plan 1.
HYBRID RETIREMENT PLAN
Cost-of-Living Adjustment (COLA) in Retirement
Defined Benefit Component: Same as Plan 2.
Defined Contribution Component: Not applicable.
Eligibility: Same as Plan 1 and Plan 2.
Exceptions to COLA Effective Dates: Same as Plan 1.
Exceptions to COLA Effective Dates: Same as Plan 1 and Plan 2.
33
RETIREMENT PLAN PROVISIONS BY PLAN STRUCTURE
PLAN 1 PLAN 2
Cost-of-Living Adjustment (COLA) in Retirement
Exceptions to COLA Effective Dates:
• The member retires directly from short-term or long-term disability.
• The member is involuntarily separated from employment for causes other than job performance or misconduct and is eligible to retire under the Workforce Transition Act or the Transitional Benefits Program.
• The member dies in service and the member’s survivor or beneficiary is eligible for a monthly death-in-service benefit.
The COLA will go into effect on July 1 following one full calendar year (January 1 to December 31) from the date the monthly benefit begins.
Disability Coverage
For members who are eligible to be considered for disability retirement and retire on disability, the retirement multiplier is 1.70% on all service, regardless of when it was earned, purchased or granted.
Disability Coverage
For members who are eligible to be considered for disability retirement and retire on disability, the retirement multiplier is 1.65% on all service, regardless of when it was earned, purchased or granted.
HYBRID RETIREMENT PLAN
Disability Coverage
State employees (including Plan 1 and Plan 2 opt-ins) participating in the Hybrid Retirement Plan are covered under the Virginia Sickness and Disability Program (VSDP), and are not eligible for disability retirement.
34
RETIREMENT PLAN PROVISIONS BY PLAN STRUCTURE
PLAN 1 PLAN 2
Disability Coverage
Most state employees are covered under the Virginia Sickness and Disability Program (VSDP), and are not eligible for disability retirement.
VSDP members are subject to a one-year waiting period before becoming eligible for non-workrelated disability benefits.
Disability Coverage
Most state employees are covered under the Virginia Sickness and Disability Program (VSDP), and are not eligible for disability retirement.
VSDP members are subject to a one-year waiting period before becoming eligible for non-workrelated disability benefits.
HYBRID RETIREMENT PLAN
Disability Coverage
State employees (including Plan 1 and Plan 2 opt-ins) participating in the Hybrid Retirement Plan are covered under the Virginia Sickness and Disability Program (VSDP), and are not eligible for disability retirement.
Hybrid members (including Plan 1 and Plan 2 opt-ins) covered under VSDP are subject to a oneyear waiting period before becoming eligible for non-workrelated disability benefits.
Purchase of Prior Service
Members may be eligible to purchase service from previous public employment, active duty military service, an eligible period of leave or VRS refunded service as service credit in their Plan. Prior service credit counts toward vesting, eligibility for retirement and the health insurance credit. Only active members are eligible to purchase prior service. Members also may be eligible to purchase periods of leave without pay.
Purchase of Prior Service
Same as Plan 1.
Purchase of Prior Service
Defined Benefit Component: Same as Plan 1, with the following exception:
• Hybrid Retirement Plan members are ineligible for ported service.
Defined Contribution
Component: Not applicable.
35
Contributions
The contribution requirement for active employees is governed by §51.1 -145 of the Code of Virginia, as amended, but may be impacted as a result of funding provided to the Partnership by the Virginia General Assembly. Employees are required to contribute 5.00% of their compensation toward their retirement. The Partnership’s contractually required contribution rate for the year ended June 30, 20 22, was 14.46% of covered employee compensation for employees in the VRS State Employee Retirement Plan . This rate was based on an actuarially determined rate from an actuarial valuation as of June 30, 201 9. The actuarially determined rate, when combined with employee contributions, was expected to finance the costs of benefits earned by employees during the year, with an additional amount to finance any unfunded accrued liability. Contributions from the Partnership to the VRS State Employee Retirement Plan were $2,075,923 and $1,762,999 for the years ended June 30, 2022 and June 30, 2021, respectively.
Pension Liabilities, Pension Expense, and Deferred Outflows of Resources and Deferred Inflows of Resources Related to Pensions
At June 30, 2022, the Partnership reported a liability of $9,513,136 for its proportionate share of the VRS State Employee Retirement Plan Net Pension Liability. The Net Pension Liability was measured as of June 30, 2021 and the total pension liability used to calculate the Net Pension Liability was determined by an actuarial valuation performed as of June 30, 2020, and rolled forward to the measurement date of June 30, 2021. The Partnership’s proportion of the Net Pension Liability was based on the Partnership’s actuarially determined employer contributions to the pension plan for the year ended June 30, 2021 relative to the total of the actuarially determined employer contributions for all participating employers. At June 30, 20 21 the Partnership’s proportion of the VRS State Employee Retirement Plan was 0. 26227% as compared to 0.24079% at June 30, 2020
For the year ended June 30, 2022, the Partnership recognized pension expense of $1,371,948 for the VRS State Employee Retirement Plan. Since there was a change in proportionate share between June 30, 20 20 and June 30, 2021, a portion of the pension expense was related to deferred amounts from changes in proportion and differences between employer contributions and the proportionate share of employer contributions.
At June 30, 2022 the Partnership reported deferred outflows of resources and deferred inflows of resources related to pensions from the following sources:
36
Deferred Outflows of Resources Deferred Inflows of Resources Differences between expected and actual experience $ 85,693 $ 546,242 Net difference between projected and actual earnings on pension plan investments - 6,549,181 Change in assumptions 1,093,640Changes in proportion and differences between employer contributions and proportionate share of contributions 1,650,891Employer contribution subsequent to the measurement date 2,075,923Total $ 4,906,147 $ 7,095,423
$2,075,923 reported as deferred outflows of resources related to pensions resulting from the Partnership’s contributions subsequent to the measurement date will be recognized as a reduction of the Net Pension Liability in the Fiscal Year ending June 30, 202 3. Other amounts reported as deferred outflows of resources and deferred inflows of resources related to pensions will be recognized in pension expense in future reporting periods as follows:
Year Ended June 30
FY 2023 $ (238,044)
FY 2024 $ (779,758)
FY 2025 $ (1,247,724)
FY 2026 $ (1,999,673)
FY 2027 $ -
Actuarial Assumptions
The total pension liability for the VRS State Employee Retirement Plan was based on an actuarial valuation as of June 30, 2020, using the Entry Age Normal actuarial cost method and the following assumptions, applied to all periods included in the measurement and rolled forward to the measurement date of June 30, 20 21.
Pre-Retirement:
Pub-2010 Amount Weighted General Employee Rates projected generationally; females set forward 2 years
Post-Retirement:
Pub-2010 Amount Weighted General Healthy Retiree Rates projected generationally; 110% of rates for females
Post-Disablement:
Pub-2010 Amount Weighted General Disabled Rates projected generationally; males and females set forward 3 years
37
Inflation 2.50% Salary increases, including inflation 3.50% – 5.35% Investment rate of return
net of pension plan investment expenses, including inflation Mortality
6.75%,
rates:
Beneficiaries and Survivors: Pub-2010 Amount Weighted General Contingent Annuitant Rates projected generationally; 110% of rates for males and females
Mortality Improvement: Rates projected generationally with Modified MP-2020 Improvement Scale that is 75% of the MP-2020 rates
The actuarial assumptions used in the June 30, 20 20 valuation were based on the results of an actuarial experience study for the period from July 1, 2016 through June 30, 2020, except the change in the discount rate, which was based on VRS Board action effective as of July 1, 2019 . Changes to the actuarial assumptions as a result of the experience study and VRS Board action are as follows:
Mortality Rates (Pre-retirement, post-retirement healthy, and disabled)
Retirement Rates
Withdrawal Rates
Update to PUB2010 public sector mortality tables. For future mortality improvements, replace load with a modified Mortality Improvement Scale MP2020
Adjusted rates to better fit experience for Plan 1; set separate rates based on experience for Plan 2/Hybrid; changed final retirement ages from 75 to 80 for all
Adjusted rates to better fit experience at each year age and service through 9 years of service
The net pension liability (NPL) is calculated separately for each plan and represents that particular plan’s total pension liability determined in accordance with GASB Statement No. 67, less that plan’s fiduciary net position. As of June 30, 2021, NPL amounts for the VRS State Employee Retirement Plan are as follows (amounts expressed in thousands):
38
Disability Rates No change Salary Scale No change Line of Duty Disability No change Discount Rate No change Net Pension Liability
State Employee Retirement Plan Total Pension Liability $ 26,739,647 Plan Fiduciary Net Position 23,112,417 Employers’ Net Pension Liability (Asset) $ 3,627,230 Plan Fiduciary Net Position as a Percentage of the Total Pension Liability 86.44%
The total pension liability is calculated by the System’s actuary, and each plan’s fiduciary net position is reported in the System’s financial statements. The net pension liability is disclosed in accordance with the requirements of GASB Statement No. 67 in the System’s notes to the financial statements and required supplementary information.
Long-Term Expected Rate of Return
The long-term expected rate of return on pension System investments was determined using a log-normal distribution analysis in which best-estimate ranges of expected future real rates of return (expected returns, net of pension System investment expense and inflation) are developed for each major asset class. These ranges are combined to produce the long-term expected rate of return by weighting the expected future real rates of return by the target asset allocation percentage and by adding expected inflation. The target asset allocation and best estimate of arithmetic real rates of return for each major class are summarized in the following table:
* The above allocation provides a one-year expected return of 7.39%. However, one-year returns do not take into account the volatility present in each of the asset classes. In setting the long -term expected return for the system, stochastic projections are employed to model future returns under various economic conditions. These results provide a range of returns over various time periods that ultimately prov ide a median return of 6.94%, including expected inflation of 2.50%.
* On October 10, 2019, the VRS Board elected a long-term rate of 6.75% which is roughly at the 40 th percentile of expected long-term results of the VRS fund asset allocation at that time, providing a median return of 7.11%, including expected inflation of 2.50%.
39
Asset Class (Strategy) Long-Term Target Asset Allocation Arithmetic Long-Term Expected Rate of Return Weighted Average Long-Term Expected Rate of Return* Public Equity 34.00% 5.00% 1.70% Fixed Income 15.00% 0.57% 0.09% Credit Strategies 14.00% 4.49% 0.63% Real Assets 14.00% 4.76% 0.67% Private Equity 14.00% 9.94% 1.39% MAPS – Multi-Asset Public Strategies 6.00% 3.29% 0.20% PIP – Private Investment Partnership 3.00% 6.84% 0.21% Total 100.00% 4.89% Inflation 2.50% Expected arithmetic nominal return * 7.39%
Discount Rate
The discount rate used to measure the total pension liability was 6.75%. The projection of cash flows used to determine the discount rate assumed that System member contributions will be made per the VRS Statutes and the employer contributions will be made in accordance with the VRS funding policy at rates equal to the difference between actuarially determined contribution rates adopted by the VRS Board of Trustees and the member rate. Through the fiscal year ending June 30, 2021, the rate contributed by the Partnership for the VRS State Employee Retirement Plan will be subject to the portion of the VRS Boardcertified rates that are funded by the Virginia General Assembly which was 100% of the actuarially determined contribution rate. From July 1, 2021 on, all agencies are assumed to continue to contribute 100% of the actuarially determined contribution rates. Based on those assumptions, the pension plan’s fiduciary net position was projected to be available to make all projected future be nefit payments of current active and inactive employees. Therefore, the long-term expected rate of return was applied to all periods of projected benefit payments to determine the total pension liability.
Sensitivity of the Partnership’s Proportionate Share of the Net Pension Liability to Changes in the Discount Rate
The following presents the Partnership’s proportionate share of the VRS State Employee Retirement Plan net pension liability using the discount rate of 6.75%, as well as what the Partnership’s proportionate share of the net pension liability would be if it were calculated using a discount rate that is one percentage point lower (5.75%) or one percentage point higher (7.75%) than the current rate:
Pension Plan Fiduciary Net Position
Detailed information about the VRS State Employee Retirement Plan’s Fiduciary Net Position is available in the separately issued VRS 2021 Annual Report. A copy of the 2021 VRS Annual Report may be downloaded from the VRS website at: https://www.varetire.org/pdf/publications/2021-annual-report.pdf, or by writing to the System’s Chief Financial Officer at P.O. Box 2500, Richmond, VA 23218 -2500.
11. STATE EMPLOYEE HEALTH INSURANCE CREDIT PROGRAM
General Information about the State Employee Health Insurance Credit Program
Plan Description
All Partnership full-time, salaried permanent employees are automatically covered by the VRS State Employee Health Insurance Credit Program. This plan is administered by the Virginia Retirement System (the System), along with pension and other OPEB plans, for public employer groups in the Commonwealth of Virginia. Members earn one month of service credit toward the benefit for each month they are employed and for which the Partnership pays contributions to VRS. The health insurance credit is a tax -free
40
1.00% Decrease 5.75% Current Discount Rate 6.75% 1.00% Increase 7.75% 7.75% Partnership’s proportionate share of the VRS State Employee Retirement Plan Net Pension Liability $ 17,819,328 $ 9,513,136 $ 2,552,966
reimbursement in an amount set by the General Assembly for each year of service credit against qualified health insurance premiums retirees pay for single coverage, excluding any portion covering the spouse or dependents. The credit cannot exceed the amount of the premiums and ends upon the retiree’s death.
The specific information about the State Health Insurance Credit Program OPEB, including eligibility, coverage and benefits is set out in the table below:
STATE EMPLOYEE HEALTH INSURANCE CREDIT PROGRAM (HIC) PLAN PROVISIONS
Eligible Employees
The State Employee Retiree Health Insurance Credit Program was established January 1, 1990 for retired state employees covered under VRS, SPORS, VaLORS and JRS who retire with at least 15 years of service credit.
Eligible employees are enrolled automatically upon employment. They include:
• Full-time and part-time permanent salaried state employees covered under VRS, SPORS, VaLORS and JRS.
Benefit Amounts
The State Employee Retiree Health Insurance Credit Program provides the following benefits for eligible employees:
• At Retirement – For state employees who retire, the monthly benefit is $4.00 per year of service per month with no cap on the benefit amount.
• Disability Retirement – For state employees, other than state police officers, who retire on disability or go on long-term disability under the Virginia Sickness and Disability Program (VSDP), the monthly benefit is $120.00 or $4.00 per year of service, whichever is higher.
For state police officer employees with a non-work-related disability who retire on disability or go on long-term disability under the Virginia Sickness and Disability Program (VSDP) the monthly benefit is $120.00 or $4.00 per year of service, whichever is higher.
For state police officers with a work-related disability, there is no benefit provided under the State Employee Retiree Health Insurance Credit Program if the premiums are being paid under the Virginia Line of Duty Act. However, they may receive the credit for premiums paid for other qualified health plans.
Health Insurance Credit Program Notes:
• The monthly Health Insurance Credit benefit cannot exceed the individual’s premium amount.
• Employees who retire after being on long-term disability under VSDP must have at least 15 years of service credit to qualify for the Health Insurance Credit as a retiree.
Contributions
The contribution requirement for active employees is governed by §51.1-1400(D) of the Code of Virginia, as amended, but may be impacted as a result of funding provided to the Partnership by the Virginia General Assembly. The Partnership’s contractually required employer contribution rate for the year ended June 30, 2022 was 1.12% of covered employee compensation for employees in the VRS State Employee Health
41
Insurance Credit Program. This rate was based on an actuarially determined rate from an actuarial valuation as of June 30, 2019. The actuarially determined rate was expected to finance the costs of benefits earned by employees during the year, with an additional amount to finance any unfunded accrued liability. Contributions from the Partnership to the VRS State Employee Health Insurance Credit Program were $161,461 and $137,731 for the years ended June 30, 2022 and June 30, 2021, respectively.
In June 2021, the Commonwealth made a special contribution of approximately $38.7 million which was applied to the Health Insurance Credit Plan for state employees. This special payment was authorized by a budget amendment included in Chapter 552 of the 2021 Appropriation Act.
State Employee Health Insurance Credit Program OPEB Liabilities, State Employee Health Insurance Credit Program OPEB Expense, and Deferred Outflows of Resources and Deferred Inflows of Resources Related to State Employee Health Insurance Credit Program OPEB
At June 30, 2022, the Partnership reported a liability of $1,441,208 for its proportionate share of the VRS State Employee Health Insurance Credit Program Net OPEB Liability. The Net VRS State Employee Health Insurance Credit Program OPEB Liability was measured as of June 30, 20 21 and the total VRS State Employee Health Insurance Credit Program OPEB Liability used to calculate the Net VRS State Employee Health Insurance Credit Program OPEB Liability was determined by an actuarial valuation performed as of June 30, 2020, and rolled forward to the measurement date of June 30, 2021. The Partnership’s proportion of the Net VRS State Employee Health Insurance Credit Program OPEB Liability was based on the Partnership’s actuarially determined employer contributions to the VRS State Employee Health Insurance Credit Program OPEB plan for the year ended June 30, 2021 relative to the total of the actuarially determined employer contributions for all participating employers. At June 30, 20 21, the Partnership’s proportion of the VRS State Employee Health Insurance Credit Program was 0.17065% as compared to 0.15667% at June 30, 2020
For the year ended June 30, 2022, the Partnership recognized VRS State Employee Health Insurance Credit Program OPEB expense of $197,179. Since there was a change in proportionate share between measurement dates, a portion of the VRS State Employee Health Insurance Credit Program Net OPEB expense was related to deferred amounts from changes in proportion.
At June 30, 2022, the Partnership reported deferred outflows of resources and deferred inflows of resources related to the VRS State Employee Health Insurance Credit Program OPEB from the following sources:
42
Deferred Outflows of Resources Deferred Inflows of Resources Differences between expected and actual experience $ 446 $ 46,930 Net difference between projected and actual earnings on State HIC OPEB program investments - 27,354 Change in assumptions 37,325 4,066 Changes in proportionate share 269,881Employer contributions subsequent to the measurement date 161,461Total $ 469,113 $ 78,350
$161,461 reported as deferred outflows of resources related to the State Employee HIC OPEB resulting from the Partnership’s contributions subsequent to the measurement date will be recognized as a reduction of the Net State Employee HIC OPEB Liability in the Fiscal Year ending June 30, 20 23. Other amounts reported as deferred outflows of resources and deferred inflows of resources related to the State Employee HIC OPEB will be recognized in the State Employee HIC OPEB expense in future report ing periods as follows:
Year Ended June 30
FY 2023 $ 63,331
FY 2024 $ 64,781
FY 2025 $ 45,866
FY 2026 $ 35,752
FY 2027 $ 19,001
Thereafter $ 571
Actuarial Assumptions
The total State Employee HIC OPEB liability for the VRS State Employee Health Insurance Credit Program was based on an actuarial valuation as of June 30, 2020, using the Entry Age Normal actuarial cost method and the following assumptions, applied to all periods included in the measurement and rolled forward to the measurement date of June 30, 2021
6.75%, net of plan investment expenses, including inflation
Mortality rates – General State Employees
Pre-Retirement:
Pub-2010 Amount Weighted General Employee Rates projected generationally; females set forward 2 years
Post-Retirement:
Pub-2010 Amount Weighted General Healthy Retiree Rates projected generationally; 110% of rates for females
43
Inflation 2.50% Salary increases, including inflationGeneral state employees 3.50% – 5.35% SPORS employees 3.50% – 4.75% VaLORS employees 3.50% – 4.75% JRS employees 4.50%
Investment rate of return
Post-Disablement:
Pub-2010 Amount Weighted General Disabled Rates projected generationally; males and females set forward 3 years
Beneficiaries and Survivors:
Pub-2010 Amount Weighted General Contingent Annuitant Rates projected generationally; 110% of rates for males and females
Mortality Improvement Scale: Rates projected generationally with Modified MP-2020 Improvement Scale that is 75% of the MP-2020 rates
The actuarial assumptions used in the June 30, 20 20 valuation were based on the results of an actuarial experience study for the period from July 1, 2016 through June 30, 2020, except the change in the discount rate, which was based on VRS Board action effective as of July 1, 2019 . Changes to the actuarial assumptions as a result of the experience study and VRS Board action are as follows:
Mortality Rates (Pre-retirement, post-retirement healthy, and disabled)
Retirement Rates
Withdrawal Rates
Mortality rates – SPORS Employees
Pre-Retirement:
Update to PUB2010 public sector mortality tables. For future mortality improvements, replace load with a modified Mortality Improvement Scale MP2020
Adjusted rates to better fit experience for Plan 1; set separate rates based on experience for Plan2/Hybrid; changed final retirement age from 75 to 80 for all
Adjusted rates to better fit experience at each year age and service through 9 years of service
Pub-2010 Amount Weighted Safety Employee Rates projected generationally; 95% of rates for males; 105% of rates for females set forward 2 years
Post-Retirement:
Pub-2010 Amount Weighted Safety Healthy Retiree Rates projected generationally; 110% of rates for males; 105% of rates for females set forward 3 years
Post-Disablement:
Pub-2010 Amount Weighted General Disabled Rates projected generationally; 95% of rates for males set back 3 years; 90% of rates for females set back 3 years
44
Disability Rates No change Salary Scale No change Line of Duty Disability No change Discount Rate No change
Beneficiaries and Survivors:
Pub-2010 Amount Weighted Safety Contingent Annuitant Rates projected generationally; 110% of rates for males and females set forward 2 years
Mortality Improvement Scale: Rates projected generationally with Modified MP-2020 Improvement Scale that is 75% of the MP-2020 rates
The actuarial assumptions used in the June 30, 20 20 valuation were based on the results of an actuarial experience study for the period from July 1, 2016 through June 30, 2020, except the change in the discount rate, which was based on VRS Board action effective as of July 1, 2019 . Changes to the actuarial assumptions as a result of the experience study and VRS Board action are as follows:
Mortality Rates (Pre-retirement, post-retirement healthy, and disabled)
Retirement Rates
Withdrawal Rates
Mortality rates – VaLORS Employees
Pre-Retirement:
Update to PUB2010 public sector mortality tables. For future mortality improvements, replace load with a modified Mortality Improvement Scale MP2020
Increased rates for ages 55 to 61, 63, and 64 with 26 or more years of service; changed final retirement age from 65 to 70
Decreased rate for 0 years of service and increased rates for 1 to 6 years of service
Pub-2010 Amount Weighted Safety Employee Rates projected generationally; 95% of rates for males; 105% of rates for females set forward 2 years
Post-Retirement:
Pub-2010 Amount Weighted Safety Healthy Retiree Rates projected generationally; 110% of rates for males; 105% of rates for females set forward 3 years
Post-Disablement:
Pub-2010 Amount Weighted General Disabled Rates projected generationally; 95% of rates for males set back 3 years; 90% of rates for females set back 3 years
Beneficiaries and Survivors:
Pub-2010 Amount Weighted Safety Contingent Annuitant Rates projected generationally; 110% of rates for males and females set forward 2 years
45
Rates No change Salary Scale No change Line of Duty Disability No change Discount Rate No change
Disability
Mortality Improvement Scale: Rates projected generationally with Modified MP-2020 Improvement Scale that is 75% of the MP-2020 rates
The actuarial assumptions used in the June 30, 20 20 valuation were based on the results of an actuarial experience study for the period from July 1, 2016 through June 30, 2020, except the change in the discount rate, which was based on VRS Board action effective as of July 1, 2019. Changes to the actuarial assumptions as a result of the experience study and VRS Board actions are as follows:
Mortality Rates (Pre-retirement, post-retirement healthy, and disabled)
Retirement Rates
Withdrawal Rates
Update to PUB2010 public sector mortality tables. For future mortality improvements, replace load with a modified Mortality Improvement Scale MP2020
Increased rates at some younger ages, decreased at age 62, and changed final retirement age from 65 to 70
Adjusted rates to better fit experience at each year age and service through 9 years of service
Pre-Retirement:
Pub-2010 Amount Weighted General Employee Rates projected generationally; males set forward 2 years
Post-Retirement:
Pub-2010 Amount Weighted General Healthy Retiree Rates projected generationally; 95% of rates for males and females set back 2 years
Post-Disablement:
Pub-2010 Amount Weighted General Disabled Rated projected generationally
Beneficiaries and Survivors:
Pub-2010 Amount Weighted Safety Contingent Annuitant Rates projected generationally
Mortality Improvement Scale: Rates projected generationally with Modified MP-2020 Improvement Scale that is 75% of the MP-2020 rates
The actuarial assumptions used in the June 30, 20 20 valuation were based on the results of an actuarial experience study for the period from July 1, 2016 through June 30, 2020, except the change in the discount rate, which was based on VRS Board action effective as of July 1, 2019 . Changes to the actuarial assumptions as a result of the experience study and VRS Board action are as follows:
46
Disability Rates No change Salary Scale No change Line of Duty Disability No change Discount Rate No change
Mortality rates – JRS Employees
Mortality Rates (Pre-retirement, post-retirement healthy, and disabled)
Review separately from State employees because exhibit fewer deaths. Update to PUB2010 public sector mortality tables. For future mortality improvements, replace load with a modified Mortality Improvement Scale MP-2020
Net State Employee HIC OPEB Liability
The net OPEB liability (NOL) for the State Employee Health Insurance Credit Program represents the program’s total OPEB liability determined in accordance with GASB Statement No. 74, less the associated fiduciary net position. As of June 30, 2021, NOL amounts for the VRS State Employee Health Insurance Credit Program are as follows (amounts expressed in thousands):
The total State Employee HIC OPEB liability is calculated by the System’s actuary, and the plan’s fiduciary net position is reported in the System’s financial statements. The net State Employee HIC OPEB liability is disclosed in accordance with the requirements of GASB Statement No. 74 in the System’s notes to the financial statements and required supplementary information.
Long-Term Expected Rate of Return
The long-term expected rate of return on VRS System investments was determined using a log-normal distribution analysis in which best-estimate ranges of expected future real rates of return (expected returns, net of VRS System investment expense and inflation) are developed for each major asset class. These ranges are combined to produce the long-term expected rate of return by weighting the expected future real rates of return by the target asset allocation percentage and by adding expected inflation. The target asset allocation and best estimate of arithmetic real rates of return for each major class are summarized in the following table:
47
Retirement Rates
rates
Withdrawal Rates No change Disability Rates No change Salary Scale Reduce increases across all ages by 0.50% Discount Rate No change
Decreased
for ages 60-66 and 70-72
State Employee HIC OPEB Plan Total State Employee HIC OPEB Liability $1,052,400 Plan Fiduciary Net Position 207,860 State Employee Net HIC OPEB Liability (Asset) $ 844,540 Plan Fiduciary Net Position as a Percentage of the Total State Employee HIC OPEB Liability 19.75%
* The above allocation provides a one-year return of 7.39%. However, one-year returns do not take into account the volatility present in each of the asset classes. In setting the long -term expected return for the System, stochastic projections are employed to model future returns under various economic conditions. These results provide a range of returns over various time periods that ultimately prov ide a median return of 6.94%, including expected inflation of 2.50%.
On October 10, 2019, the VRS Board elected a long-term rate of 6.75% which is roughly at the 40 th percentile of expected long-term results of the VRS fund asset allocation at that time, providing a median return of 7.11%, including expected inflation of 2.50%.
Discount Rate
The discount rate used to measure the total State Employee HIC OPEB was 6.75%. The projection of cash flows used to determine the discount rate assumed that employer contributions will be made in accordance with the VRS funding policy at rates equal to the actuarially determined contribution rates adopted by the VRS Board of Trustees. Through the fiscal year ending June 30, 2021, the rate contributed by the Partnership for the VRS State Employee Health Insurance Credit Program will be subject to the portion of the VRS Board-certified rates that are funded by the Virginia General Assembly, which was 100% of the actuarially determined contribution rate. From July 1, 2021 on, all agencies are assumed to continue to contribute 100% of the actuarially determined contribution rates. Based on th ose assumptions, the State Employee HIC OPEB plan’s fiduciary net position was projected to be available to make all projected future benefit payments of current active and inactive employees. Therefore , the long-term expected rate of return was applied to all periods of projected benefit paymen ts to determine the total State Employee HIC OPEB liability.
Sensitivity of the Partnership’s Proportionate Share of the State Employee HIC Net OPEB Liability to Changes in the Discount Rate
The following presents the Partnership’s proportionate share of the VRS State Employee Health Insurance Credit Program net NIC OPEB liability using the discount rate of 6.75%, as well as what the Partnership’s
48
Long-Term Target Asset Allocation Arithmetic Long-Term Expected Rate of Return Weighted Average Long-Term Expected Rate of Return* Public Equity 34.00% 5.00% 1.70% Fixed Income 15.00% 0.57% 0.09% Credit Strategies 14.00% 4.49% 0.63% Real Assets 14.00% 4.76% 0.67% Private Equity 14.00% 9.94% 1.39% MAPS – Multi-Asset Public Strategies 6.00% 3.29% 0.20% PIP – Private Investment Partnership 3.00% 6.84% 0.21% Total 100.00% 4.89% Inflation 2.50% Expected arithmetic nominal return * 7.39%
Asset Class (Strategy)
proportionate share of the net HIC OPEB liability would be if it were calculated using a discount rate that is one percentage point lower (5.75%) or one percentage point higher (7.75%) than the current rate:
State Employee HIC OPEB Fiduciary Net Position
Detailed information about the VRS State Employee Health Insurance Credit Program’s Fiduciary Net Position is available in the separately issued VRS 2021 Annual Comprehensive Financial Report (Annual Report). A copy of the 2021 VRS Annual Report may be downloaded from the VRS website at: https://www.varetire.org/pdf/publications/2021-annual-report.pdf or by writing to the System’s Chief Financial Officer at P.O. Box 2500, Richmond, VA, 23218-2500.
12. GROUP LIFE INSURANCE PROGRAM
General Information about the Group Life Insurance Program Plan Description
All full-time, salaried permanent employees of the state agencies, teachers and employees of participating political subdivisions are automatically covered by the VRS Group Life Insurance Program upon employment. This plan is administered by the Virginia Retirement System (the System), along with pensions and other OPEB plans, for public employer groups in the Commonwealth of Virginia.
In addition to the Basic Group Life Insurance benefit, members are also eligible to elect additional coverage for themselves as well as a spouse or dependent children through the Optional Group Life Insurance Program. For members who elect the optional group life insurance coverage, the insurer bills employers directly for the premiums. Employers deduct these premiums from members’ paychecks and pay the premiums to the insurer. Since this is a separate and fully insured program, it is not included as part of the Group Life Insurance Program OPEB.
The specific information for the Group Life Insurance Program OPEB, including eligibility, coverage and benefits is set out in the table below:
49
1.00% Decrease 5.75% Current Discount Rate 6.75% 1.00% Increase 7.75% Partnership’s proportionate share of the VRS State Employee HIC OPEB Plan Net HIC OPEB Liability $ 1,616,747 $ 1,441,208 $ 1,290,815
GROUP LIFE INSURANCE PROGRAM PLAN PROVISIONS
Eligible Employees
The Group Life Insurance Program was established July 1, 1960, for state employees, teachers and employees of political subdivisions that elect the program, incl uding the following employers that do not participate in VRS for retirement:
• City of Richmond
• City of Portsmouth
• City of Roanoke
• City of Norfolk
• Roanoke City School Board
Basic group life insurance coverage is automatic upon employment. Coverage ends for employees who leave their position before retirement eligibility or who take a refund of their accumulated retirement member contributions and accrued interest.
Benefit Amounts
The benefits payable under the Group Life Insurance Program have several components.
• Natural Death Benefit – The natural death benefit is equal to the employee’s covered compensation rounded to the next highest thousand and then doubled.
• Accidental Death Benefit – The accidental death benefit is double the natural death benefit.
• Other Benefit Provisions – In addition to the basic natural and accidental death benefits, the program provides additional benefits provided under specific circumst ances. These include:
o Accidental dismemberment benefit
o Seatbelt benefit
o Repatriation benefit
o Felonious assault benefit
o Accelerated death benefit option
Reduction in Benefit Amounts
The benefit amounts provided to members covered under the Group Life Insurance Program are subject to a reduction factor. The benefit amount reduces by 25% on January 1 following one calendar year of separation. The benefit amount reduces by an additional 25% on each subsequent January 1 until it reaches 25% of its original value.
Minimum Benefit Amount and Cost-of-Living Adjustment (COLA)
For covered members with at least 30 years of service credit, there is a minimum benefit payable under the Group Life Insurance Program. The minimum benefit was set at $8,000 by statute in 2015. This will be increased annually based on the VRS Plan 2 cost-of-living adjustment calculation. The minimum benefit adjusted for the COLA was $8,722 as of June 30, 2022.
50
Contributions
The contribution requirements for the Group Life Insurance Program are governed by §51.1-506 and §51.1508 of the Code of Virginia, as amended, but may be impacted as a result of funding provided to the Partnership by the Virginia General Assembly. The total rate for the Group Life Insurance Program was 1.34% of covered employee compensation. This was allocated into an employee and an employer component using a 60/40 split. The employee component was 0.80% (1.34% X 60%) and the employer component was 0.54% (1.34% X 40%). Employers may elect to pay all or part of the employee contribution, however the employer must pay all of the employer contribution. The Partnership’s contractually required employer contribution rate for the year ended June 30, 2022 was 0.54% of covered employee compensation. This rate was based on an actuarially determined rate from an actuarial valuation as of June 30, 2019. The actuarially determined rate, when combined with employee contributions, was expected to finance the costs of benefits payable during the year, with an additional amount to finance any unfunded accrued liability. Contributions from the Partnership to the Group Life Insurance Program were $78,144 and $66,431 for the years ended June 30, 2022 and June 30, 2021, respectively.
Group Life Insurance Program OPEB Liabilities, Group Life Insurance Program OPEB Expense, and Deferred Outflows of Resources and Deferred Inflows of Resources Related to the Group Life Insurance Program OPEB
At June 30, 2022, the Partnership reported a liability of $693,673 for its proportionate share of the Net Group Life Insurance Program OPEB Liability. The Net Group Life Insurance Program OPEB Liability was measured as of June 30, 2021 and the total Group Life Insurance Program OPEB Liability used to calculate the Net Group Life Insurance OPEB Liability was determined by an actuarial valuation performed as of June 30, 2020, and rolled forward to the measurement date of June 30, 2021. The Partnership’s proportion of the Net Group Life Insurance Program OPEB Liability was based on the Partnership’s actuarially determined employer contributions to the Group Life Insurance Program for the year ended June 30, 20 21, relative to the total of the actuarially determined employer contributions for all participating employers. At June 30, 2021, the Partnership’s proportion was 0.05958% as compared to 0.05489% at June 30, 2020
For the year ended June 30, 2022, the Partnership recognized Group Life Insurance Program OPEB expense of $70,022. Since there was a change in proportionate share between measurement dates, a portion of the Group Life Insurance Program OPEB expense was related to deferred amounts from changes in proportion.
At June 30, 2022, the Partnership reported deferred outflows of resources and deferred inflows of resources related to the Group Life Insurance Program OPEB from the following sources:
51
Deferred Outflows of Resources Deferred Inflows of Resources
$78,144 reported as deferred outflows of resources related to the Group Life Insurance Program OPEB resulting from the Partnership’s contributions subsequent to the measurement date will be recognized as a reduction of the Net Group Life Insurance Program OPEB Liability in the Fiscal Year ending June 30, 2023. Other amounts reported as deferred outflows of resources and deferred inflows of resources related to the Group Life Insurance Program OPEB will be recognized in the Group Life Insurance Program OPEB expense in future reporting periods as follows:
Year Ended June 30
FY 2023 $ 7,431
FY 2024 $ 14,759
FY 2025 $ 4,655
FY 2026 $ (24,949)
FY 2027 $ 5,303
Thereafter $ -
Actuarial Assumptions
The total Group Life Insurance Program OPEB liability was based on an actuarial valuation as of June 30, 2020, using the Entry Age Normal actuarial cost method and the following assumptions, applied to all periods included in the measurement and rolled forward to the measurement date of June 30, 20 21
52
Differences between expected and actual experience $ 79,116 $ 5,285 Net difference between projected and actual earnings on Group Life Insurance OPEB program investments - 165,565 Change in assumptions 38,242 94,909 Changes in proportion 161,018 5,418 Employer contribution subsequent to the measurement date 78,144Total $ 356,520 $ 271,177
Inflation 2.50% Salary increases, including inflationGeneral state employees 3.50% – 5.35% Teachers 3.50% – 5.95% SPORS employees 3.50% – 4.75% VaLORS employees 3.50% – 4.75% JRS employees 4.50% Locality – General employees 3.50% – 5.35% Locality – Hazardous Duty employees 3.50% – 4.75%
Investment rate of return
6.75%, net of plan investment expenses, including inflation
Mortality rates – General State Employees
Pre-Retirement:
Pub-2010 Amount Weighted General Employee Rates projected generationally; females set forward 2 years
Post-Retirement:
Pub-2010 Amount Weighted General Healthy Retiree Rates projected generational ly; males and females set forward 3 years
Post-Disablement:
Pub-2010 Amount Weighted General Disabled Rates projected generationally; males and females set forward 3 years
Beneficiaries and Survivors:
Pub-2010 Amount Weighted General Contingent Annuitant Rates projected generationally; 110% of rates for males and females
Mortality Improvement Scale: Rates projected generationally with Modified MP-2020 Improvement Scale that is 75% of the MP2020 rates
The actuarial assumptions used in the June 30, 2020 valuation were based on the results of an actuarial experience study for the period from July 1, 2016 through June 30, 2020, except the change in the discount rate, which was based on VRS Board action effective as of July 1, 2019. Changes to the actuarial assumptions as a result of the experience study and VRS Board action are as follows:
Mortality Rates (Pre-retirement, post-retirement healthy, and disabled)
Retirement Rates
Withdrawal Rates
Update to PUB2010 public sector mortality tables. For future mortality improvements, replace load with a modified Mortality Improvement Scale MP2020
Adjusted rates to better fit experience for Plan 1; set separate rates based on experience for Plan 2/Hybrid; changed final retirement age from 75 to 80 for all
Adjusted rates to better fit experience at each year age and service through 9 years of service
53
Disability Rates No change Salary Scale No change Line of Duty Disability No change Discount Rate No change
Mortality rates – Teachers
Pre-Retirement:
Pub-2010 Amount Weighted Teachers Employee Rates projected generationally; 110% of rates for males
Post-Retirement:
Pub-2010 Amount Weighted Teachers Healthy Retiree Rates projected generationally; males set forward 1 year; 105% of rates for females
Post-Disablement:
Pub-2010 Amount Weighted Teachers Disabled Rates projected generationally; 110% of rates for males and females
Beneficiaries and Survivors:
Pub-2010 Amount Weighted Teachers Contingent Annuitant Rates projected generationally
Mortality Improvement Scale: Rates projected generationally with Modified MP-2020 Improvement Scale that is 75% of the MP2020 rates
The actuarial assumptions used in the June 30, 2020 valuation were based on the results of an actuarial experience study for the period from July 1, 2016 through June 30, 2020, except the change in the discount rate, which was based on VRS Board action effective as of July 1, 2019 . Changes to the actuarial assumptions as a result of the experience study and VRS Board action are as follows:
Mortality Rates (Pre-retirement, post-retirement healthy, and disabled)
Retirement Rates
Withdrawal Rates
Mortality rates – SPORS Employees
Pre-Retirement:
Update to PUB2010 public sector mortality tables. For future mortality improvements, replace load with a modified Mortality Improvement Scale MP2020
Adjusted rates to better fit experience for Plan 1; set separate rates based on experience for Plan2/Hybrid; changed final retirement age from 75 to 80 for all
Adjusted rates to better fit experience at each year age and service through 9 years of service
Pub-2010 Amount Weighted Safety Employee Rates projected generationally; 95% of rates for males; 105% of rates for females set forward 2 years
54
Disability Rates No change Salary Scale No change Discount Rate No change
Post-Retirement:
Pub-2010 Amount Weighted Safety Healthy Retiree Rates projected generationally; 110% of rates for males; 105% of rates for females set forward 3 years
Post-Disablement:
Pub-2010 Amount Weighted General Disabled Rates projected generationally; 95% of rates for males set back 3 years; 90% of rates for females set back 3 years
Beneficiaries and Survivors:
Pub-2010 Amount Weighted Safety Contingent Annuitant Rates projected generationally; 110% of rates for males and females set forward 2 years
Mortality Improvement Scale: Rates projected generationally with Modified MP-2020 Improvement Scale that is 75% of the MP2020 rates
The actuarial assumptions used in the June 30, 20 20 valuation were based on the results of an actuarial experience study for the period from July 1, 2016 through June 30, 2020, except the change in the discount rate, which was based on VRS Board action effective as of July 1, 2019 . Changes to the actuarial assumptions as a result of the experience study and VRS Board action are as follows:
Mortality Rates (Pre-retirement, post-retirement healthy, and disabled)
Retirement Rates
Withdrawal Rates
Mortality rates – VaLORS Employees
Pre-Retirement:
Update to PUB2010 public sector mortality tables. For future mortality improvements, replace load with a modified Mortality Improvement Scale MP2020
Increased rates for ages 55 to 61, 63, and 64 with 26 or more years of service; changed final retirement age from 65 to 70
Decreased rate for 0 years of service and increased rates for 1 to 6 years of service
Pub-2010 Amount Weighted Safety Employee Rates projected generationally; 95% of rates for males; 105% of rates for females set forward 2 years
Post-Retirement:
Pub-2010 Amount Weighted Safety Healthy Retiree Rates projected generationally; 110% of rates for males; 105% of rates for females set forward 3 years
55
Disability Rates No change Salary Scale No change Line of Duty Disability No change Discount Rate No change
Post-Disablement:
Pub-2010 Amount Weighted General Disabled Rates projected generationally; 95% of rates for males set back 3 years; 90% of rates for females set back 3 years
Beneficiaries and Survivors:
Pub-2010 Amount Weighted Safety Contingent Annuitant Rates projected generationally; 110% of rates for males and females set forward 2 years
Mortality Improvement Scale: Rates projected generationally with Modified MP-2020 Improvement Scale that is 75% of the MP2020 rates
The actuarial assumptions used in the June 30, 20 20 valuation were based on the results of an actuarial experience study for the period from July 1, 2016 through June 30, 2020, except the change in the discount rate, which was based on VRS Board action effective as of July 1, 2019. Changes to the actuarial assumptions as a result of the experience study and VRS Board action are as follows:
Mortality Rates (Pre-retirement, post-retirement healthy, and disabled)
Retirement Rates
Withdrawal Rates
Mortality rates – JRS Employees
Pre-Retirement:
Update to PUB2010 public sector mortality tables. For future mortality improvements, replace load with a modified Mortality Improvement Scale MP2020
Increased rates a some younger ages, decreased at age 62, and changed final retirement age from 65 to 70
Adjusted rates to better fit experience at each year age and service through 9 years of service
Pub-2010 Amount Weighted General Employee Rates projected generationally; males set forward 2 years
Post-Retirement:
Pub-2010 Amount Weighted General Healthy Retiree Rates projected generationally; 95% of rates for males and females set back 2 years
Post-Disablement:
Pub-2010 Amount Weighted General Disabled Rates projected generationally
56
Disability Rates No change Salary Scale No change Line of Duty Disability No change Discount Rate No change
Beneficiaries and Survivors:
Pub-2010 Amount Weighted Safety Contingent Annuitant Rates projected generationally
Mortality Improvement Scale: Rates projected generationally with Modified MP-2020 Improvement Scale that is 75% of the MP2020 rates
The actuarial assumptions used in the June 30, 20 20 valuation were based on the results of an actuarial experience study for the period from July 1, 2016 through June 30, 2020, except the change in the discount rate, which was based on VRS Board action effective as of July 1, 2019 . Changes to the actuarial assumptions as a result of the experience study and VRS Board action are as follows:
Mortality Rates (Pre-retirement, post-retirement healthy, and disabled)
Review separately from State employees because exhibit fewer deaths. Update to PUB2010 public sector mortality tables. For future mortality improvements, replace load with a modified Mortality Improvement Scale MP-2020
Retirement Rates Decreased rates for ages 60-66 and 70-72
Mortality rates – Largest 10 Locality Employers – General Employees
Pre-Retirement:
Pub-2010 Amount Weighted Safety Employee Rates projected generationally; males set forward 2 years; 105% of rates for females set forward 3 years
Post-Retirement:
Pub-2010 Amount Weighted Safety Healthy Retiree Rates projected generationally; 95% of rates for males set forward 2 years; 95% of rates for females set forward 1 year
Post-Disablement:
Pub-2010 Amount Weighted General Disabled Rated projected generationally; 110% of rates for males set forward 3 years; 110% of rates for females set forward 2 years
Beneficiaries and Survivors:
Pub-2010 Amount Weighted Safety Contingent Annuitant Rates projected generationally
Mortality Improvement Scale:
Rates projected generationally with Modified MP-2020 Improvement Scale that is 75% of the MP2020 rates
57
No change Disability Rates No change
Reduce
Discount
No
Withdrawal Rates
Salary Scale
increases across all ages by 0.50%
Rate
change
The actuarial assumptions used in the June 30, 20 20 valuation were based on the results of an actuarial experience study for the period from July 1, 2016 through June 30, 2020, except the change in the discount rate, which was based on VRS Board action effective as of July 1, 2019 . Changes to the actuarial assumptions as a result of the experience study and VRS Board action are as follows:
Mortality Rates (Pre-retirement, post-retirement healthy, and disabled)
Retirement Rates
Withdrawal Rates
Update to PUB2010 public sector mortality tables. For future mortality improvements, replace load with a modified Mortality Improvement Scale MP2020
Adjusted rates to better fit experience for Plan 1; set separate rates based on experience for Plan2/Hybrid; changed final retirement age from 75 to 80 for all
Adjusted rates to better fit experience at each age and service decrement through 9 years of service
Mortality rates – Non-Largest 10 Locality Employers – General Employees
Pre-Retirement:
Pub-2010 Amount Weighted Safety Employee Rates projected generationally; males set forward 2 years; 105% of rates for females set forward 3 years
Post-Retirement:
Pub-2010 Amount Weighted Safety Healthy Retiree Rates projected generationally; 95% of rates for males set forward 2 years; 95% of rates for females set forward 1 year
Post-Disablement:
Pub-2010 Amount Weighted General Disabled Rates projected generationally; 110% of rates for males set forward 3 years; 110% of rates for females set forward 2 years
Beneficiaries and Survivors:
Pub-2010 Amount Weighted Safety Contingent Annuitant Rates projected generationally
Mortality Improvement Scale: Rates projected generationally with Modified MP-2020 Improvement Scale that is 75% of the MP2020 rates
The actuarial assumptions used in the June 30, 20 20 valuation were based on the results of an a ctuarial experience study for the period from July 1, 2016 through June 30, 2020, except the change in the discount rate, which was based on VRS Board action effective as of July 1, 2019 . Changes to the actuarial assumptions as a result of the experience study and VRS Board action are as follows:
58
Disability Rates No change Salary Scale No change Line of Duty Disability No change Discount Rate No change
Mortality Rates (Pre-retirement, post-retirement healthy, and disabled)
Retirement Rates
Withdrawal Rates
Update to PUB2010 public sector mortality tables. For future mortality improvements, replace load with a modified Mortality Improvement Scale MP2020
Adjusted rates to better fit experience for Plan 1; set separate rates based on experience for Plan2/Hybrid; changed final retirement age from 75 to 80 for all
Adjusted rates to better fit experience at each age and service decrement through 9 years of service
Mortality rates – Largest 10 Locality Employers – Hazardous Duty Employees
Pre-Retirement:
Pub-2010 Amount Weighted Safety Employee Rates projected generationally; 95% of rates for males; 105% of rates for females set forward 2 years
Post-Retirement:
Pub-2010 Amount Weighted Safety Healthy Retiree Rates projected generationally; 110% of rates for males; 105% of rates for females set forward 3 years
Post-Disablement:
Pub-2010 Amount Weighted General Disabled Rates projected generationally; 95% of rates f or males set back 3 years; 90% of rates for females set back 3 years
Beneficiaries and Survivors:
Pub-2010 Amount Weighted Safety Contingent Annuitant Rates projected generationally; 110% of rates for males and females set forward 2 years
Mortality Improvement Scale: Rates projected generationally with Modified MP-2020 Improvement Scale that is 75% of the MP2020 rates
The actuarial assumptions used in the June 30, 20 20 valuation were based on the results of an actuarial experience study for the period from July 1, 2016 through June 30, 2020, except the change in the discount rate, which was based on VRS Board action effective July 1, 2019 . Changes to the actuarial assumptions as a result of the experience study and VRS Board action are as follows:
59
No change
No change Line of Duty Disability No change Discount Rate No change
Disability Rates
Salary Scale
Mortality Rates (Pre-retirement, post-retirement healthy, and disabled)
Retirement Rates
Update to PUB2010 public sector mortality tables. Increased disability life expectancy. For future mortality improvements, replace load with a modified Mortality Improvement Scale MP-2020
Adjusted rates to better fit experience and changed final retirement age from 65 to 70
Mortality rates – Non-Largest 10 Locality Employers – Hazardous Duty Employees
Pre-Retirement:
Pub-2010 Amount Weighted Safety Employee Rates projected generationally; 95% of rates for males; 105% of rates for females set forward 2 years
Post-Retirement:
Pub-2010 Amount Weighted Safety Healthy Retiree Rates projected generationally; 110% of rates for males; 105% of rates for females set forward 3 years
Post-Disablement:
Pub-2010 Amount Weighted General Disabled Rates projected generationally; 95% of rates for males set back 3 years; 90% of rates for females set back 3 years
Beneficiaries and Survivors:
Pub-2010 Amount Weighted Safety Contingent Annuitant Rates projected generationally; 110% of rates for males and females set forward 2 years
Mortality Improvement Scale:
Rates projected generationally with Modified MP-2020 Improvement Scale that is 75% of the MP2020 rates
The actuarial assumptions used in the June 30, 20 20 valuation were based on the results of an actuarial experience study for the period from July 1, 2016 through June 30, 2020, except the change in the discount rate, which was based on VRS Board action effective as of July 1, 2019 . Changes to the actuarial assumptions as a result of the experience study and VRS Board action are as follows:
60
Withdrawal Rates Decreased rates Disability Rates No change Salary Scale No change Line of Duty Disability No change Discount Rate No change
Mortality Rates (Pre-retirement, post-retirement healthy, and disabled)
Retirement Rates
Withdrawal Rates
Net Group Life Insurance Program OPEB Liability
Update to PUB2010 public sector mortality tables. Increased disability life expectancy. For future mortality improvements, replace load with a modified Mortality Improvement Scale MP-2020
Adjusted rates to better fit experience and changed final retirement age from 65 to 70
Decreased rates and changed from rates based on age and service to rates based on service only to better fit experience and to be more consistent with Locals Top 10 Hazardous Duty
The net OPEB liability (NOL) for the Group Life Insurance Program represents the program’s total OPEB liability determined in accordance with GASB Statement No. 74, less the associated fiduciary net position. As of the Measurement Date of June 30, 2021, NOL amounts for the Group Life Insurance Program are as follows (amounts expressed in thousands):
The total Group Life Insurance Program OPEB liability is calculated by the System’s actuary, and each plan’s fiduciary net position is reported in the System’s financial statements. The net Group Life Insurance Program OPEB liability is disclosed in accordance with the requirements of GASB Sta tement No. 74 in the System’s notes to the financial statements and required supplementary information.
61
Disability Rates No change Salary Scale No change Line of Duty Disability No change Discount Rate No change
Group Life Insurance OPEB Program Total Group Life Insurance Program OPEB Liability $ 3,577,346 Plan Fiduciary Net Position 2,413,074 Group Life Insurance Program Net OPEB Liability (Asset) $ 1,164,272 Plan Fiduciary Net Position as a Percentage of the Total Group Life Insurance Program OPEB Liability 67.45%
Long-Term Expected Rate of Return
The long-term expected rate of return on the System’s investments was determined using a log-normal distribution analysis in which best-estimate ranges of expected future real rates of return (expected returns, net of System’s investment expense and inflation) are developed for each major asset class. These ranges are combined to produce the long-term expected rate of return by weighting the expected future real rates of return by the target asset allocation percentage and by adding expected inflation. The target asset allocation and best estimate of arithm etic real rates of return for each major class are summarized in the following table:
* The above allocation provides a one-year return of 7.39%. However, one-year returns do not take into account the volatility present in each of the asset classes. In setting the long -term expected return for the System, stochastic projections are employed to model future returns under various economic conditions. These results provide a range of returns over various time periods that ultimately provide a median return of 6.94%, including expected inflation of 2.50%.
On October 10, 2019, the VRS Board elected a long-term rate of 6.75%, which is roughly at the 40th percentile of expected long-term results of the VRS fund asset allocation at that time, providing a median return of 7.11%, including expected inflation of 2.50%.
Discount Rate
The discount rate used to measure the total Group Life Insurance Program OPEB liability was 6.75% The projection of cash flows used to determine the discount rate assumed that employer contributions will be made in accordance with the VRS funding policy and at rates equal to the actuarially determined contribution rates adopted by the VRS Board of Trustees. Through the fiscal year ending June 30, 2021,
62
Asset Class (Strategy) Long-Term Target Asset Allocation Arithmetic Long-Term Expected Rate of Return Weighted Average Long-Term Expected Rate of Return* Public Equity 34.00% 5.00% 1.70% Fixed Income 15.00% 0.57% 0.09% Credit Strategies 14.00% 4.49% 0.63% Real Assets 14.00% 4.76% 0.67% Private Equity 14.00% 9.94% 1.39% MAPS – Multi-Asset Public Strategies 6.00% 3.29% 0.20% PIP – Private Investment Partnership 3.00% 6.84% 0.21% Total 100.00% 4.89% Inflation 2.50% Expected arithmetic nominal return * 7.39%
the rate contributed by the Partnership for the Group Life Insurance Program OPEB will be subject to the portion of the VRS Board-certified rates that are funded by the Virginia General Assembly which was 100% of the actuarially determined contribution rate. From July 1, 2021 on, employers are assumed to continue to contribute 100% of the actuarially determined contribution rates. Based on those assumptions, the Group Life Insurance Program OPEB’s fiduciary net position was projected to be available to make all projected future benefit payments of eligible employees. Therefore , the long-term expected rate of return was applied to all periods of projected benefit payments to determine the total Group Life Insurance Program OPEB liability.
Sensitivity of the Partnership’s Proportionate Share of the Net Group Life Insurance Program OPEB Liability to Changes in the Discount Rate
The following presents the Partnership’s proportionate share of the net Group Life Insurance Program OPEB liability using the discount rate of 6.75%, as well as what the Partnership’s proportionate share of the net Group Life Insurance Program OPEB liability would be if it were calculated using a discount rate that is one percentage point lower (5.75%) or one percentage point higher (7.75%) than the current rate:
Group Life Insurance Program Fiduciary Net Position
Detailed information about the Group Life Insurance Program’s Fiduciary Net Position is available in the separately issued VRS 2021 Annual Comprehensive Financial Report (Annual Report). A copy of the 2021 VRS Annual Report may be downloaded from the VRS website at: https://www.varetire.org/pdf/publications/2021-annual-report.pdf or by writing to the System’s Chief Financial Officer at P.O. Box 2500, Richmond, VA, 23218-2500.
13. DISABILITY INSURANCE PROGRAM
General Information about the VRS Disability Insurance Program Plan Description
All Partnership full-time and part-time permanent salaried employees who are covered under the Virginia Retirement System (VRS) hired on or after January 1, 1999 are automatically covered by the Disability Insurance Program (VSDP) upon employment. The Disability Insurance Program also covers state employees hired before January 1, 1999 who elected to transfer to VSDP rather than retain their eligibility to be considered for disability retirement. This plan is administered by the Virginia Retirement System (the
63
1.00% Decrease 5.75% Current Discount Rate 6.75% 1.00% Increase 7.75% Partnership’s proportionate share of the Group Life Insurance Program Net OPEB Liability $ 1,013,482 $ 693,673 $ 435,414
System), along with pensions and other OPEB plans, for public employer groups in the Commonwealth of Virginia.
The specific information for the Disability Insurance Program OPEB, including eligibility, coverage and benefits is set out in the table below:
DISABILITY INSURANCE PROGRAM (VSDP) PLAN PROVISIONS
Eligible Employees
The Virginia Sickness and Disability Program, also known as the Disability Insurance Trust Fund, was established January 1, 1999 to provide short -term and long-term disability benefits for non-work-related and work-related disabilities.
Eligible employees are enrolled automatically upon employment. They include:
• Full-time and part-time permanent salaried state employees covered under VRS.
• State employees hired before January 1, 1999, who elected to transfer to VSDP rather than retain their eligibility to be considered for VRS disability retirement.
• Public college and university faculty members who elect the VRS defined benefit plan. They may participate in VSDP or their institution’s disability program, if offered. If the institution does not offer the program or the faculty member does not make an election, he or she is enrolled in VSDP.
Benefit Amounts
The Virginia Sickness and Disability Program provides the following benefits for eligible employees:
• Leave – Sick, family and personal leave. Eligible leave benefits are paid by the employer.
• Short-Term Disability – The program provides a short-term disability benefit beginning after a seven-calendar-day waiting period for the first day of disability. The benefit provides income replacement beginning at 100% of the employee’s pre-disability income, reducing to 80% and then 60% based on the period of the disability and the length of service of the employee. Shortterm disability benefits are paid by the employer.
• Long-Term Disability – The program provides a long-term disability benefit beginning after 125 workdays of short-term disability and continuing until the employee reaches his or her normal retirement age. The benefit provides income replacement of 60% of the employee’s predisability income. If an employee becomes disabled within five years of his or her normal retirement age, the employee will receive up to five years of VSDP benefits, provided he or she remains medically eligible. Long-term disability benefits are paid for by the Virginia Disability Insurance Program (VSDP) OPEB Plan.
• Income Replacement Adjustment – The program provides for an income replacement adjustment to 80% for catastrophic conditions.
• VSDP Long-Term Care Plan – The program also includes a self-funded long-term care plan that assists with the cost of covered long-term care services.
64
DISABILITY INSURANCE PROGRAM (VSDP) PLAN PROVISIONS
Disability Insurance Program (VSDP) Plan Notes:
• Employees hired or rehired on or after July 1, 2009, must satisfy eligibility periods before becoming eligible for non-work-related short-term disability benefits and certain incomereplacement levels.
• A state employee who is approved for VSDP benefits on or after the date that is five years prior to his or her normal retirement date is eligible for up to five years of VSDP benefits.
• Employees on work-related short-term disability receiving only a workers’ compensation payment may be eligible to purchase service credit for this period if retirement contributions are not being withheld from the workers’ compensation payment. The rate will be based on 5.00% of the employee’s compensation.
Cost-of-Living Adjustment (COLA)
• During periods an employee receives long-term disability (LTD) benefits, the LTD benefit may be increased annually by an amount recommended by the actuary and approved by the Board.
o Plan 1 employees vested as of 1/1/2013 – 100% of the VRS Plan 1 COLA (The first 3% increase in the Consumer Price Index for all Urban Consumers (CIP-U) and half of any additional increase (up to 4%) up to a maximum COLA of 5%).
o Plan 1 employees non-vested as of 1/1/2013, Plan 2 and Hybrid Plan employees – 100% of the VRS Plan 2 and Hybrid COLA (The first 2% increase in the Consumer Price Index for all Urban Consumers (CPI-U) and half of any additional increase (up to 2%) up to a maximum COLA of 3%).
• For participating full-time employees taking service retirement, the creditable compensation may be increased annually by an amount recommended by the actuary and approved by the Board, from the date of the commencement of the disability to the date of retirement.
o 100% of the increase in the pay over the previous plan year for continuing VSDP members in the State Plan, with a maximum COLA of 4.00%.
• For participating full-time employees receiving supplemental (work-related) disability benefits, the creditable compensation may be increased annually by an amount recommended by the actuary and approved by the Board, from the date of the commencement of the disability to the date of retirement.
o 100% of the increase in the pay over the previous plan year for continuing VSDP members in the State Plan, with a maximum COLA of 4.00%.
Contributions
The contribution requirements for the Disability Insurance Program are governed by §51.1 -1140 of the Code of Virginia, as amended, but may be impacted as a result of funding provided to the Partnership by the Virginia General Assembly. The Partnership’s contractually required employer contribution rate for the Disability Insurance Program for the year ended June 30, 2022 was 0.61% of covered employee compensation. This rate was based on an actuarially determined rate from an actuarial valuation as of June 30, 2019. The actuarially determined rate was expected to finance the costs of benefits payable during the year, with an adjustment to amortize the accrued OPEB assets. Contributions from the Partnership to the
65
Disability Insurance Program were $85,751 and $72,980 for the years ended June 30, 2022 and June 30, 2021, respectively.
Disability Insurance Program (VSDP) OPEB Assets, VSDP OPEB Expense, and Deferred Outflows of Resources and Deferred Inflows of Resources Related to the VSDP OPEB
At June 30, 2022, the Partnership reported an asset of $954,220 for its proportionate share of the Net VSDP OPEB Asset. The Net VSDP OPEB Asset was measured as of June 30, 2021 and the total VSDP OPEB Liability used to calculate the Net VRS VSDP OPEB Asset was determined by an actuarial valuation as of June 30, 2020 and rolled forward to the measurement date of June 30, 2021. The Partnership’s proportion of the Net VSDP OPEB Asset was based on the Partnership’s actuarially determined employer contributions to the VSDP OPEB plan for the year ended June 30, 2021 relative to the total of the actua rially determined employer contributions for all participating employers. At June 30, 20 21, the Partnership’s proportion was 0 27681% as compared to 0.25250% at June 30, 2020
For the year ended June 30, 2022, the Partnership recognized VSDP OPEB expense of ($32,546). Since there was a change in proportionate share between measurement dates, a portion of the VSDP OPEB expense was related to deferred amounts from changes in proportion.
At June 30, 2022, the Partnership reported deferred outflows of resources and deferred inflows of resources related to the VSDP OPEB from the following sources:
Deferred Outflows
$85,751 reported as deferred outflows of resources related to the VSDP OPEB resulting from the Partnership’s contributions subsequent to the measurement date will be recognized as a reduction of the Net VSDP OPEB Asset in the Fiscal Year ending June 30, 2023. Other amounts reported as deferred outflows of resources and deferred inflows of resources related to the VSDP OPEB will be recognized in VSDP OPEB expense in future reporting periods as follows:
66
of Resources Deferred Inflows of Resources Differences between expected and actual experience $ 45,348 $ 154,723 Net difference between projected and actual earn ings on VSDP OPEB program investments - 178,659 Change in assumptions 6,428 22,486 Changes in proportion 1,396 99,265 Employer contribution subsequent to the measurement date 85,751Total $ 138,923 $ 455,133
Year Ended June 30
FY 2023 $ (89,393)
FY 2024 $ (88,556)
FY 2025 $ (86,524)
FY 2026 $ (90,708)
FY 2027 $ (37,636)
Thereafter $ (9,144)
Actuarial Assumptions
The total VSDP OPEB liability was based on an actuarial valuation as of June 30, 20 20, using the Entry Age Normal actuarial cost method and the following assumptions, applied to all periods included in the measurement and rolled forward to the measurement date of June 30, 2021
6.75%, net of plan investment expenses, including inflation
Mortality rates – General State Employees
Pre-Retirement:
Pub-2010 Amount Weighted General Employee Rates projected generationally; females set forward 2 years
Post-Retirement: Pub-2010 Amount Weighted General Healthy Retiree Rates projected generationally; 110% of rates for females
Post-Disablement: Pub-2010 Amount Weighted General Disabled Rates projected generatio nally; males and females set forward 3 years
Beneficiaries and Survivors: Pub-2010 Amount Weighted General Contingent Annuitant Rates projected generationally; 110% of rates for males and females
Mortality Improvement Scale: Rates projected generationally with Modified MP-2020 Improvement Scale that is 75% of the MP2020 rates
67
Inflation 2.50% Salary increases, including inflationGeneral state employees 3.50% – 5.35% SPORS employees 3.50% – 4.75% VaLORS employees 3.50% – 4.75% Investment
rate of return
The actuarial assumptions used in the June 30, 20 20 valuation were based on the results of an actuarial experience study for the period from July 1, 2016 through June 30, 2020, except the change in the discount rate, which was based on VRS Board action effective as of July 1, 2019 . Changes to the actuarial assumptions as a result of the experience study and VRS Board action are as follows:
Mortality Rates (Pre-retirement, post-retirement healthy, and disabled)
Retirement Rates
Withdrawal Rates
Mortality rates – SPORS Employees
Pre-Retirement:
Update to PUB2010 public sector mortality tables. For future mortality improvements, replace loa d with a modified Mortality Improvement Scale MP2020
Adjusted rates to better fit experience for Plan 1; set separate rates based on experience for Plan 2/Hybrid; changed final retirement age from 75 to 80 for all
Adjusted rates to better fit experience at each year age and service through 9 years of service
Pub-2010 Amount Weighted Safety Employee Rates projected generationally; 95% of rates for males; 105% of rates for females set forward 2 years
Post-Retirement:
Pub-2010 Amount Weighted Safety Healthy Retiree Rates projected generationally; 110% of rates for males; 105% of rates for females set forward 3 years
Post-Disablement:
Pub-2010 Amount Weighted General Disabled Rates projected generationally; 95% of rates for males set back 3 years; 90% of rates for females set back 3 years
Beneficiaries and Survivors:
Pub-2010 Amount Weighted General Contingent Annuitant Rates projected generationally; 110% of rates for males and females set forward 2 years
Mortality Improvement Scale:
Rates projected generationally with Modified MP-2020 Improvement Scale that is 75% of the MP2020 rates
The actuarial assumptions used in the June 30, 2020 valuation were based on the results of an actuarial experience study for the period from July 1, 2016 through June 30, 2020, except the change in the discount rate, which was based on VRS Board action effective as of July 1, 2019. Changes to the actuarial assumptions as a result of the experience study and VRS Board action are as follows:
68
Disability Rates No change Salary Scale No change Line of Duty Disability No change Discount Rate No change
Mortality Rates (Pre-retirement, post-retirement healthy, and disabled)
Retirement Rates
Withdrawal Rates
Mortality rates – VaLORS Employees
Pre-Retirement:
Update to PUB2010 public sector mortality tables. Increased disability life expectancy. For future mortality improvements, replace load with a modified Mortality Improvement Scale MP-2020
Increased rates for ages 55 to 61, 63, and 64 with 26 or more years of service and changed final retirement age from 65 to 70
Decreased rate for 0 years of service and increased rates for 1 to 6 years of service
Pub-2010 Amount Weighted Safety Employee Rates projected generationally; 95% of rates for males; 105% of rates for females set forward 2 years
Post-Retirement:
Pub-2010 Amount Weighted Safety Healthy Retiree Rates projected generationally; 110% of rates for males; 105% of rates for females set forward 3 years
Post-Disablement:
Pub-2010 Amount Weighted General Disabled Rates projected generationally; 95% of rates for males set back 3 years; 90% of rates for females set back 3 years
Beneficiaries and Survivors:
Pub-2010 Amount Weighted Safety Contingent Annuitant Rates projected generationally; 110% of rates for males and females set forward 2 years
Mortality Improvement Scale:
Rates projected generationally with Modified MP-2020 Improvement Scale that is 75% of the MP2020 rates
The actuarial assumptions used in the June 30, 20 20 valuation were based on the results of an actuarial experience study for the period from July 1, 2016 through June 30, 2020, except the change in the discount rate, which was based on VRS Board action effective as of July 1, 2019 . Changes to the actuarial assumptions as a result of the experience study and VRS Board action are as follows:
69
Disability Rates No change Salary Scale No change Line of Duty Disability No change Discount Rate No change
Mortality Rates (Pre-retirement, post-retirement healthy, and disabled)
Retirement Rates
Update to PUB2010 public sector mortality tables. Increased disability life expectancy. For future mortality improvements, replace load with a modified Mortality Improvement Scale MP-2020
Increased rates at some younger ages, decreased at age 62, and changed final retirement age from 65 to 70
Adjusted rates to better fit experience at each a ge and service decrement through 9 years of service
Net VSDP OPEB Asset
The net OPEB asset (NOA) for the VSDP represents the program’s total OPEB liability determined in accordance with GASB Statement No. 74, less the associated fiduciary net position. As of the Measurement Date of June 30, 2021, NOA amounts for the VSDP are as follows (amounts expressed in thousands):
The total VSDP OPEB liability is calculated by the System’s actuary, and each plan’s fiduciary net position is reported in the System’s financial statements. The net OPEB asset is disclosed in accordance with the requirements of GASB Statement No. 74 in the System’s notes to the financial statements and required supplementary information.
Long-Term Expected Rate of Return
The long-term expected rate of return on System investments was determined using a log-normal distribution analysis in which best-estimate ranges of expected future real rates of return (expected returns, net of VRS System investment expense and inflation) are developed for each major asset class. These ranges are combined to produce the long-term expected rate of return by weighting the expected future real rates of return by the target asset allocation percentage and by adding expected inflation. The target asset allocation and best estimate of arithmetic real rates of return for each major class are summarized in the following table:
70
Rates
Disability Rates No change Salary Scale No change Line of Duty Disability No change Discount Rate No change
Withdrawal
Virginia Sickness and Disability Program Total VSDP OPEB Liability $267,198 Plan Fiduciary Net Position 611,919 Employers’ Net OPEB Liability (Asset) ($344,721) Plan Fiduciary Net Position as a Percentage of the Total VSDP OPEB Liability 229.01%
* The above allocation provides a one-year return of 7.39%. However, one-year returns do not take into account the volatility present in each of the asset classes. In setting the long -term expected return for the System, stochastic projections are employed to model future returns under various economic conditi ons. These results provide a range of returns over various time periods that ultimately prov ide a median return of 6.94%, including expected inflation of 2.50%.
On October 10, 2019, the VRS Board elected a long-term rate of 6.75%, which was roughly at the 40th percentile of expected long-term results of the VRS fund asset allocation at that time, providing a median return of 7.11%, including expected inflation of 2.50%.
Discount Rate
The discount rate used to measure the total VSDP OPEB liability was 6.75%. The projection of cash flows used to determine the discount rate assumed that employer contributions will be made per the VRS Statutes and that they will be made in accordance with the VRS funding policy and at rates equal to the actuarially determined rates adopted by the VRS Board of Trustees. Through the fiscal year ending June 30, 2021, the rate contributed by the Partnership to the VSDP OPEB Program will be subject to the portion of the VRS Board-certified rates that are funded by the Virginia General Assembly which was 100% of the actuarially determined contribution rate. From July 1, 2021 on, participating employers are assumed to continue to contribute 100% of the actuarially determined contribution rates. Based on those assumptions, the VSDP OPEB Program’s fiduciary net position was projected to be available to make all projected future benefit payments of current active and inactive employees. Therefore , the long-term expected rate of return was applied to all periods of projected benefit payments to determine the total VSDP OPEB liability.
71
Long-Term Target Asset Allocation Arithmetic Long-Term Expected Rate of Return Weighted Average Long-Term Expected Rate of Return* Public Equity 34.00% 5.00% 1.70% Fixed Income 15.00% 0.57% 0.09% Credit Strategies 14.00% 4.49% 0.63% Real Assets 14.00% 4.76% 0.67% Private Equity 14.00% 9.94% 1.39% MAPS – Multi-Asset Public Strategies P 6.00% 3.29% 0.20% PIP – Private Investment Partnership 3.00% 6.84% 0.21% Total 100.00% 4.89% Inflation 2.50% Expected arithmetic nominal return * 7.39%
Asset Class (Strategy)
Sensitivity of the Partnership’s Proportionate Share of the Net VSDP OPEB Asset to Changes in the Discount Rate
The following presents the Partnership’s proportionate share of the net VSDP OPEB asset using the discount rate of 6.75%, as well as what the Partnership’s proportionate share of the net VSDP OPEB asset would be if it were calculated using a discount rate that is one percentage point lower ( 5.75%) or one percentage point higher (7.75%) than the current rate:
VSDP OPEB Fiduciary Net Position
Detailed information about the VSDP Fiduciary Net Position is available in the separately issued VRS 2021 Annual Comprehensive Financial Report (Annual Report). A copy of the 2021 VRS Annual Report may be downloaded from the VRS website at: https://www.varetire.org/pdf/publications/2021-annualreport.pdf or by writing to the System’s Chief Financial Officer at P.O. Box 2500, Richmond, VA, 232182500
14. PRE-MEDICARE RETIREE HEALTHCARE
General Information about the Commonwealth of Virginia State Health Plans Program for Pre -Medicare Retirees
Plan Description
The Commonwealth provides a healthcare plan established by Title 2.2, Chapter 28 of the Code of Virginia for retirees who are not yet eligible to participate in Medicare.
Following are eligibility requirements for Virginia Retirement System (VRS) retirees:
• You are a retiring state employee who is eligible for a monthly retirement benefit from VRS, and
• You start receiving (do not defer) your retirement benefit immediately upon retirement*, and
• Your last employer before retirement was the Commonwealth of Virginia, and
• You were eligible for (even if you were not enrolled) coverage as an active employee in the State Health Benefits Program until your retirement date (not including Extended Coverage/COBRA), and
• You enroll no later than 31 days from your retirement date
*For VRS retirees, this means that your employing agency reported a retirement contribution or leave without pay status for retirement in the month immediately prior to your retirement date. Some faculty members may also be eligible if they are paid on an alternate pay cycle but maintain eligibility for active coverage until their retirement date.
72
1.00% Decrease 5.75% Current Discount Rate 6.75% 1.00% Increase 7.75% Partnership’s proportionate share of the total VSDP Net OPEB Asset $ 901,522 $ 954,220 $ 1,000,562
Effective January 1, 2017**, following are eligibility requirements for Optional Retirement Plan retirees:
• You are a terminating state employee who participates in one of the qualified Optional Retirement Plans, and
• Your last employer before termination was the Commonwealth of Virginia, and
• You were eligible for (even if you were not enrolled) coverage in the State Employee Health Benefits Program for active employees at the time of your termination, and
• You meet the age and service requirements for an immediate retirement benefit under the nonORP Virginia Retirement System plan that you would have been eligible for on your date of hire had you not elected the ORP, and
• You enroll in the State Retiree Health Benefits Program no later than 31 days for the date you lose coverage (or lose eligibility for coverage) in the State Health Benefits Program for active employees due to your termination of employment.
**This change applies to ORP terminations effective January 1, 2017 or later. Eligibility for those who terminated employment prior to January 1 should be determined based on the policy in place at the time of their termination.
The employer does not pay a portion of the retirees’ healthcare premium; however, since both active employees and retirees are included in the same pool for purposes of determining health insurance rates, this generally results in a higher rate for active employees. Therefore, the e mployer effectively subsidizes the costs of the participating retirees’ healthcare through payment of the employer’s portion of the premiums for active employees.
This fund is reported as part of the Commonwealth’s Healthcare Internal Service Fund. Benef it payments are recognized when due and payable in accordance with the benefit terms. Pre -Medicare Retiree Healthcare is a single-employer defined benefit OPEB plan that is treated like a cost -sharing plan for financial reporting purposes and is administered by the Department of Human Resource Management. There were approximately 4,100 retirees and 88,000 active employees in the program as of June 30, 2021. There are no inactive employees entitled to future benefits who are not currently receiving benefits. There are no assets accumulated in a trust to pay benefits.
Pre-Medicare Retiree Healthcare OPEB Liabilities, OPEB
Expense, and Deferred Outflows of Resources and Deferred Inflows of Resources
At June 30, 2022, the Partnership reported a liability of $666,017 for its proportionate share of the collective total Pre-Medicare Retiree Healthcare OPEB liability of $ 448.9 million. The Pre-Medicare Retiree Healthcare OPEB liability was measured as of June 30, 2021 and was determined by an actuarial valuation as of June 30, 2021. The Partnership’s proportion of the Pre -Medicare Retiree Healthcare OPEB liability was based on the Partnership’s calculated healthcare premium contributions, to include the December premium holiday amounts, as a percentage of the total employer’s calculated healthcare premium contributions for all participating employers. At June 30, 2021, the Partnership’s proportion was 0.14837% as compared to 0.13618% at June 30, 2020. For the year ended June 30, 2022, the Partnership recognized Pre-Medicare Retiree Healthcare OPEB expense of ($179,013).
At June 30, 2022, the Partnership reported deferred outflows of resources and deferred inflows of resources related to Pre-Medicare Retiree Healthcare from the following sources:
73
Deferred Outflows of Resources Deferred Inflows of Resources
$48,695 reported as deferred outflows of resources related to the Pre -Medicare Retiree Healthcare OPEB resulting from amounts associated with transactions subsequent to the measurement date will be recognized as a reduction of the total OPEB Liability in the fiscal year ending June 30, 20 23. Other amounts reported as deferred outflows of resources and deferred inflows of resources related to the Pre -Medicare Retiree Healthcare OPEB will be recognized in the Pre-Medicare Retiree Healthcare OPEB expense as follows:
Year Ended June 30
FY 2023 $ (264,000)
FY 2024 $ (223,060)
FY 2025 $ (137,264)
FY 2026 $ (39,793)
FY 2027 $ (8,759)
Thereafter $ (2,700)
Sensitivity of the Partnership’s Proportionate Share of the OPEB Liability to Changes in the Discount Rate
The following presents the Partnership’s proportionate share of the Pre-Medicare Retiree Healthcare OPEB liability using the discount rate of 2.16%, as well as what the Partnership’s proportionate share of the PreMedicare Retiree Healthcare OPEB liability would be if it were calculated using a discount rate that is one percentage point lower (1.16%) or one percentage point higher (3.16%) than the current rate:
74
Differences between expected and actual experience $ - $ 338,630 Change in assumptions - 640,570 Changes in proportion 362,264 58,642 Amounts associated with transactions subsequent to the measurement date 48,695Total $ 410,959 $ 1,037,842
1.00% Decrease 1.16% Current Discount Rate 2.16% 1.00% Increase 3.16% Partnership’s proportionate share of the OPEB Liability $ 700,181 $ 666,017 $ 631,434
Sensitivity of the Partnership’s Proportionate Share of the OPEB Liability to Changes in the Healthcare Cost Trends Rates
The following presents the Partnership’s proportionate share of the Pre -Medicare Retiree Healthcare OPEB liability using a healthcare cost trend of 6.75% decreasing to 4.50%, as well as what the Partnership’s proportionate share of the Pre-Medicare Retiree Healthcare OPEB liability would be if it were calculated using a healthcare cost trend rate that is one percentage point lower ( 5.75% decreasing to 3.50%) or one percentage point higher (7.75% decreasing to 5.50%) than the current rate:
Actuarial Assumptions and Methods
The total Pre-Medicare Retiree Healthcare OPEB liability was based on an actuarial valuation with a valuation date of June 30, 2021. The Department of Human Resource Management selected the economic, demographic and healthcare claim cost assumptions. The actuary provided guidance with respect to these assumptions. Initial healthcare costs trend rates used were 6.75 percent for medical and pharmacy and 4.0 percent for dental. The ultimate trend rates used were 4.50 percent for medical and pharmacy and 4.0 percent for dental. Valuation
Actuarially determined contribution rates are calculated as of June 30, one year prior to the end of the fiscal year in which contributions are reported. Measurement Date June 30, 2021 (one year prior to the end of the fiscal year)
Mortality
Mortality rates vary by participant status and gender
75
1.00% Decrease 5.75% decreasing to 3.50% Trend Rate 6.75% decreasing to 4.50% 1.00% Increase 7.75% decreasing to 5.50% Partnership’s proportionate share of the OPEB Liability $ 600,805 $ 666,017 $ 741,732
Date
Actuarial Cost Method Entry Age Normal Amortization Method Level dollar, Closed Effective Amortization Period 6.37 years Discount Rate 2.16% Projected Salary Increases 5.35% to 3.5% based on years of service from 1 year to 20 years or more Medical Trend Under 65 Medical & Rx: 6.75% to 4.50% Dental: 4.00% Year of Ultimate Trend 2033
Pre-Retirement:
Pub-2010 Benefits Weighted General Employee Rates projected generationally with a Modified MP-2021 Improvement Scale; females set forward 2 years
Post-Retirement:
Pub-2010 Benefits Weighted General Healthy Retiree Rates projected generationally with a Modified MP-2021 Improvement Scale; 110% of rates for females
Post-Disablement:
Pub-2010 Benefits Weighted General Disabled Rates projected generationally with a Modified MP-2021 Improvement Scale; males and females set forward 3 years
Beneficiaries and Survivors:
Pub-2010 Amount Weighted Safety Contingent Annuitant Rates projected generationally with a Modified MP-2021 Improvement Scale; 110% of rates for males and females
The discount rate was based on the Bond Buyers GO 20 Municipal Bond Index as of the measurement date which is June 30, 2021.
Changes of Assumptions
The following actuarial assumptions were updated since the June 30, 2020 valuation based on recent experience:
Retiree Participation
Reduced the rate from 45% to 40%
Spousal coverage and retiree participation were based on a blend of recent experience and the prior year assumptions. The mortality table has been updated from adjusted RP-2014 mortality tables using Scale BB to adjusted Pub-2010 Headcount-Weighted mortality tables projected generationally with modified MP-2021 Improvement Scales.
No excise tax has been reflected due to the SECURE Act. Among the provisions was a repeal of three taxes and fees that were originally intended to help fund the Affordable Care Act (ACA): i) the excise tax on high-cost health plans (Cadillac tax); ii) the annual fee on health insurance providers; a nd iii) the medical device excise tax.
The trend rates were updated based on economic conditions as of June 30, 2021. Additionally, the discount rate was decreased from 2.21% to 2.16% based on the Bond Buyers GO 20 Municipal Bond index.
There were no plan changes in the valuation since the prior year.
76
Employees of the Partnership may participate in the Commonwealth’s Deferred Compensation Plan. Participating employees can contribute to the plan each pay period with the Partnership matching up to $20 per pay period. The dollar amount of the match can change depending on the funding available in the Partnership’s budget. The Deferred Compensation Plan is a qualified defined contribution plan under Section 401(a) of the Internal Revenue Code. Employer contributions under the Deferred Compensation Plan were $35,991 for the year ended June 30, 2022
16 RISK MANAGEMENT
The Partnership is exposed to various risks of loss related to torts; theft, damage, or destruction of assets; errors and omissions; non-performance of duty; injuries to employees; and natural disasters. The Partnership is insured for these risks through commercial insurance policies. Further, the Partnership is insured for workers compensation and for loss from employee actions by an insurance policy issued by the Chubb Group and the Great Northern Insurance Company. Policy coverage for loss from employee actions is $50,000 per year with a $1,000 deductible for each loss.
The Partnership participates in the state health care insurance plan maintained by the Commonwealth of Virginia, which is administered by DHRM. The Partnership pays premiums to DHRM for health insurance coverage. Information relating to the Commonwealth's insurance pla n is available at the statewide level in the Commonwealth of Virginia's Annual Comprehensive Financial Report.
77
15 DEFERRED COMPENSATION PLAN
REQUIRED SUPPLEMENTARY INFORMATION
Required Supplementary Information
VRS State Employee Retirement Plan
For the Measurement Dates of June 30, 2014 through 2021
Schedule is intended to show information for 10 years. Since 2021 is the eighth year for this presentation, there are only eight years available. However, additional years will be included as they become available.
78
Schedule of Employer's Share of Net Pension Liability
Employer’s Proportion of the Net Pension Liability (Asset) Employer’s Proportionate Share of the Net Pension Liability (Asset) Employer’s Covered Payroll Employer’s Proportionate Share of the Net Pension Liability (Asset) as a Percentage of its Covered Payroll Plan Fiduciary Net Position as a Percentage of the Total Pension Liability 2021 0.26227% $ 9,513,136 $12,192,249 78.03% 86.44% 2020 0.24079% $17,444,893 $11,190,033 155.90% 72.15% 2019 0.21623% $13,665,158 $9,408,574 145.24% 75.13% 2018 0.21507% $11,643,000 $9,212,635 126.38% 77.39% 2017 0.19536% $11,385,000 $7,937,681 143.43% 75.33% 2016 0.19429% $12,805,000 $7,675,614 166.83% 71.29% 2015 0.20111% $12,313,000 $7,745,983 158.96% 72.81% 2014 0.19015% $10,646,000 $7,349,371 144.86% 74.28%
Required Supplementary Information
Schedule of Employer Contributions
VRS State Employee Retirement Plan
For the Years Ended June 30, 2013 through 2022
79
Date Contractually Required Contribution Contribution in Relation to Contractually Required Contribution Contribution Deficiency (Excess) Employer’s Covered Payroll Contributions as a % of Covered Payroll 2022 $2,075,923 $2,075,923 $ - $14,356,314 14.46% 2021 $1,762,999 $1,762,999 $ - $12,192,249 14.46% 2020 $1,512,893 $1,512,893 $ - $11,190,033 13.52% 2019 $1,272,040 $1,272,040 $ - $9,408,574 13.52% 2018 $1,242,786 $1,242,786 $ - $9,212,635 13.49% 2017 $1,070,793 $1,070,793 $ - $7,937,681 13.49% 2016 $1,073,588 $1,073,588 $ - $7,675,614 13.99% 2015 $955,080 $955,080 $ - $7,745,983 12.33% 2014 $643,805 $643,805 $ - $7,349,371 8.76% 2013 $653,491 $653,491 $ - $7,459,946 8.76%
VRS State Employee Retirement Plan
Notes to Required Supplementary Information for the Year Ended June 30, 2022
Changes of benefit terms – There have been no actuarially material changes to the System benefit provisions since the prior actuarial valuation.
Changes of assumptions – The actuarial assumptions used in the June 30, 2020 valuation were based on the results of an actuarial experience study for the period from July 1, 2016 through June 30, 2020, except the change in the discount rate, which was based on VRS Board action effective as of July 1, 2019. Changes to the actuarial assumptions for the VRS State Employee Retirement Plan as a result of the experience study and VRS Board action are as follows:
Mortality Rates (Pre-retirement, post-retirement healthy, and disabled)
Retirement Rates
Withdrawal Rates
Update to PUB2010 public sector mortality tables. For future mortality improvements, replace load with a modified Mortality Improvement Scale MP-2020
Adjusted rates to better fit experience for Plan 1; set separate rates based on experience for Plan 2/Hybrid; changed final retirement ages from 75 to 80 for all
Adjusted rates to better fit experience at each year age and service through 9 years of service
80
Disability Rates No change Salary Scale No change Line of Duty Disability No change Discount Rate No change
Required Supplementary Information
Schedule of Employer's Share of Net OPEB Liability Health Insurance Credit Program (HIC) For the Measurement Dates of June 30, 2017 through 2021
Proportion of the Net HIC OPEB Liability
Proportionate Share of the Net HIC OPEB Liability
Schedule is intended to show information for 10 years. Since 2021 is the fifth year for this presentation, there are only five years available. However, additional years will be included as they become available.
81
Employer’s
(Asset) Employer’s
(Asset) Employer’s
Payroll Employer’s Proportionate Share of the Net HIC OPEB Liability (Asset) as a Percentage of its Covered Payroll Plan Fiduciary Net Position as a Percentage of the Total HIC OPEB Liability 2021 0.17065% $1,441,208 $12,297,449 11.72% 19.75% 2020 0.15667% $1,438,240 $11,287,734 12.74% 12.02% 2019 0.13917% $1,284,638 $9,483,774 13.55% 10.56% 2018 0.13799% $1,259,000 $9,291,985 13.55% 9.51% 2017 0.12298% $1,120,000 $7,937,681 14.11% 8.03%
Covered
82
Supplementary Information Schedule of Employer Contributions Health Insurance Credit Program (HIC) For the Years Ended June 30, 2013 through 2022 Date Contractually Required Contribution Contribution in Relation to Contractually Required Contribution Contribution Deficiency (Excess) Employer’s Covered Payroll Contributions as a % of Covered Payroll 2022 $161,461 $161,461 $ - $14,416,169 1.12% 2021 $137,731 $137,731 $ - $12,297,449 1.12% 2020 $132,066 $132,066 $ - $11,287,734 1.17% 2019 $110,961 $110,961 $ - $9,483,774 1.17% 2018 $109,645 $109,645 $ - $9,291,985 1.18% 2017 $93,665 $93,665 $ - $7,937,681 1.18% 2016 $80,594 $80,594 $ - $7,675,614 1.05% 2015 $81,333 $81,333 $ - $7,745,983 1.05% 2014 $73,494 $73,494 $ - $7,349,371 1.00% 2013 $74,599 $74,599 $ - $7,459,946 1.00%
Required
Health Insurance Credit Program (HIC)
Notes to Required Supplementary Information for the Year Ended June 30, 2022
Changes of benefit terms – There have been no actuarially material changes to the System benefit provisions since the prior actuarial valuation.
Changes of assumptions – The actuarial assumptions used in the June 30, 2020 valuation were based on the results of an actuarial experience study for the period from July 1, 2016 through June 30, 2020, except the change in the discount rate, which was based on VRS Board action effective as of July 1, 2019. Changes to the actuarial assumptions as a result of the experience study and VRS Board action are as follows:
General State Employees:
Mortality Rates (Pre-retirement, post-retirement healthy, and disabled)
Retirement Rates
Withdrawal Rates
SPORS Employees:
Mortality Rates (Pre-retirement, post-retirement healthy, and disabled)
Retirement Rates
Withdrawal Rates
Update to PUB2010 public sector mortality tables. For future mortality improvements, replace load with a modified Mortality Improvement Scale MP-2020
Adjusted rates to better fit experience for Plan 1; set separate rates based on experience for Plan2/Hybrid; changed final retirement age from 75 to 80 for all
Adjusted rates to better fit experience at each year age and service through 9 years of service
Update to PUB2010 public sector mortality tables. For future mortality improvements, replace load with a modified Mortality Improvement Scale MP-2020
Increased rates for ages 55 to 61, 63, and 64 with 26 or more years of service; changed final retirement age from 65 to 70
Decreased rate for 0 years of service and increased rates for 1 to 6 years of service
83
Disability Rates No change Salary Scale No change Line of Duty Disability No change Discount Rate No change
Disability Rates No change Salary Scale No change Line of Duty Disability No change Discount Rate No change
Health Insurance Credit Program (HIC)
Notes to Required Supplementary Information for the Year Ended June 30, 2022
VaLORS Employees:
Mortality Rates (Pre-retirement, post-retirement healthy, and disabled)
Retirement Rates
Withdrawal Rates
Update to PUB2010 public sector mortality tables. For future mortality improvements, replace load with a modified Mortality Improvement Scale MP-2020
Increased rates at some younger ages, decreased at age 62, and changed final retirement age from 65 to 70
Adjusted rates to better fit experience at each year age and service through 9 years of service
JRS Employees:
Mortality Rates (Pre-retirement, post-retirement healthy, and disabled)
Review separately from State employees because exhibit fewer deaths. Update to PUB2010 public sector mortality tables. For future mortality improvements, replace load with a modified Mortality Improvement Scale MP-2020 Retirement
Decreased
for ages 60-66 and 70-72
84
Disability Rates No change Salary Scale No change Line of Duty Disability No change Discount Rate No change
Withdrawal Rates No change Disability Rates No change Salary Scale Reduce increases across all ages by 0.50% Discount Rate No change
Rates
rates
Required Supplementary Information
Schedule of Employer's Share of Net OPEB Liability Group Life Insurance Program (GLI) For the Measurement Dates of June 30, 2017 through 2021
Schedule is intended to show information for 10 years. Since 2021 is the fifth year for this presentation, there are only five years available. However, additional years will be included as they become available.
85
Employer’s Proportion of the Net GLI OPEB Liability (Asset) Employer’s Proportionate Share of the Net GLI OPEB Liability (Asset) Employer’s Covered Payroll Employer’s Proportionate Share of the Net GLI OPEB Liability (Asset) as a Percentage of its Covered Payroll Plan Fiduciary Net Position as a Percentage of the Total GLI OPEB Liability 2021 0.05958% $693,673 $12,302,032 5.64% 67.45% 2020 0.05489% $916,024 $11,296,900 8.11% 52.64% 2019 0.04875% $793,292 $9,556,475 8.30% 52.00% 2018 0.04940% $750,000 $9,394,198 7.98% 51.22% 2017 0.04314% $649,000 $7,948,514 8.17% 48.86%
86
Employer Contributions
Insurance
Date Contractually Required Contribution Contribution in Relation to Contractually Required Contribution Contribution Deficiency (Excess) Employer’s Covered Payroll Contributions as a % of Covered Payroll 2022 $78,144 $78,144 $ - $14,471,169 0.54% 2021 $66,431 $66,431 $ - $12,302,032 0.54% 2020 $58,744 $58,744 $ - $11,296,900 0.52% 2019 $49,695 $49,695 $ - $9,556,475 0.52% 2018 $48,850 $48,850 $ - $9,394,198 0.52% 2017 $41,332 $41,332 $ - $7,948,514 0.52% 2016 $36,876 $36,876 $ - $7,682,448 0.48% 2015 $37,181 $37,181 $ - $7,745,983 0.48% 2014 $35,277 $35,277 $ - $7,349,371 0.48% 2013 $35,839 $35,839 $ - $7,466,468 0.48%
Required Supplementary Information Schedule of
Group Life
Program For the Years Ended June 30, 2013 through 2022
Group Life Insurance Program
Notes to Required Supplementary Information for the Year Ended June 30, 2022
Changes of benefit terms – There have been no actuarially material changes to the System benefit provisions since the prior actuarial valuation.
Changes of assumptions – The actuarial assumptions used in the June 30, 2020 valuation were based on the results of an actuarial experience study for the period from July 1, 2016 through June 30, 2020, except the change in the discount rate, which was based on VRS Board action effective as of July 1, 2019. Changes to the actuarial assumptions as a result of the experience study and VRS Board action are as follows:
General State Employees:
Mortality Rates (Pre-retirement, post-retirement healthy, and disabled)
Retirement Rates
Withdrawal Rates
Teachers:
Mortality Rates (Pre-retirement, post-retirement healthy, and disabled)
Retirement Rates
Withdrawal Rates
Update to PUB2010 public sector mortality tables. For future mortality improvements, replace load with a modified Mortality Improvement Scale MP-2020
Adjusted rates to better fit experience for Plan 1; set separate rates based on experience for Plan 2/Hybrid; changed final retirement age from 75 to 80 for all
Adjusted rates to better fit experience at each year age and service through 9 years of service
Update to PUB2010 public sector mortality tables. For future mortality improvements, replace load with a modified Mortality Improvement Scale MP-2020
Adjusted rates to better fit experience for Plan 1; set separate rates based on experience for Plan2/Hybrid; changed final retirement age from 75 to 80 for all
Adjusted rates to better fit experience at each year age and service through 9 years of service
87
Disability Rates No change Salary Scale No change Line of Duty Disability No change Discount Rate No change
Disability Rates No change Salary Scale No change Discount Rate No change
Group Life Insurance Program
Notes to Required Supplementary Information for the Year Ended June 30, 2022
SPORS Employees:
Mortality Rates (Pre-retirement, post-retirement healthy, and disabled)
Retirement Rates
Withdrawal Rates
VaLORS Employees:
Mortality Rates (Pre-retirement, post-retirement healthy, and disabled)
Retirement Rates
Withdrawal Rates
JRS Employees:
Mortality Rates (Pre-retirement, post-retirement healthy, and disabled)
Update to PUB2010 public sector mortality tables. For future mortality improvements, replace load with a modified Mortality Improvement Scale MP-2020
Increased rates for ages 55 to 61, 63, and 64 with 26 or more years of service; changed final retirement age from 65 to 70
Decreased rate for 0 years of service and increased rates for 1 to 6 years of service
Update to PUB2010 public sector mortality tables. For future mortality improvements, replace load with a modified Mortality Improvement Scale MP-2020
Increased rates at some younger ages, decreased at age 62, and changed final retirement age from 65 to 70
Adjusted rates to better fit experience at each year age and service through 9 years of service
Retirement Rates
Review separately from State employees because exhibit fewer deaths. Update to PUB2010 public sector mortality tables. For future mortality improvements, replace load with a modified Mortality Improvement Scale MP-2020
Decreased rates for ages 60-66 and 70-72
88
Disability Rates No change Salary Scale No change Line of Duty Disability No change Discount Rate No change
Disability Rates No change Salary Scale No change Line of Duty Disability No change Discount Rate No change
Withdrawal Rates No change Disability Rates No change Salary Scale Reduce increases across all ages by 0.50% Discount Rate No change
Group Life Insurance Program
Notes to Required Supplementary Information for the Year Ended June 30, 2022
Largest Ten Locality Employers – General Employees:
Mortality Rates (Pre-retirement, post-retirement healthy, and disabled)
Retirement Rates
Withdrawal Rates
Update to PUB2010 public sector mortality tables. For future mortality improvements, replace load with a modified Mortality Improvement Scale MP-2020
Adjusted rates to better fit experience for Plan 1; set separate rates based on experience for Plan2/Hybrid; changed final retirement age from 75 to 80 for all
Adjusted rates to better fit experience at each age and service decrement through 9 years of service
Non-Largest Ten Locality Employers – General Employees:
Mortality Rates (Pre-retirement, post-retirement healthy, and disabled)
Retirement Rates
Withdrawal Rates
Update to PUB2010 public sector mortality tables. For future mortality improvements, replace load with a modified Mortality Improvement Scale MP-2020
Adjusted rates to better fit experience for Plan 1; set separate rates based on experience for Plan2/Hybrid; changed final retirement age from 75 to 80 for all
Adjusted rates to better fit experience at each age and service decrement through 9 years of service
89
Disability Rates No change Salary Scale No change Line of Duty Disability No change Discount Rate No change
Disability Rates No change Salary Scale No change Line of Duty Disability No change Discount Rate No change
Group Life Insurance Program
Notes to Required Supplementary Information for the Year Ended June 30, 2022
Largest Ten Locality Employers – Hazardous Duty Employees:
Mortality Rates (Pre-retirement, post-retirement healthy, and disabled)
Retirement Rates
Update to PUB2010 public sector mortality tables. Increased disability life expectancy. For future mortality improvements, replace load with a modified Mortality Improvement Scale MP-2020
Adjusted rates to better fit experience and changed final retirement age from 65 to 70
Non-Largest Ten Locality Employers – Hazardous Duty Employees:
Mortality Rates (Pre-retirement, post-retirement healthy, and disabled)
Retirement Rates
Withdrawal Rates
Update to PUB2010 public sector mortality tables. Increased disability life expectancy. For future mortality improvements, replace load with a modified Mortality Improvement Scale MP-2020
Adjusted rates to better fit experience and changed final retirement age from 65 to 70
Decreased rates and changed from rates based on age and service to rates based on service only to better fit experience and to be more consistent with Locals Top 10 Hazardous Duty
90
Withdrawal Rates Decreased rates Disability Rates No change Salary Scale No change Line of Duty Disability No change Discount Rate No change
Disability Rates No change Salary Scale No change Line of Duty Disability No change Discount Rate No change
For the Measurement Dates of June 30, 2017 through 2021
Schedule is intended to show information for 10 years. Since 2021 is the fifth year for this presentation, there are only five years available. However, additional years will be included as they become available.
91
Insurance
(VSDP)
Employer’s Proportion of the Net VSDP OPEB Asset Employer’s Proportionate Share of the Net VSDP OPEB Asset Employer’s Covered Payroll Employer’s Proportionate Share of the Net VSDP OPEB Asset as a Percentage of its Covered Payroll Plan Fiduciary Net Position as a Percentage of the Total VSDP OPEB Liability 2021 0.27681% $954,220 $11,963,926 7.98% 229.01% 2020 0.25250% $557,238 $10,941,815 5.09% 181.88% 2019 0.22412% $439,713 $9,071,488 4.85% 167.18% 2018 0.22545% $508,000 $8,891,622 5.71% 194.74% 2017 0.20066% $412,000 $7,561,543 5.45% 186.63%
Required Supplementary Information Schedule of Employer's Share of Net OPEB Asset Disability
Program
92
Schedule of Employer Contributions Disability Insurance Program (VSDP) For the Years Ended June 30, 2013 through 2022 Date Contractually Required Contribution Contribution in Relation to Contractually Required Contribution Contribution Deficiency (Excess) Employer’s Covered Payroll Contributions as a % of Covered Payroll 2022 $85,751 $85,751 $ - $14,057,482 0.61% 2021 $72,980 $72,980 $ - $11,963,926 0.61% 2020 $67,839 $67,839 $ - $10,941,815 0.62% 2019 $56,243 $56,243 $ - $9,071,488 0.62% 2018 $58,685 $58,685 $ - $8,891,622 0.66% 2017 $49,907 $49,907 $ - $7,561,543 0.66% 2016 $48,365 $48,365 $ - $7,327,940 0.66% 2015 $48,911 $48,911 $ - $7,410,796 0.66% 2014 $32,971 $32,971 $ - $7,015,051 0.47% 2013 $33,930 $33,930 $ - $7,219,081 0.47%
Required Supplementary Information
Disability Insurance Program
Notes to Required Supplementary Information for the Year Ended June 30, 2022
Changes of benefit terms – There have been no actuarially material changes to the System benefit provisions since the prior actuarial valuation.
Changes of assumptions – The actuarial assumptions used in the June 30, 2020 valuation were based on the results of an actuarial experience study for the period from July 1, 2016 through June 30, 2020, except the change in the discount rate, which was based on VRS Board action effective as of July 1, 2019. Changes to the actuarial assumptions as a result of the experience study and VRS Board action are as follows:
General State Employees:
Mortality Rates (Pre-retirement, post-retirement healthy, and disabled)
Retirement Rates
Withdrawal Rates
SPORS Employees:
Mortality Rates (Pre-retirement, post-retirement healthy, and disabled)
Retirement Rates
Withdrawal Rates
Update to PUB2010 public sector mortality tables. For future mortality improvements, replace load with a modified Mortality Improvement Scale MP-2020
Adjusted rates to better fit experience for Plan 1; set separate rates based on experience for Plan 2/Hybrid; changed final retirement age from 75 to 80 for all
Adjusted rates to better fit experience at each year age and service through 9 years of service
Update to PUB2010 public sector mortality tables. Increased disability life expectancy. For future mortality improvements, replace load with a modified Mortality Improvement Scale MP-2020
Increased rates for ages 55 to 61, 63, and 64 with 26 or more years of service and changed final retirement age from 65 to 70
Decreased rate for 0 years of service and increased rates for 1 to 6 years of service
93
Disability Rates No change Salary Scale No change Line of Duty Disability No change Discount Rate No change
Disability Rates No change Salary Scale No change Line of Duty Disability No change Discount Rate No change
Disability Insurance Program
Notes to Required Supplementary Information for the Year Ended June 30, 2022
VaLORS Employees:
Mortality Rates (Pre-retirement, post-retirement healthy, and disabled)
Retirement Rates
Withdrawal Rates
Update to PUB2010 public sector mortality tables. Increased disability life expectancy. For future mortality improvements, replace load with a modified Mortality Improvement Scale MP-2020
Increased rates at some younger ages, decreased at age 62, and changed final retirement age from 65 to 70
Adjusted rates to better fit experience at each year age and service through 9 years of service
94
Disability Rates No change Salary Scale No change Line of Duty Disability No change Discount Rate No change
Required Supplementary Information
Schedule of Employer's Share of Total OPEB Liability
Pre-Medicare Retiree Healthcare Program For the Measurement Dates of June 30, 2017 through 2021
Schedule is intended to show information for 10 years. Since 2021 is the fifth year for this presentation, only five years of data is available. However, additional years will be included as they become available.
95
Employer’s Proportion of the collective total
Employer’s Proportionate Share of the collective total OPEB Liability Employer’s CoveredEmployee Payroll Employer’s Proportionate Share of the collective total OPEB liability as a Percentage of its CoveredEmployee Payroll 2021 0.14837% $666,017 $13,090,628 5.09% 2020 0.13618% $774,602 $11,832,283 6.55% 2019 0.12269% $832,916 $10,095,487 8.25% 2018 0.12969% $1,304,233 $9,358,038 13.94% 2017 0.11875% $1,542,480 $7,945,015 19.41%
OPEB Liability
Pre-Medicare Retiree Healthcare Program
Notes to Required Supplementary Information for the Year Ended June 30, 2022
There are no assets accumulated in a trust to pay related benefits.
Changes of benefit terms – There have been no changes to the benefit provisions since the prior actuarial valuation.
Changes of assumptions – The following actuarial assumptions were updated since the June 30, 2020 valuation based on recent experience:
Retiree Participation Reduced the rate from 45% to 40%
Spousal coverage and retiree participation were based on a blend of recent experience and the prior year assumptions. The mortality table has been updated from adjusted RP-2014 mortality tables using Scale BB to adjusted Pub-2010 Headcount-Weighted mortality tables projected generationally with modified MP-2021 Improvement Scales.
No excise tax has been reflected due to the SECURE Act. Among the provisions was a repeal of three taxes and fees that were originally intended to help fund the Affordable Care Act (ACA): i) the excise tax on high-cost health plans (Cadillac tax); ii) the annual fee on health insurance providers; and iii) the medical device excise tax.
The trend rates were updated based on economic conditions as of June 30, 2021. Additionally, the discount rate was decreased from 2.21% to 2.16% based on the Bond Buyers GO 20 Municipal Bond index as of June 30, 2022.
96
The Honorable Glenn Youngkin Governor of Virginia
February 17, 2023
Board of Directors Virginia Economic Development Partnership
INDEPENDENT AUDITOR’S REPORT
Report on Audit of the Financial Statements

Opinions
We have audited the financial statements of the governmental activities and each major fund of the Virginia Economic Development Partnership (Partnership), a component unit of the Commonwealth of Virginia, as of and for the year ended June 30, 202 2, and the related notes to the financial statements, which collectively comprise the Partnership’s basic financial statements as listed in the table of contents.
In our opinion, the accompanying financial statements referred to above present fairly, in all material respects, the respective financial position of the governmental activities and each major fund of the Partnership as of June 30, 2022, and the respective changes in financial position and the budgetary comparison for the General Fund and Special Revenue Fund for the year then ended, in accordance with accounting principles generally accepted in the United States of America.
Basis for Opinions
We conducted our audit in accordance with auditing standards generally accepted in the United States of America (GAAS) and the standards applicable to financial audits contained in Government Auditing Standards issued by the Comptroller General of the Unit ed States (Government Auditing Standards). Our responsibilities under those standards are further described in the Auditor’s Responsibilities for the Audit of the Financial Statements section of our report. We are required to be independent of the Partne rship, and to meet our other ethical responsibilities, in accordance with the relevant ethical requirements relating to our audit. We believe that the audit evidence we have obtained is sufficient and appropriate to provide a basis for our audit opinion s
www.apa.virginia.gov | (804) 225-3350 | reports@apa.virginia.gov
Joint Legislative Audit and Review Commission
97
Emphasis of Matter Change in Accounting Principle
As discussed in Notes 6 and 7 of the accompanying financial statements, the Partnership implemented Governmental Accounting Standards Board Statement No. 87, Leases. Net capital assets and lease liabilities have been restated in Notes 6 and 7 of the accompanying financial statements, respectively, to reflect the provisions of this standard. Our opinions are not modified with respect to this matter.
Responsibilities of Management for the Financi al Statements
Management is responsible for the preparation and fair presentation of the financial statements in accordance with accounting principles generally accepted in the United States of America, and for the design, implementation, and maintenance of internal control relevant to the preparation and fair presentation of financial statements that are free from material misstatement, whether due to fraud or error.
In preparing the financial statements, management is required to evaluate whether there are conditions or events, considered in the aggregate, that raise substantial doubt about the Partnership’s ability to continue as a going concern for twelve months beyond the financial statement date, including any currently known information that may raise substantial doubt shortly thereafter.
Auditor’s Responsibilities for the Audit of the Financial Statements
Our objectives are to obtain reasonable assurance about whether the financial statements as a whole are free from material misstatement, whether due to fraud or error, and to issue an auditor’s report that includes our opinion s. Reasonable assurance is a high level of assurance but is not absolute assurance and therefore is not a guarantee that an audit conducted in accordance with GAAS and Government Auditing Standards will always detect a material misstatement when it exists. The risk of not detecting a material misstatement resulting from fraud is higher th an for one resulting from error, as fraud may involve collusion, forgery, intentional omissions, misrepresentations, or the override of internal control. Misstatements are considered material if there is a substantial likelihood that, individually or in the aggregate, they would influence the judgment made by a reasonable user based on the financial statements.
In performing an audit in accordance with GAAS and Government Auditing Standards ,
we:
• Exercise professional judgment and maintain professional skepticism throughout the audit.
• Identify and assess the risks of material misstatement of the financial statements, whether due to fraud or error, and design and perform audit procedures responsive to those risks. Such procedures include examining, on a test basis, evidence regarding the amounts and disclosures in the financial statements.
98
• Obtain an understanding of internal control relevant to the audit in order to design audit procedures that are appropriate in the circumstances, but not for the purpose of expressing an opinion on the effectiveness of the Partnership’s internal control. Accordingly, no such opinion is expressed.
• Evaluate the appropriateness of accounting policies used and the reasonableness of significant accounting estimates made by management, as well as evaluate the overall presentation of the financial statements.
• Conclude whether, in our judgement, there are conditions or events, considered in the aggregate, that raise substantial doubt about the Partnership’s ability to continue as a going concern for a reasonable period of time.
We are required to communicate with those charged with governance regarding, among other matters, the planned scope and timing of the audit, significant audit findings, and certain internal control-related matters that we identified during the audit.
Required Supplementary Information
Accounting principles generally accepted in the United States of America require that the following be presented to supplement the basic fina ncial statements: Management’s Discussion and Analysis on pages 3 through 8; the Schedule of Employer’s Share of Net Pension Liability, the Schedule of Employer Contributions, and the Notes to Required Supplementary Information on pages 78 through 80; the Schedule of Employer’s Share of Net OPEB Liability, the Schedule of Employer’s Share of Net OPEB Asset, the Schedule of Employer Contributions, and the Notes to Required Supplementary Information for the Health Insurance Credit, Group Life Insurance, and Disability Insurance programs on pages 81 through 94; the Schedule of Employer’s Share of Total OPEB Liability and the Notes to Required Supplementary Information for the Pre-Medicare Retiree Healthcare program on pages 95 through 96. Such information is the responsibility of management and, although not a part of the basic financial statements, is required by the Governmental Accounting Standards Board who considers it to be an essential part of financial reporting for placing the basic financial sta tements in an appropriate operational, economic, or historical context. We have applied certain limited procedures to the required supplementary information in accordance with auditing standards generally accepted in the United States of America, which co nsisted of inquiries of management about the methods of preparing the information and comparing the information for consistency with management’s responses to our inquiries, the basic financial statements, and other knowledge we obtained during our audit o f the basic financial statements. We do not express an opinion or provide any assurance on the information because the limited procedures do not provide us with sufficient evidence to express an opinion or provide any assurance.
Other Information
Management is responsible for the other information included in the annual report. The other information comprises the sections titled Who We Are, Our Partners, Leadership Message, Impact
99
Metrics, Features, Project Case Studies , and Progress Reports, but does not include the basic financial statements and our auditor’s report thereon . Our opinion s on the basic financial statements do not cover the other information, and we do not express an opinion or any form of assurance there on.
In connection with our audit of the basic financial statements, our responsibility is to read the other information and consider whether a material inconsistency exists between the other information and the basic financial statements, or the other i nformation otherwise appears to be materially misstated. If, based on the work performed, we conclude that an uncorrected material misstatement of the other information exists, we are required to describe it in our report.
Other Reporting Required by Government Auditing Standards
In accordance with Government Auditing Standards , we have also issued our report dated February 17, 2023, on our consideration of the Partnership’s internal control over financial reporting and on our tests of its compliance with certain provisions of laws, regulations, contracts, grant agreements, and other matters. The purpose of that report is to describe the scope of our test ing of internal control over financial reporting and compliance and the results of that testing, and not to provide an opinion on the effectiveness of internal control over financial reporting or on compliance. That report is an integral part of an audit performed in accordance with Government Auditing Standards in considering the Partnership’s internal control over financial reporting and compliance
Staci A. Henshaw AUDITOR OF PUBLIC ACCOUNTS
LCW/vks
100
Belle Isle State Park in Lancaster County is just one of many water recreation destinations on the Northern Neck. The park has 7 miles of shoreline on the Rappahannock River to go with numerous hiking, biking, and horse trails.

Expertise • Collaboration
Innovation • Solutions
The Virginia Economic Development Partnership’s team of dedicated and knowledgeable professionals is committed to Virginia’s economic success, and connects industry-leading businesses to the resources they need to make relocations and expansions successful.
From site selection, customized research, cost analysis, and coordination with public and private partners, to discretionary incentives and workforce solutions, VEDP’s services are tailored to companies’ unique requirements.
To learn more about VEDP’s expertise and resources, visit VEDP.org.
© October 2022
•
