
2024 REAL ESTATE FORECAST KEVIN KROPP VANGUARD PROPERTIES Sales Manager | Castro Office 415.606.1415 DRE#01413211
2023 was a bumpy year. Early in 2023 there was lots of promise and hope. By mid-year, we were talking about the September market and hoped for some growth in the fall market. By October and November, we were sludging through what was likely the bottom of the market. Sales were down, interest rates were up and the war in Ukraine was on people’s minds.
Although the war is still on going, we have lots of news to distract us. I’m personally expecting moderate growth in 2024 with a few bumps along the way. Interest rates are expected to flatten and possibly drop slightly later this year. Inflation is on everyone’s mind and the 10-year treasury bill has ticked up since early February which isn’t good for interest rates.
The biggest thing we are lacking in the market today, is consumer confidence. I am speaking to many clients that love a home, the price and costs make sense but they can’t pull the trigger. I have heard, “I love it and can afford, but why am I the only one?” People feel better in the crowd. There is a safety there but Warren Buffet follows the investment principle of Being Bold when other are Fearful! That is exactly the market we are in.
There is an opportunity to build generational wealth because many properties are discounted today. Good properties that are presented well are still selling at solid pricing, but the market isn’t supporting crazy prices for homes that need a tremendous amount of work. The rental market is firming and showing signs of growth making investment properties more attractive. In multi-units, we saw some amazing deals! 2762-2764 24th Street in the Inner Mission traded at $372.05 per sq/ft while 1754-1756 Waller St in Duboce Triangle traded at $1,124.03 per sq/ft.
People want properties that are updated so if you are thinking about a remodel, I think you should do it. Improving your property for yourself is much better than making it beautiful for someone else in my opinion. I often go into homes and do painting, refinish floors, change light fixtures, change counters and install new light fixtures. We then add staging and landscaping to present a beautiful product. I believe the beautiful product should be for you to enjoy. To that end, I am about to start work to add decks on the rear of my property at a significant cost, but I feel good about making a home that I love for me. It will payoff should I ever sell but more importantly I get to enjoy the investment. Why make it pretty for someone else? For example, there is over a $700 swing in price between updated and original properties in the single family home market. 115 Allison St in Crocker Amazon traded at $303.29 per sq/ft and 2126 41st Ave in Outer Parkside traded at 506.75 per sq/ft while 651 41st Ave in the Outer Richmond traded at $1,066.10 per sq/ft. In the condo market, 1065 Caroline St in Potrero Hill traded at just $560.80 per sq/ft while 1 Steuart Ln #1006, new construction in South Beach traded at $2,909.34 per sq/ft!
There is opportunity if every market. It is my job to help you find the opportunity that is right for you. Please don’t hesitate to reach out with any questions. I am committed to be your realtor for life and I am always here for any and all of your Real Estate needs.
Sincerely,
KEVIN KROPP , Sales Manager, Castro Office | Broker Associate 415.606.1415 | kevin@vanguardsf.com | kevinsfhomes.com
2023 IS OVER AND WHAT WE SHOULD EXPECT IN 2024!
THANKFULLY
| DRE#01413211
WHAT’S IN STORE FOR 2024?

According to the South China morning press, those born under this sign are said to have charisma, confidence, intelligence and luck. The Wood Dragon year 2024, when combined with the nourishing Wood element, will bring evolution, improvement, and abundance; it is the perfect time for rejuvenated beginnings and setting the foundation for long-term success.
This year combines the heavenly stem “Jia” – which represents yang wood – and the earthly branch “Chen” which represents the Dragon. That makes 2024 the Year of the Wood Dragon. Depending on your sign, this could be a year of luck, fortune or a time to save for more prosperous days. Each sign corresponds to lucky days in each month. See below for your lucky days!!!
RAT - Lucky date for Rats are the 4th, 13th, and 30th of each month in the Chinese lunar calendar.
OX - Lucky date for Oxen are the 6th, 9th, and 20th of each month in the Chinese lunar calendar.
TIGER - Lucky date for Tigers are the 8th, 10th, and 26th of each month in the Chinese lunar calendar.
RABBIT - Lucky date for Rabbits are the 9th, 13th, and 28th of each month in the Chinese lunar calendar.
DRAGON - Lucky date for Dragons are the 1st, 16th, and 27th of each month in the Chinese lunar calendar.
SNAKE - Lucky days for Snakes are the 1st, 10th, and 16th of each month in the Chinese lunar calendar.
HORSE - Lucky date for Horses are the 3rd, 9th, and 19th of each month in the Chinese lunar calendar.
RAM - Lucky days for Goats are the 7th, 12th, and 26th of each month in the Chinese lunar calendar.
MONKEY - Lucky date for Monkeys are the 4th, 14th, and 28th of each month in the Chinese lunar calendar.
ROOSTER - Lucky date for Roosters are the 6th, 14th, and 28th of each month in the Chinese lunar calendar.
DOG - Lucky date for Dogs are the 7th, 11th, and 28th of each month in the Chinese lunar calendar.
PIG - Lucky date for Pigs are the 10th, 15th, and 25th of each month in the Chinese lunar calendar.
ECONOMIC NEWS
INFLATION HEATS UP
Consumer prices rose 0.3% from December 2023, up 3.1% from 12 months ago. Stripping out volatile gas and food, “core” prices were up 3.9% since January 2023. Markets are dialing back expectations of eminent rate cuts, now pricing in an 80% the Federal Reserve keeps current baseline interest rates until June.
NOT ALL BAD
Supply chain issues during Covid lockdowns caused many physical goods to see price increases, which are now declining. But besides furniture, clothing, electronics and toys, other goods and services with rapidly deflating price tags include eggs, apples, gasoline, health insurance, car rental, airfare, and college textbooks.
INVESTORS FEEL BULLISH
Driven by positive economic data and reduced recession fears, a monthly index of fund managers investment sentiment surged to 4.1 in February, its highest level since January 2022. Despite optimism about stock market prospects in 2024, caution exists due to high valuations and potential risks.
HOUSING NEWS
HOUSING PROPS UP INFLATION
Shelter costs continue to put upward pressure on so-called “core” inflation, accounting for over two-thirds of the total increase. Without more housing supply, the Fed has limited tools to effectively curb housing inflation, and will likely hold on rate cuts until the second half of the year.
BUILDERS FEEL BETTER
Builder sentiment improved in February with expectations of declining mortgage rates and potential rate cuts. Buyer traffic increased. Builders are optimistic about singlefamily starts, although concerns about lot availability and labor shortages persist. Builder incentives and price cuts are decreasing.
LENDING STANDARDS EASE
The Fed’s survey of Senior Loan Officers in the fourth quarter of 2023 showed lending standards easing for commercial and residential real estate. Residential mortgage standards loosened notably, with increased demand across categories. Expectations of Fed cuts also improved lender sentiment.
REGULATORY NEWS
POLICY INFLUX
In January, the Fed said it did not expect to cut interest rates until it had “greater confidence” inflation is moving down toward the 2% target. Last week’s January consumer inflation data came in hot compared with expectations, causing many economists and traders to push their forecast of the Fed’s first rate cut until June or later.
STABLE OUTLOOKS
Americans’ inflation outlooks stayed stable at year’s end. mirroring pre-pandemic levels. A survey by the Fed of New York showed consistent projections for consumer goods and services and credit access. Respondents expected home prices to rise by 3%, with mixed views on the state of the job market.
DODD-FRANK DO-OVER
Financial regulators are reconsidering a Dodd-Frank regulation on mortgage securitization after concerns about increased borrowing costs. A proposal to revise the rule focuses on defining “qualified residential mortgages” (QRMs) without a down payment requirement, aligning with CFPB standards. Comments are due Oct. 30.
THIS WEEK IN HISTORY
2008: Fidel Castro resigns the presidency of Cuba on Feb. 19.
2001: Stock car legend Dale Earnhardt dies Feb. 18, after crashing at the Daytona 500.
1997: NBC airs “Schindler’s List” completely uncensored Feb.23.
1997: Scottish scientists announce they have successfully cloned a sheep on Feb. 22.
1968: Civil rights leader Malcolm X is assassinated Feb 21 in New York City.
1962: On Feb. 20, John Glenn is the first American to orbit Earth aboard Friendship 7.
1954: Mass polio inoculations for children begin Feb. 23 in Pittsburgh, PA.
1953: The first 3-D movie, “Bwana Devil” opens in U.S. theaters Feb. 18.
1896: The Tootsie Roll candy is introduced Feb. 23.
1848: Karl Marx and Friederich Engels publish “The Communist Manifesto” on Feb. 21.
CA PROP 10 REPEAL OF RENT CONTROL LAWS
WHAT THE MEASURE WOULD DO
California Proposition 10 would repeal the 1995 Costa-Hawkins Rental Housing Act,1 a state law that restricts local rent control laws. Cities use rent control to regulate the rent, or the increases in rent, that landlords can charge. According to the Terner Center for Housing Innovation, 15 of California’s 482 jurisdictions currently have some form of rent control, which covers 25 percent of the state’s rental units.
California cities currently have the ability to pass rent control ordinances. The Costa-Hawkins Act restricts those laws in the following ways:
• Exempts from rent control all housing units built after February 1, 1995, as well as all singlefamily homes and all condominiums.
• For cities that had rent control ordinances when Costa-Hawkins passed, retains their existing exemption dates instead of 1995. For example, the only units in San Francisco and San Jose that can fall under rent control are those that were built prior to 1979, when those cities passed rent control ordinances; in Oakland, the threshold year is 1983.
• Prohibits cities from controlling rent levels upon turnover of a unit (known as “vacancy control”). When a tenant moves out of a rent-controlled unit, the city must allow the landlord to re-rent it at market rate.
Prop. 10 would remove these provisions from the state code and let cities impose any kind of rent control they choose.
In order to comply with previous state court rulings, Prop. 10 contains language that says cities and counties could not limit a landlord’s right to a fair rate of return on property. What exactly this would mean in practice is not yet clear.
This measure could be amended by the state legislature with a two-thirds vote if the amendments further the purposes of Prop. 10. Reinstating any portion of Costa-Hawkins would require going back to the voters for a majority vote.
For more information: https://www.spur.org/voter-guide/2018-11/ca-prop-10-repeal-rentcontrol-rules

Recent Posts SFAR 2024 Homeownership Voter Guide | Vote on March 5, 2024 Search
SUMMARY FROM NAR ECONOMIC FORECAST FOR 2024 FROM CHIEF ECONOMIST LAWRENCE YUN
• Interest Rates Some relief expected in 2024 providing additional buying power
• Expecting increase in inventory later this year
• Builders are bullish and pricing firming up on new constructions
• Home Sales down 18%
• Commercial is expected to pick up due to lower interest rates and better SBA products
• Office space still has very high vacancy rate plus high shadow inventory (rented but unused space expected to come back to the market)
• We are seeing big and tech companies requiring employees back to work 3 to 4 days a work
• Relevant data point…10 year treasury yield is the benchmark for Interest rates. We want a decline for better rates.
• We currently have a 5.5 million unit shortage in inventory in the US creating more demand. This is largely due to underbuilding and delays due to zoning and permitting here SF and compounded further by the cost to build in the bay area. That means, in many cases, you cannot build a home for the price that you can buy one for in the current market.
INSTANT REACTION: HOUSING STARTS, FEBRUARY 16, 2024
By: Lawrence Yun, Chief Economist for the National Association of REALTORS ®
Housing starts collapsed in January. More snow than usual fell across parts of the country, but the seasonally adjusted data implies a continuing housing shortage ahead. Multifamily construction fell 37% from a year ago and has been one of the lowest monthly activities over the past decade. Rising apartment vacancy is not due to fewer renters but rather due to the oversupply of construction in the past three years. Developers are, therefore, pulling back, at least temporarily. Single-family home construction also fell by 5% from the prior month but remained above the key 1-million-unit mark. Ideally, single-family housing starts would be at 1.2 million, which would measurably help to relieve the housing shortage.
America greatly underproduced housing in the decade before COVID. That shortage is still lingering in the marketplace. The way to address the shortage is to incentivize construction. However, some localities are choosing the wrong policies, such as rent control, NIMBYism, and raising impact fees, which will make the shortage worse and raise housing costs in the long run.
https://www.nar.realtor/magazine/level-up/level-up-economic-forecast


September 20, 2023
C.A.R. releases its 2024 California Housing Market Forecast
California housing market will rebound in 2024 as mortgage rates ebb.
• Existing, single-family home sales are forecast to total 327,100 units in 2024, an increase of 22.9 percent from 2023’s projected pace of 266,200.
• California’s median home price is forecast to climb 6.2 percent to $860,300 in 2024, following a projected 1.5 percent decrease to $810,000 in 2023 from 2022’s $822,300.
• Housing affordability* is expected to remain flat at 17 percent next year from a projected 17 percent in 2023.
LOS ANGELES (Sept. 20) – Slower economic growth and cooling inflation will bring down mortgage interest rates in 2024 and create a more favorable market environment to spur California home sales next year, according to a housing and economic forecast released today by the CALIFORNIA ASSOCIATION OF REALTORS® (C.A.R.).
The baseline scenario of C.A.R.’s “2024 California Housing Market Forecast” sees an increase in existing single-family home sales of 22.9 percent next year to reach 327,100 units, up from the projected 2023 sales figure of 266,200. The 2023 figure is 22.2 percent lower compared with the pace of 342,000 homes sold in 2022.
The California median home price is forecast to rise 6.2 percent to $860,300 in 2024, following a projected 1.5 percent dip to $810,000 in 2023 from $822,300 in 2022. A persistent housing shortage and a competitive housing market will continue to put upward pressure on home prices next year.
“2024 will be a better year for the California housing market for both buyers and sellers as mortgage interest rates are expected to decline next year,” said C.A.R. President Jennifer Branchini, a Bay Area REALTOR®. “A more favorable market environment with lower borrowing costs, coupled with an increase in available homes for sale, will motivate buyers and sellers to reenter the market next year. First-time buyers who were squeezed out by the highly competitive market in the last couple of years will try to attain their American dream next year. Repeat buyers who have overcome the “lock-in effect” will also return to the market as mortgage rates begin to trend down.”
C.A.R.’s 2024 forecast predicts the U.S. gross domestic product to edge up 0.7 percent in 2024, after a projected uptick of 1.7 percent in 2023. With California’s 2024 nonfarm job growth rate at 0.5 percent, up from a projected increase of 1.4 percent in 2023, the state’s unemployment rate will increase to 5.0 percent in 2024 from 2023’s projected rate of 4.6 percent. Inflation will continue its gradual decline over the next 18 months, with the CPI registering 2.6% in 2024, down from 3.9% in 2023. As such, the average 30-year, fixed mortgage interest rate will decline from 6.7 percent in 2023 but remain elevated at 6.0 percent in 2024. While next year’s projected average for the 30-year fixed mortgage interest rate will still be higher than the levels observed in the few years prior to the pandemic, it will be lower than the long-run average of nearly 8% in the past 50 years.
Housing supply in 2024 will remain below the norm despite a projected increase in active listings of between 10 percent to 20 percent, as market conditions and the lending environment continue to improve.
“With the economy expected to soften in 2024, the Federal Reserve Bank will begin loosening its monetary policy next year. Mortgage rates will trend down throughout 2024, and the average 30-year fixed rate mortgage could reach the mid-5% range by the end of next year,” said C.A.R. Senior Vice President and Chief Economist Jordan Levine. “Buyers will have more financial flexibility to purchase homes at higher prices, which could generate increased housing demand and result in more upward pressure on home prices.
FOR RELEASE
2024 CALIFORNIA HOUSING FORECAST
p=projected
f=forecasted
*% of households who can afford median-priced hosueholds
Leading the way ... ® in real estate news and information for more than 110 years, the CALIFORNIA ASSOCIATION OF REALTORS® (www.car.org) is one of the largest state trade organizations in the United States, with more than 200,000 members dedicated to the advancement of professionalism in real estate. C.A.R. is headquartered in Los Angeles.
2017 2018 2019 2020 2021 2022 2023 2024 SFH Resales (000s) 424.9 402.6 398 411.9 444.5 342 266.2 327.1 % Change 1.7% -5.2% -1.2% 3.5% 7.9% -23.1% -22.2% 22.9% Median Price ($000s) $537.9 $569.5 $592.4 $659.4 $786.8 $822.3 $810.0 $860.3 % Change 7.1% 5.9% 4.0% 11.3% 19.3% 4.5% -1.5% 6.2% Housing Affordability Index* 29% 28% 31% 32% 26% 19% 17% 17% 30-Year FRM 4.0% 4.5% 3.9% 3.1% 3.0% 5.3% 6.7% 6.0%
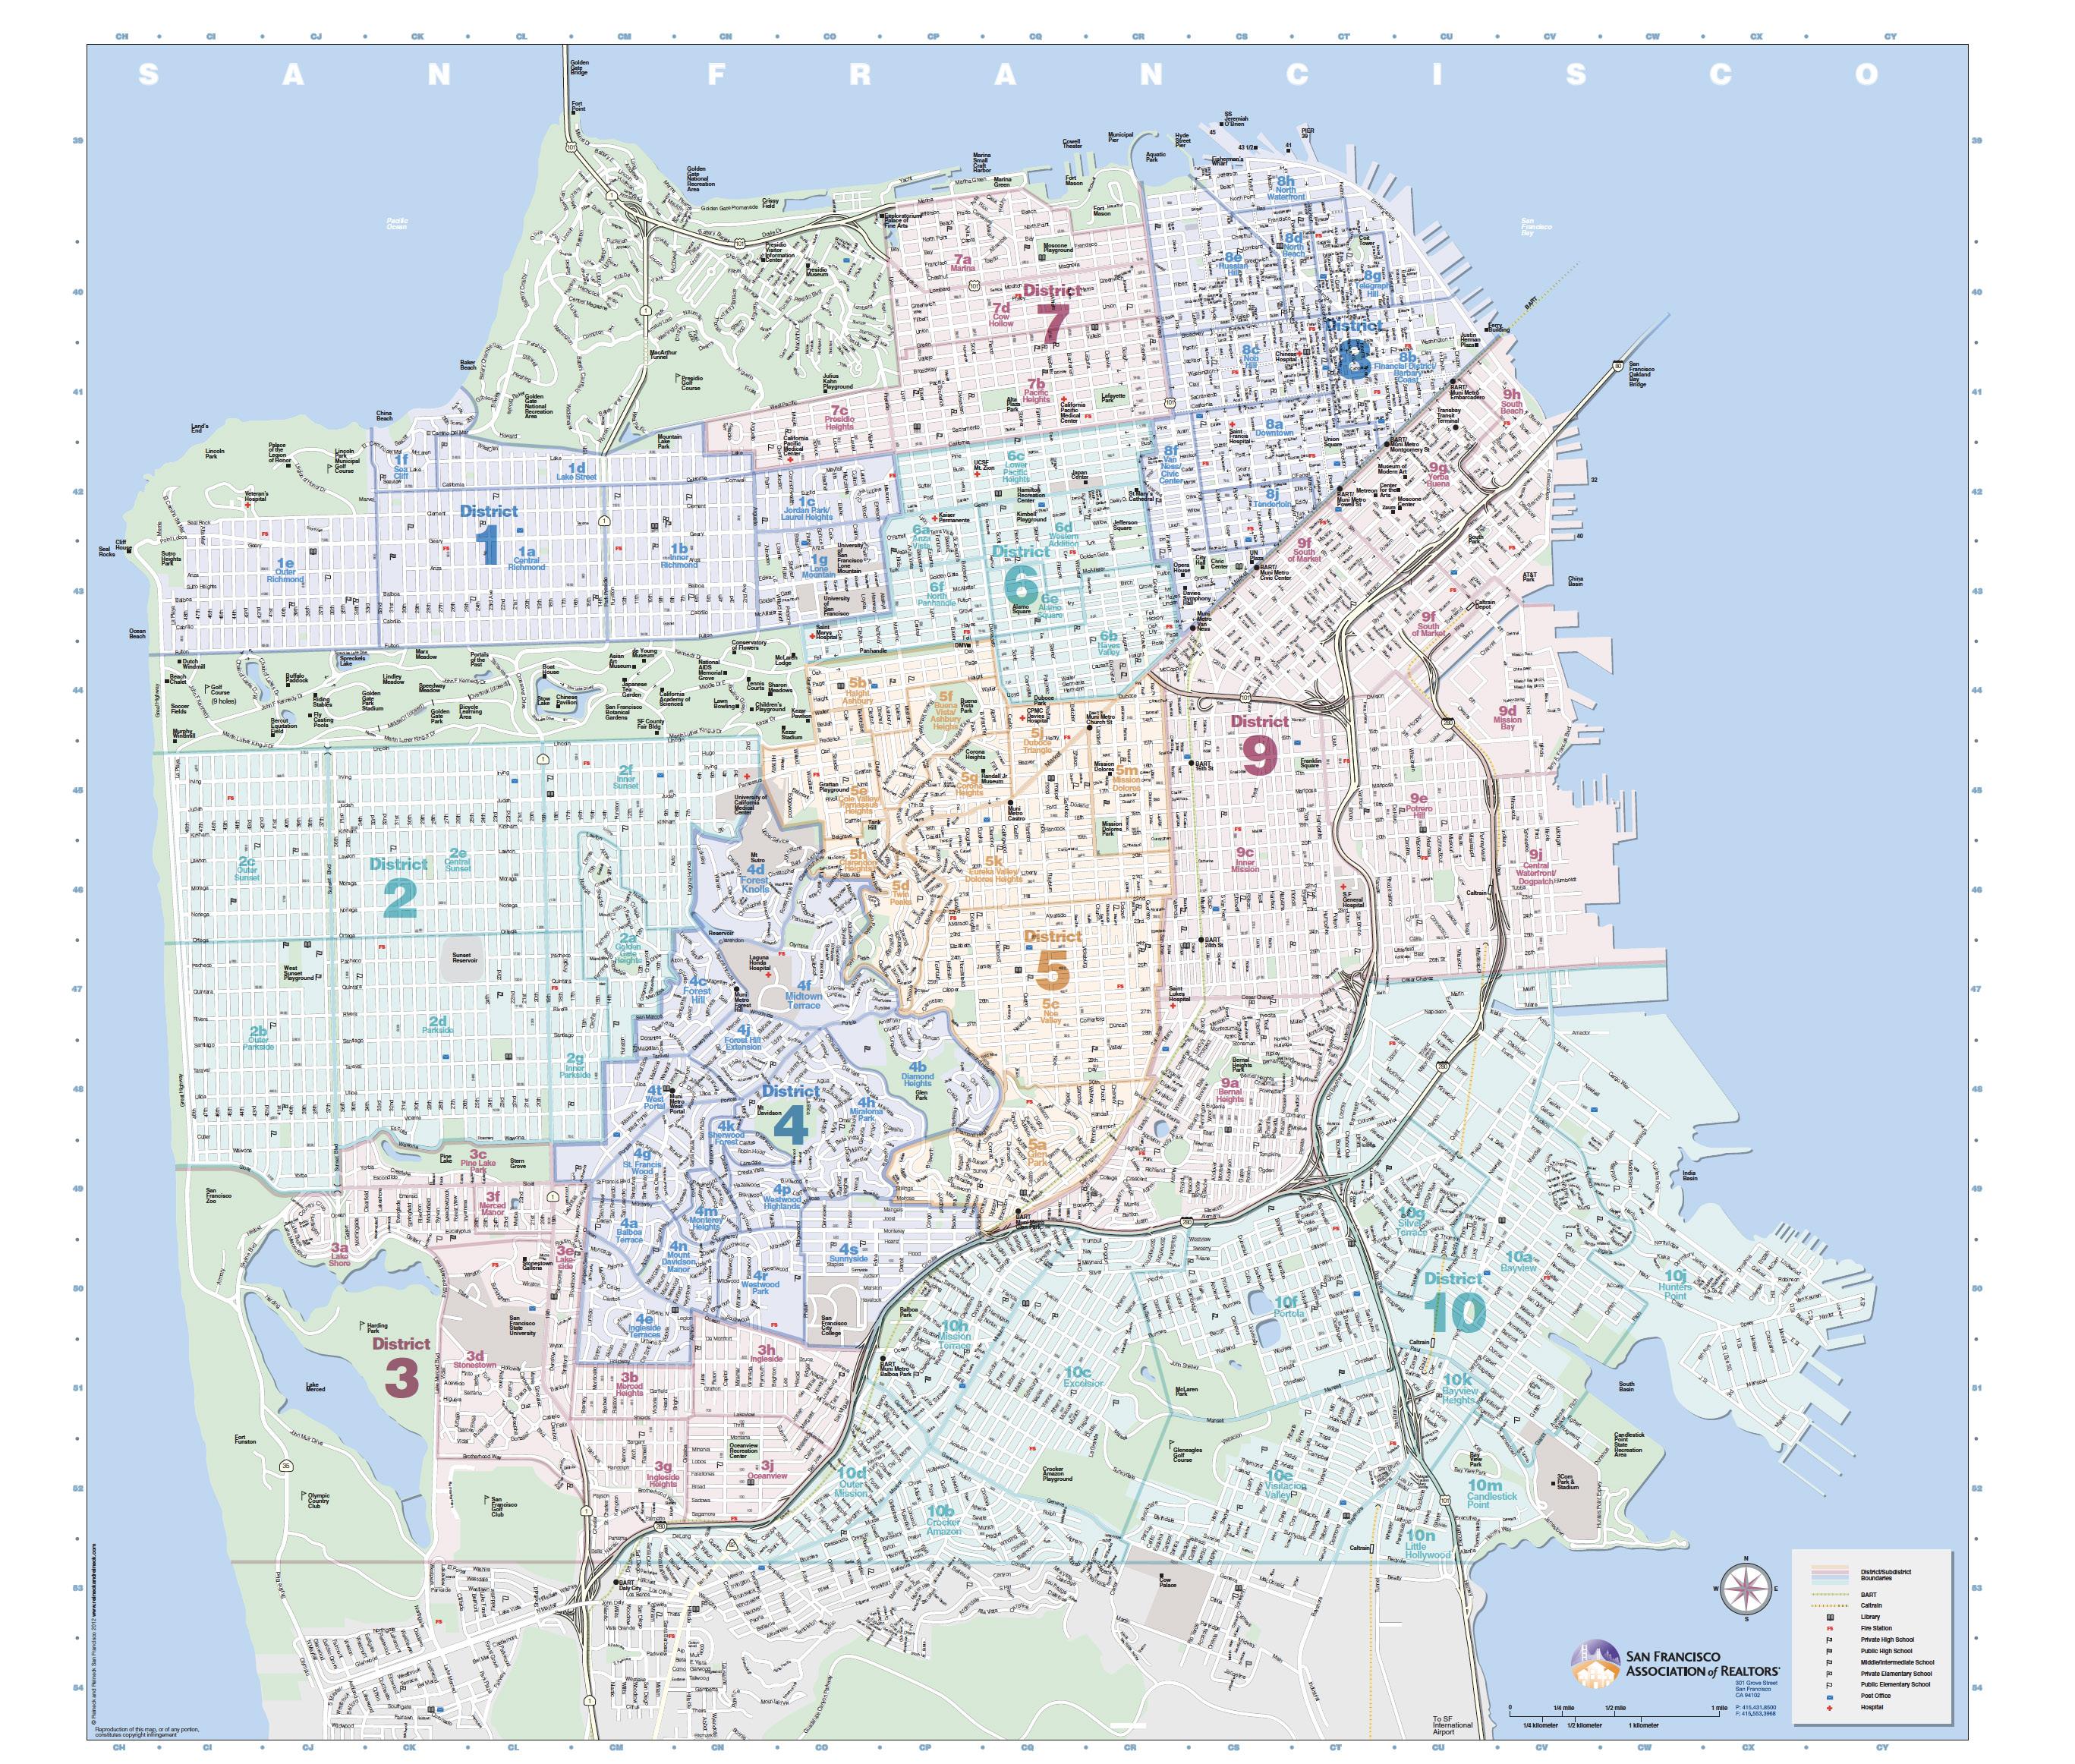
SF DISTRICT MAP
CONDO/TIC SALES
SINGLE FAMILY HOMES SALES Coming Soon Active Pending Sold YTD Av/$/Sq/Ft Low Sale High Sale High Sale Address District 1 6 12 9 15 $1,051.13 $1,100,000.00 $14,500,000.00 870 El Camino Del Mar District 2 8 28 6 22 $964.17 $1,125,000.00 $2,250,000.00 1934 9th Ave District 3 1 15 14 12 $908.88 $850,000.00 $2,237,000.00 708 Junipero Serra Blvd District 4 2 21 15 20 $930.42 $985,000.00 $3,210,000.00 150 San Leandro Way District 5 8 32 15 19 $1,182.44 $824,000.00 $7,200,000.00 4428 23rd St District 6 3 4 2 2 $1,354.44 $3,615,000.00 $4,400,000.00 537 Grove St District 7 5 26 8 10 $1,631.56 $2,400,000.00 $9,300,000.00 2776 Broadway St District 8 0 10 3 2 $1,219.34 $3,550,000.00 $3,700,000.00 1219 Lombard St District 9 5 21 13 12 $1,102.09 $950,000.00 $2,900,000.00 159 Bonview St District 10 11 39 27 25 $688.39 $795,000.00 $1,638,800.00 21 Senaca Ave
Coming Soon Active Pending Sold YTD Av/$/Sq/Ft Low Sale High Sale High Sale Address District 1 0 15 3 5 $860.14 $1,070,000.00 $2,538,500.00 122 Palm Ave District 2 1 10 2 1 $913.41 $749,000.00 $749,000.00 1335 16th Ave #2 District 3 2 2 1 0 $- $- $District 4 1 5 6 0 $- $- $District 5 12 47 36 26 $1,067.02 $608,000.00 $2,945,000.00 232 Castro St #3 District 6 11 36 8 17 $974.03 $400,000.00 $1,990,000.00 806 Haight St District 7 12 41 16 20 $1,315.09 $685,000.00 $4,900,000.00 2121 Webster St #TH8 District 8 15 145 32 43 $916.35 $289,000.00 $2,925,000.00 611 Washington St #2201 District 9 60 260 76 51 $2,909.34 $400,000.00 $7,445,000.00 1 Steuart Ln #1006 District 10 3 27 16 2 $562.96 $825,000.00 $865,000.00 1742 La Salle Ave YTD INVESTMENT PROPERTY 2-4 UNITS Coming Soon Active Pending Sold YTD Av/$/Sq/Ft Low Sale High Sale High Sale Address District 1 3 13 3 6 $488.57 $1,100,000.00 $2,200,000.00 791-797 21st ave District 2 0 13 3 7 $621.17 $1,250,000.00 $2,250,000.00 1355 3rd Ave District 3 0 1 1 0 $- $- $District 4 1 0 3 0 $- $- $District 5 2 21 9 7 $817.81 $1,500,000.00 $5,350,000.00 97-99 Park Hill Ave District 6 1 5 3 0 $- $- $District 7 6 7 5 2 $967.26 $2,410,000.00 $4,625,000.00 2009 Pacific Ave District 8 1 10 0 2 $396.33 $738,000.00 $1,975,500.00 1359-1361 Filbert St District 9 0 16 3 8 $597.08 $1,090,000.00 $2,200,000.00 940-944 Capp St District 10 0 6 6 1 $383.99 $1,180,000.00 $1,180,000.00 1740-1742 Palou Ave
Local Market Update for January 2024
Report
SF District 1

Key Metrics 20232024 Percent Change Thru 1-2023Thru 1-2024 Percent Change New Listings 12 9 - 25.0% 12 9 - 25.0% Pending Sales 8 8 0.0% 8 8 0.0% Sold Listings 12 13 + 8.3% 12 13 + 8.3% Median Sales Price* $2,160,000 $1,715,000 - 20.6%$2,160,000 $1,715,000 - 20.6% Average Sales Price* $2,273,916 $3,009,002 + 32.3%$2,273,916 $3,009,002 + 32.3% Days on Market 49 79 + 61.2% 49 79 + 61.2% Active Listings 22 10 - 54.5% % of Properties Sold Over List Price 41.7% 30.8% - 26.1%41.7% 30.8% - 26.1% Percent of List Price Received* 101.3% 98.4% - 2.9%101.3% 98.4% - 2.9% Months Supply 1.3 0.7 - 46.2% * Does not account for sale concessions and/or downpayment assistance. | Percent changes are calculated using rounded figures and can sometimes look extreme due to small sample size. Key Metrics 20232024 Percent Change Thru 1-2023Thru 1-2024 Percent Change New Listings 18 6 - 66.7% 18 6 - 66.7% Pending Sales 7 2 - 71.4% 7 2 - 71.4% Sold Listings 7 5 - 28.6% 7 5 - 28.6% Median Sales Price* $1,100,000 $1,200,000 + 9.1%$1,100,000 $1,200,000 + 9.1% Average Sales Price* $1,007,857 $1,462,140 + 45.1%$1,007,857 $1,462,140 + 45.1% Days on Market 46 52 + 13.0% 46 52 + 13.0% Active Listings 24 17 - 29.2% % of Properties Sold Over List Price 28.6% 40.0% + 39.9%28.6% 40.0% + 39.9% Percent of List Price Received* 100.5% 98.6% - 1.9%100.5% 98.6% - 1.9% Months Supply 1.8 1.7 - 5.6% -* Does not account for sale concessions and/or downpayment assistance. | Percent changes are calculated using rounded figures and can sometimes look extreme due to small sample size.
provided by the San Francisco Association of REALTORS® MLS For questions or more information, contact communications@sfrealtors.com.
January Year to Date January Year to Date Single Family Condo/TIC/Coop SF District 1 — SF Districts 1-10 — SF Districts 1-10 — SF District 1 — Current as of February 11, 2024. All data from the San Francisco Association of REALTORS® MLS. Report © 2024 ShowingTime. $500,000 $1,000,000 $1,500,000 $2,000,000 $2,500,000 $3,000,000 1-20141-20161-20181-20201-20221-2024 Median Sales Price –Single Family Rolling 12-Month Calculation $800,000 $900,000 $1,000,000 $1,100,000 $1,200,000 $1,300,000 $1,400,000 $1,500,000 1-20141-20161-20181-20201-20221-2024 Median Sales Price –Condo/TIC/Coop Rolling 12-Month Calculation
Local Market Update for January 2024
Report provided by the San Francisco Association of REALTORS® MLS For questions or more information, contact communications@sfrealtors.com.
SF District 2
Key Metrics 20232024 Percent Change Thru 1-2023Thru 1-2024 Percent Change New Listings 28 29 + 3.6% 28 29 + 3.6% Pending Sales 13 21 + 61.5% 13 21 + 61.5% Sold Listings 20 14 - 30.0% 20 14 - 30.0% Median Sales Price* $1,435,000 $1,528,000 + 6.5%$1,435,000 $1,528,000 + 6.5% Average Sales Price* $1,587,300 $1,536,109 - 3.2%$1,587,300 $1,536,109 - 3.2% Days on Market 45 66 + 46.7% 45 66 + 46.7% Active Listings 29 21 - 27.6% % of Properties Sold Over List Price 45.0% 71.4% + 58.7%45.0% 71.4% + 58.7% Percent of List Price Received* 105.0% 112.4% + 7.0%105.0% 112.4% + 7.0% Months Supply 0.8 0.7 - 12.5% * Does not account for sale concessions and/or downpayment assistance. | Percent changes are calculated using rounded figures and can sometimes look extreme due to small sample size. Key Metrics 20232024 Percent Change Thru 1-2023Thru 1-2024 Percent Change New Listings 6 2 - 66.7% 6 2 - 66.7% Pending Sales 5 2 - 60.0% 5 2 - 60.0% Sold Listings 2 0 - 100.0% 2 0 - 100.0% Median Sales Price* $827,500 $0 - 100.0%$827,500 $0 - 100.0% Average Sales Price* $827,500 $0 - 100.0%$827,500 $0 - 100.0% Days on Market 111 0 - 100.0% 111 0 - 100.0% Active Listings 13 4 - 69.2% % of Properties Sold Over List Price 0.0% 0.0% 0.0% 0.0% Percent of List Price Received* 96.8% 0.0% - 100.0%96.8% 0.0% - 100.0% Months Supply 3.7 1.2 - 67.6% -* Does not account for sale concessions and/or downpayment assistance. | Percent changes are calculated using rounded figures and can sometimes look extreme due to small sample size.
January Year to Date January Year to Date Single Family Condo/TIC/Coop SF District 2 — SF Districts 1-10 — SF Districts 1-10 — SF District 2 — Current as of February 11, 2024. All data from the San Francisco Association of REALTORS® MLS. Report © 2024 ShowingTime. $800,000 $1,000,000 $1,200,000 $1,400,000 $1,600,000 $1,800,000 $2,000,000 1-20141-20161-20181-20201-20221-2024 Median Sales Price –Single Family Rolling 12-Month Calculation $600,000 $800,000 $1,000,000 $1,200,000 $1,400,000 1-20141-20161-20181-20201-20221-2024 Median Sales Price –Condo/TIC/Coop Rolling 12-Month Calculation
Local Market Update for January 2024
Report provided by the San Francisco Association of REALTORS® MLS For questions or more information, contact communications@sfrealtors.com.
SF District 3
Key Metrics 20232024 Percent Change Thru 1-2023Thru 1-2024 Percent Change New Listings 13 15 + 15.4% 13 15 + 15.4% Pending Sales 8 3 - 62.5% 8 3 - 62.5% Sold Listings 7 9 + 28.6% 7 9 + 28.6% Median Sales Price* $1,105,000 $1,100,000 - 0.5%$1,105,000 $1,100,000 - 0.5% Average Sales Price* $1,482,143 $1,228,889 - 17.1%$1,482,143 $1,228,889 - 17.1% Days on Market 45 33 - 26.7% 45 33 - 26.7% Active Listings 18 19 + 5.6% % of Properties Sold Over List Price 57.1% 55.6% - 2.6% 57.1% 55.6% - 2.6% Percent of List Price Received* 101.9% 107.1% + 5.1%101.9% 107.1% + 5.1% Months Supply 1.4 1.7 + 21.4% * Does not account for sale concessions and/or downpayment assistance. | Percent changes are calculated using rounded figures and can sometimes look extreme due to small sample size. Key Metrics 20232024 Percent Change Thru 1-2023Thru 1-2024 Percent Change New Listings 2 1 - 50.0% 2 1 - 50.0% Pending Sales 1 0 - 100.0% 1 0 - 100.0% Sold Listings 2 0 - 100.0% 2 0 - 100.0% Median Sales Price* $630,000 $0 - 100.0%$630,000 $0 - 100.0% Average Sales Price* $630,000 $0 - 100.0%$630,000 $0 - 100.0% Days on Market 31 0 - 100.0% 31 0 - 100.0% Active Listings 3 2 - 33.3% % of Properties Sold Over List Price 0.0% 0.0% 0.0% 0.0% Percent of List Price Received* 98.6% 0.0% - 100.0%98.6% 0.0% - 100.0% Months Supply 1.1 0.9 - 18.2% -* Does not account for sale concessions and/or downpayment assistance. | Percent changes are calculated using rounded figures and can sometimes look extreme due to small sample size.
Year to Date January Year to Date Single Family Condo/TIC/Coop SF District 3 — SF Districts 1-10 — SF Districts 1-10 — SF District 3 — Current as of February 11, 2024. All data from the San Francisco Association of REALTORS® MLS. Report © 2024 ShowingTime. $600,000 $800,000 $1,000,000 $1,200,000 $1,400,000 $1,600,000 $1,800,000 $2,000,000 1-20141-20161-20181-20201-20221-2024 Median Sales Price –Single Family Rolling 12-Month Calculation $400,000 $600,000 $800,000 $1,000,000 $1,200,000 $1,400,000 1-20141-20161-20181-20201-20221-2024 Median Sales Price –Condo/TIC/Coop Rolling 12-Month Calculation
January
Local Market Update for January 2024
Report
SF District 4
Key Metrics 20232024 Percent Change Thru 1-2023Thru 1-2024 Percent Change New Listings 20 26 + 30.0% 20 26 + 30.0% Pending Sales 15 12 - 20.0% 15 12 - 20.0% Sold Listings 16 13 - 18.8% 16 13 - 18.8% Median Sales Price* $1,447,500 $1,925,000 + 33.0%$1,447,500 $1,925,000 + 33.0% Average Sales Price* $1,771,013 $2,006,231 + 13.3%$1,771,013 $2,006,231 + 13.3% Days on Market 55 61 + 10.9% 55 61 + 10.9% Active Listings 24 21 - 12.5% % of Properties Sold Over List Price 37.5% 38.5% + 2.7% 37.5% 38.5% + 2.7% Percent of List Price Received* 105.5% 105.6% + 0.1%105.5% 105.6% + 0.1% Months Supply 0.9 1.0 + 11.1% * Does not account for sale concessions and/or downpayment assistance. | Percent changes are calculated using rounded figures and can sometimes look extreme due to small sample size. Key Metrics 20232024 Percent Change Thru 1-2023Thru 1-2024 Percent Change New Listings 5 6 + 20.0% 5 6 + 20.0% Pending Sales 1 3 + 200.0% 1 3 + 200.0% Sold Listings 0 0 0 0 Median Sales Price* $0 $0 $0 $0 Average Sales Price* $0 $0 $0 $0 Days on Market 0 0 0 0 Active Listings 9 4 - 55.6% % of Properties Sold Over List Price 0.0% 0.0% 0.0% 0.0% Percent of List Price Received* 0.0% 0.0% 0.0% 0.0% Months Supply 2.2 1.1 - 50.0% -* Does not account for sale concessions and/or downpayment assistance. | Percent changes are calculated using rounded figures and can sometimes look extreme due to small sample size.
provided by the San Francisco Association of REALTORS® MLS For questions or more information, contact communications@sfrealtors.com.
Single Family Condo/TIC/Coop SF District 4 — SF Districts 1-10 — SF Districts 1-10 — SF District 4 — Current as of February 11, 2024. All data from the San Francisco Association of REALTORS® MLS. Report © 2024 ShowingTime. $800,000 $1,000,000 $1,200,000 $1,400,000 $1,600,000 $1,800,000 $2,000,000 $2,200,000 1-20141-20161-20181-20201-20221-2024 Median Sales Price –Single Family Rolling 12-Month Calculation $400,000 $600,000 $800,000 $1,000,000 $1,200,000 $1,400,000 1-20141-20161-20181-20201-20221-2024 Median Sales Price –Condo/TIC/Coop Rolling 12-Month Calculation
January Year to Date January Year to Date
Local Market Update for January 2024
Report
SF District 5
Key Metrics 20232024 Percent Change Thru 1-2023Thru 1-2024 Percent Change New Listings 27 32 + 18.5% 27 32 + 18.5% Pending Sales 12 17 + 41.7% 12 17 + 41.7% Sold Listings 10 10 0.0% 10 10 0.0% Median Sales Price* $1,855,000 $2,725,000 + 46.9%$1,855,000 $2,725,000 + 46.9% Average Sales Price* $3,050,950 $2,686,000 - 12.0%$3,050,950 $2,686,000 - 12.0% Days on Market 64 58 - 9.4% 64 58 - 9.4% Active Listings 32 30 - 6.3% % of Properties Sold Over List Price 40.0% 50.0% + 25.0%40.0% 50.0% + 25.0% Percent of List Price Received* 100.6% 103.4% + 2.8%100.6% 103.4% + 2.8% Months Supply 1.1 1.5 + 36.4% * Does not account for sale concessions and/or downpayment assistance. | Percent changes are calculated using rounded figures and can sometimes look extreme due to small sample size. Key Metrics 20232024 Percent Change Thru 1-2023Thru 1-2024 Percent Change New Listings 49 45 - 8.2% 49 45 - 8.2% Pending Sales 18 25 + 38.9% 18 25 + 38.9% Sold Listings 17 13 - 23.5% 17 13 - 23.5% Median Sales Price* $1,035,000 $1,180,000 + 14.0%$1,035,000 $1,180,000 + 14.0% Average Sales Price* $1,188,853 $1,230,769 + 3.5%$1,188,853 $1,230,769 + 3.5% Days on Market 73 92 + 26.0% 73 92 + 26.0% Active Listings 75 45 - 40.0% % of Properties Sold Over List Price 23.5% 30.8% + 31.1%23.5% 30.8% + 31.1% Percent of List Price Received* 98.4% 99.1% + 0.7% 98.4% 99.1% + 0.7% Months Supply 1.7 1.4 - 17.6% -* Does not account for sale concessions and/or downpayment assistance. | Percent changes are calculated using rounded figures and can sometimes look extreme due to small sample size.
San Francisco Association
REALTORS® MLS For
contact communications@sfrealtors.com.
provided by the
of
questions or more information,
January Year to Date January Year to Date Single Family Condo/TIC/Coop SF District 5 — SF Districts 1-10 — SF Districts 1-10 — SF District 5 — Current as of February 11, 2024. All data from the San Francisco Association of REALTORS® MLS. Report © 2024 ShowingTime. $500,000 $1,000,000 $1,500,000 $2,000,000 $2,500,000 $3,000,000 1-20141-20161-20181-20201-20221-2024 Median Sales Price –Single Family Rolling 12-Month Calculation $800,000 $1,000,000 $1,200,000 $1,400,000 $1,600,000 1-20141-20161-20181-20201-20221-2024 Median Sales Price –Condo/TIC/Coop Rolling 12-Month Calculation
Local Market Update for January 2024
Report provided by the San Francisco Association of REALTORS® MLS For questions or more information, contact communications@sfrealtors.com.
SF District 6
Key Metrics 20232024 Percent Change Thru 1-2023Thru 1-2024 Percent Change New Listings 4 3 - 25.0% 4 3 - 25.0% Pending Sales 2 1 - 50.0% 2 1 - 50.0% Sold Listings 1 1 0.0% 1 1 0.0% Median Sales Price* $4,500,000 $3,615,000 - 19.7%$4,500,000 $3,615,000 - 19.7% Average Sales Price* $4,500,000 $3,615,000 - 19.7%$4,500,000 $3,615,000 - 19.7% Days on Market 0 10 0 10 Active Listings 6 3 - 50.0% % of Properties Sold Over List Price 0.0% 100.0% 0.0% 100.0% Percent of List Price Received* 100.0% 106.5% + 6.5%100.0% 106.5% + 6.5% Months Supply 2.0 1.1 - 45.0% * Does not account for sale concessions and/or downpayment assistance. | Percent changes are calculated using rounded figures and can sometimes look extreme due to small sample size. Key Metrics 20232024 Percent Change Thru 1-2023Thru 1-2024 Percent Change New Listings 40 29 - 27.5% 40 29 - 27.5% Pending Sales 14 14 0.0% 14 14 0.0% Sold Listings 10 11 + 10.0% 10 11 + 10.0% Median Sales Price* $1,067,900 $850,000 - 20.4%$1,067,900 $850,000 - 20.4% Average Sales Price* $1,134,430 $1,124,364 - 0.9%$1,134,430 $1,124,364 - 0.9% Days on Market 63 62 - 1.6% 63 62 - 1.6% Active Listings 51 31 - 39.2% % of Properties Sold Over List Price 10.0% 18.2% + 82.0%10.0% 18.2% + 82.0% Percent of List Price Received* 98.1% 96.9% - 1.2% 98.1% 96.9% - 1.2% Months Supply 1.8 1.6 - 11.1% -* Does not account for sale concessions and/or downpayment assistance. | Percent changes are calculated using rounded figures and can sometimes look extreme due to small sample size.
January Year to Date January Year to Date Single Family Condo/TIC/Coop SF District 6 — SF Districts 1-10 — SF Districts 1-10 — SF District 6 — Current as of February 11, 2024. All data from the San Francisco Association of REALTORS® MLS. Report © 2024 ShowingTime. $0 $1,000,000 $2,000,000 $3,000,000 $4,000,000 1-20141-20161-20181-20201-20221-2024 Median Sales Price –Single Family Rolling 12-Month Calculation $700,000 $800,000 $900,000 $1,000,000 $1,100,000 $1,200,000 $1,300,000 $1,400,000 1-20141-20161-20181-20201-20221-2024 Median Sales Price –Condo/TIC/Coop Rolling 12-Month Calculation
Local Market Update for January 2024
Report provided by the San Francisco Association of REALTORS® MLS For questions or more information, contact communications@sfrealtors.com.
SF District 7
Key Metrics 20232024 Percent Change Thru 1-2023Thru 1-2024 Percent Change New Listings 13 15 + 15.4% 13 15 + 15.4% Pending Sales 2 9 + 350.0% 2 9 + 350.0% Sold Listings 2 8 + 300.0% 2 8 + 300.0% Median Sales Price* $5,855,000 $5,262,500 - 10.1%$5,855,000 $5,262,500 - 10.1% Average Sales Price* $5,855,000 $5,873,750 + 0.3%$5,855,000 $5,873,750 + 0.3% Days on Market 85 73 - 14.1% 85 73 - 14.1% Active Listings 27 19 - 29.6% % of Properties Sold Over List Price 0.0% 25.0% 0.0% 25.0% Percent of List Price Received* 92.6% 97.2% + 5.0% 92.6% 97.2% + 5.0% Months Supply 3.4 2.3 - 32.4% * Does not account for sale concessions and/or downpayment assistance. | Percent changes are calculated using rounded figures and can sometimes look extreme due to small sample size. Key Metrics 20232024 Percent Change Thru 1-2023Thru 1-2024 Percent Change New Listings 45 28 - 37.8% 45 28 - 37.8% Pending Sales 13 18 + 38.5% 13 18 + 38.5% Sold Listings 10 16 + 60.0% 10 16 + 60.0% Median Sales Price* $1,650,000 $1,747,500 + 5.9%$1,650,000 $1,747,500 + 5.9% Average Sales Price* $2,477,900 $2,928,438 + 18.2%$2,477,900 $2,928,438 + 18.2% Days on Market 88 102 + 15.9% 88 102 + 15.9% Active Listings 58 40 - 31.0% % of Properties Sold Over List Price 40.0% 25.0% - 37.5%40.0% 25.0% - 37.5% Percent of List Price Received* 99.5% 97.0% - 2.5% 99.5% 97.0% - 2.5% Months Supply 2.3 2.1 - 8.7% -* Does not account for sale concessions and/or downpayment assistance. | Percent changes are calculated using rounded figures and can sometimes look extreme due to small sample size.
Year to Date January Year to Date Single Family Condo/TIC/Coop SF District 7 — SF Districts 1-10 — SF Districts 1-10 — SF District 7 — Current as of February 11, 2024. All data from the San Francisco Association of REALTORS® MLS. Report © 2024 ShowingTime. $0 $1,000,000 $2,000,000 $3,000,000 $4,000,000 $5,000,000 $6,000,000 1-20141-20161-20181-20201-20221-2024 Median Sales Price –Single Family Rolling 12-Month Calculation $800,000 $1,000,000 $1,200,000 $1,400,000 $1,600,000 $1,800,000 1-20141-20161-20181-20201-20221-2024 Median Sales Price –Condo/TIC/Coop Rolling 12-Month Calculation
January
SF District 8
Key Metrics 20232024 Percent Change Thru 1-2023Thru 1-2024 Percent Change New Listings 1 7 + 600.0% 1 7 + 600.0% Pending Sales 0 2 0 2 Sold Listings 0 0 0 0 Median Sales Price* $0 $0 $0 $0 Average Sales Price* $0 $0 $0 $0 Days on Market 0 0 0 0 Active Listings 7 9 + 28.6% % of Properties Sold Over List Price 0.0% 0.0% 0.0% 0.0% Percent of List Price Received* 0.0% 0.0% 0.0% 0.0% Months Supply 2.2 5.1 + 131.8% * Does not account for sale concessions and/or downpayment assistance. | Percent changes are calculated using rounded figures and can sometimes look extreme due to small sample size. Key Metrics 20232024 Percent Change Thru 1-2023Thru 1-2024 Percent Change New Listings 59 90 + 52.5% 59 90 + 52.5% Pending Sales 22 49 + 122.7% 22 49 + 122.7% Sold Listings 21 36 + 71.4% 21 36 + 71.4% Median Sales Price* $975,000 $835,000 - 14.4%$975,000 $835,000 - 14.4% Average Sales Price* $980,929 $1,101,528 + 12.3%$980,929 $1,101,528 + 12.3% Days on Market 121 95 - 21.5% 121 95 - 21.5% Active Listings 137 144 + 5.1% % of Properties Sold Over List Price 14.3% 11.1% - 22.4%14.3% 11.1% - 22.4% Percent of List Price Received* 97.2% 96.1% - 1.1% 97.2% 96.1% - 1.1% Months Supply 3.4 4.1 + 20.6% -* Does not account for sale concessions and/or downpayment assistance. | Percent changes are calculated using rounded figures and can sometimes look extreme due to small sample size.
Market Update for January 2024 Report provided by the San Francisco Association of REALTORS® MLS For questions or more information, contact communications@sfrealtors.com.
Local
January Year to Date January Year to Date Single Family Condo/TIC/Coop SF District 8 — SF Districts 1-10 — SF Districts 1-10 — SF District 8 — Current as of February 11, 2024. All data from the San Francisco Association of REALTORS® MLS. Report © 2024 ShowingTime. $0 $1,000,000 $2,000,000 $3,000,000 $4,000,000 $5,000,000 1-20141-20161-20181-20201-20221-2024 Median Sales Price –Single Family Rolling 12-Month Calculation $700,000 $800,000 $900,000 $1,000,000 $1,100,000 $1,200,000 $1,300,000 1-20141-20161-20181-20201-20221-2024 Median Sales Price –Condo/TIC/Coop Rolling 12-Month Calculation
Local Market Update for January 2024
Report
SF District 9
Key Metrics 20232024 Percent Change Thru 1-2023Thru 1-2024 Percent Change New Listings 20 24 + 20.0% 20 24 + 20.0% Pending Sales 11 14 + 27.3% 11 14 + 27.3% Sold Listings 9 7 - 22.2% 9 7 - 22.2% Median Sales Price* $1,210,000 $1,600,000 + 32.2%$1,210,000 $1,600,000 + 32.2% Average Sales Price* $1,389,222 $1,726,429 + 24.3%$1,389,222 $1,726,429 + 24.3% Days on Market 36 51 + 41.7% 36 51 + 41.7% Active Listings 30 20 - 33.3% % of Properties Sold Over List Price 66.7% 57.1% - 14.4%66.7% 57.1% - 14.4% Percent of List Price Received* 106.3% 104.9% - 1.3%106.3% 104.9% - 1.3% Months Supply 1.5 1.2 - 20.0% * Does not account for sale concessions and/or downpayment assistance. | Percent changes are calculated using rounded figures and can sometimes look extreme due to small sample size. Key Metrics 20232024 Percent Change Thru 1-2023Thru 1-2024 Percent Change New Listings 114 125 + 9.6% 114 125 + 9.6% Pending Sales 39 60 + 53.8% 39 60 + 53.8% Sold Listings 35 33 - 5.7% 35 33 - 5.7% Median Sales Price* $950,000 $1,100,000 + 15.8%$950,000 $1,100,000 + 15.8% Average Sales Price* $1,293,479 $1,290,481 - 0.2%$1,293,479 $1,290,481 - 0.2% Days on Market 90 79 - 12.2% 90 79 - 12.2% Active Listings 261 244 - 6.5% % of Properties Sold Over List Price 14.3% 18.2% + 27.3%14.3% 18.2% + 27.3% Percent of List Price Received* 96.9% 95.9% - 1.0% 96.9% 95.9% - 1.0% Months Supply 3.3 4.3 + 30.3% -* Does not account for sale concessions and/or downpayment assistance. | Percent changes are calculated using rounded figures and can sometimes look extreme due to small sample size.
San Francisco Association of REALTORS® MLS For
or
contact communications@sfrealtors.com.
provided by the
questions
more information,
January Year to Date January Year to Date Single Family Condo/TIC/Coop SF District 9 — SF Districts 1-10 — SF Districts 1-10 — SF District 9 — Current as of February 11, 2024. All data from the San Francisco Association of REALTORS® MLS. Report © 2024 ShowingTime. $800,000 $1,000,000 $1,200,000 $1,400,000 $1,600,000 $1,800,000 $2,000,000 1-20141-20161-20181-20201-20221-2024 Median Sales Price –Single Family Rolling 12-Month Calculation $700,000 $800,000 $900,000 $1,000,000 $1,100,000 $1,200,000 $1,300,000 1-20141-20161-20181-20201-20221-2024 Median Sales Price –Condo/TIC/Coop Rolling 12-Month Calculation
Local Market Update for January 2024
Report provided by the San Francisco Association of REALTORS® MLS
SF District 10
Key Metrics 20232024 Percent Change Thru 1-2023Thru 1-2024 Percent Change New Listings 30 24 - 20.0% 30 24 - 20.0% Pending Sales 16 28 + 75.0% 16 28 + 75.0% Sold Listings 23 16 - 30.4% 23 16 - 30.4% Median Sales Price* $1,040,000 $1,025,000 - 1.4%$1,040,000 $1,025,000 - 1.4% Average Sales Price* $1,052,039 $1,066,725 + 1.4%$1,052,039 $1,066,725 + 1.4% Days on Market 48 48 0.0% 48 48 0.0% Active Listings 65 44 - 32.3% % of Properties Sold Over List Price 43.5% 62.5% + 43.7%43.5% 62.5% + 43.7% Percent of List Price Received* 102.4% 104.7% + 2.2%102.4% 104.7% + 2.2% Months Supply 1.7 1.3 - 23.5% * Does not account for sale concessions and/or downpayment assistance. | Percent changes are calculated using rounded figures and can sometimes look extreme due to small sample size. Key Metrics 20232024 Percent Change Thru 1-2023Thru 1-2024 Percent Change New Listings 4 14 + 250.0% 4 14 + 250.0% Pending Sales 3 8 + 166.7% 3 8 + 166.7% Sold Listings 1 0 - 100.0% 1 0 - 100.0% Median Sales Price* $590,000 $0 - 100.0%$590,000 $0 - 100.0% Average Sales Price* $590,000 $0 - 100.0%$590,000 $0 - 100.0% Days on Market 45 0 - 100.0% 45 0 - 100.0% Active Listings 22 28 + 27.3% % of Properties Sold Over List Price 100.0% 0.0% - 100.0%100.0% 0.0% - 100.0% Percent of List Price Received* 102.6% 0.0% - 100.0%102.6% 0.0% - 100.0% Months Supply 3.6 6.3 + 75.0% * Does not account for sale concessions and/or downpayment assistance. | Percent changes are calculated using rounded figures and can sometimes look extreme due to small sample size.
For
questions or more information, contact communications@sfrealtors.com.
January Year to Date January Year to Date Single Family Condo/TIC/Coop SF District 10 — SF Districts 1-10 — SF Districts 1-10 — SF District 10 — Current as of February 11, 2024. All data from the San Francisco Association of REALTORS® MLS. Report © 2024 ShowingTime. $600,000 $800,000 $1,000,000 $1,200,000 $1,400,000 $1,600,000 $1,800,000 $2,000,000 1-20141-20161-20181-20201-20221-2024 Median Sales Price –Single Family Rolling 12-Month Calculation $200,000 $400,000 $600,000 $800,000 $1,000,000 $1,200,000 $1,400,000 1-20141-20161-20181-20201-20221-2024 Median Sales Price –Condo/TIC/Coop Rolling 12-Month Calculation
KEVIN KROPP


2023 TOP PRODUCER
2023 YEAR TO DATE
Coming Soon:
Pending Sales:
ACTIVELY SELLING PROPERTIES THROUGHOUT
BAY AREA
THE
SALES
Outer
892 45th Ave
Richmond / 2 bed / 1 bath / 1 pkg / Condo $1,095,000 960 Natoma #4 SOMA / 1 bed / 1 bath / Condo $839,000 142 South Van Ness SOMA / Commercial / Condo $875,000 37-39 Mirabel Ave Bernal Heights / Income property / 3 units $2,195,000
Beaver
Duboce
10th St
262 Waller St Hayes
Active Listings: 68-70
St
Triangle / Duplex / 2 pkg $1,995,000 364-366
SOMA / Mixed Use $2,250,000
Valley / 4 bed / 4 bath / 3 pkg $3,900,000
919 Excelsior Ave
Saturn St Corona Heights/ 3 units / 2 pkg Seller 1931 Anza St Inner Richmond / 3 bed / 2 bath / SFH Seller 111-115 Buena Vista Ter Corona Heights/ 3 units / 2 pkg Seller 256 Evelyn Way Miraloma Park / 3 bed /1 bath / SFH Seller 140 South Van Ness #1124 SOMA / 1 bed / 1 bath / Condo Seller 5000 Diamond Hghts Blvd Miraloma Park / 4 bed / 2 bath / 2 pkg / Condo Seller 3 Topaz Way Diamond Heights / 3 bed / 2.5 bath / Condo Buyer 265 Glenview Dr Midtown Terrace / 3 bed / 2 bath / SFR Seller 1210 Stanyan St Cole Valley / 2 units / 2+ pkg / Duplex Seller 626 Castro St Castro / 3 bed / 1.5 bath / 2 pkg / TIC Seller 4150 17th St #18 Corona Heights / 2 bed / 2 bath / 2 pkg / Condo Seller 518 Duncan St Pacific Heights / 3 bed / 3.5 bath / 1 pkg / Condo Buyer 1940 Buchanan St Lower Pac Heights / 3 bed / 1 bath / TIC Seller 1905 Cactus Ct #1 Walnut Creek / 2 bed / 2 bath / 1 pkg / Condo Seller
Excelsior / 2 bed / 1 bath / 1 pkg $999,000 Sold: (1/1/23 – Present) 129-131
AGENT PROFILE
As Sales Manager of Vanguard Properties Castro Street Office and as an agent for Vanguard Properties for almost 19 years, Kevin brings extensive experience and knowledge to the benefit of all his clients, agents and staff. After more than 29 years living in San Francisco, over $425 Million in closed sales and being a Top Producing Realtor, Kevin continues to contribute to everyone around him. Kevin works as a mentor and advisor to new and well-established agents helping them to learn and navigate the complicated nuances of real estate while still protecting everyone’s best interest.
Kevin’s goal is to share his wealth of experience, knowledge and sales expertise with the ever-growing team of agents at Vanguard Properties. From his years owning and operating restaurants, cafés and bars to over 18 years as an agent, he is always ready to bring his well-rounded perspective to the table for clients.
Understanding the home selling and buying process is key and Kevin will be your resource to help you make the right decisions. Whether you are buying your first home, trading properties, selling a long-term investment or adding units to your investment/rental portfolio, Kevin is committed to being there for you throughout the entire transaction and the close of escrow. After the sale, Kevin continues to assist his clients and agents with resource information and suggestions to maximize the value of their properties today and in the future. Kevin also helps during the property development stage, assisting with every facet including design, layout and finish selections to optimize the value, investment costs and ROI (Return on Investment) for the final product. He works with a large group of developers and has buyers at all price points. The success of Kevin Kropp is the success of his clients, complimented by his years of experience. Kevin has been involved in remodeling, developing and has been an owner of single family homes, condos and multi-unit buildings and Tenancy-in-Common in San Francisco, bay area and across the USA. He doesn’t just look at property from the curb; he will get into the trenches with you to understand the nuts and bolts of a property. Put his experience to work for you today!
BROKER ASSOCIATE | SALES MANAGER, CASTRO OFFICE
415.606.1415
kevin@vanguardsf.com
DRE #01413211
kevinsfhomes.com
VANGUARDPROPERTIES.COM
Annual Report on the San Francisco County Housing Market


Residential real estate activity in San Francisco County (Districts 1-10), composed of single-family properties, townhomes and condominiums.
Annual Report on the San Francisco County Housing Market
Residential real estate activity in San Francisco County (Districts 1-10), composed of single-family properties, townhomes and condominiums.
2023 was a challenging year for the U.S. housing market: mortgage rates hit a 2-decade high, housing inventory remained at historic lows, and sales prices continued to climb nationwide, putting homeownership out of reach for many consumers. Housing affordability remained a top concern for homebuyers, and for good reason: mortgage payments are up significantly from 2022, with a number of homeowners now spending more than 30% of their income on their monthly payment. As a result, sales of previously owned homes remained sluggish throughout the year, while the shortage of existing-home inventory helped sales of new residential homes steadily increase from last year.
Higher mortgage rates aren’t just affecting buyers. Many current homeowners purchased or refinanced their homes in 2020 or 2021, when mortgage rates were several percentage points lower than today’s rates. And while those pandemicera mortgages have been a blessing for many homeowners, they’ve also kept others from moving. Rather than give up their current mortgage rate for a higher rate and a more expensive monthly payment, some would-be sellers have chosen to put their moving plans on hold, further limiting the number of homes for sale and driving up home prices in the process.
Sales: Pending sales decreased 25.6 percent, finishing 2023 at 4,120. Sold listings were down 27.4 percent to end the year at 4,092.
Listings: Comparing 2023 to the prior year, the number of homes available for sale was down by 19,7 percent. There were 612 active listings at the end of 2023. New listings decreased by 24.6 percent to finish the year at 6,209.

Prices: Home prices were down compared to last year. The overall median sales price decreased 9.1 percent to $1,315,000 for the year. Single Family home prices were down 12.9 percent compared to last year, and Condo/TIC/ Coop home prices were down 8.3 percent.
List Price Received: Sellers received, on average, 103.0 percent of their list price at sale, a year-over-year reduction of 4.8 percent.
With inflation showing signs of improvement, the Federal Reserve recently announced they are likely done raising interest rates for the time being and plan to make at least three cuts to their benchmark rate in 2024. Mortgage rates have been dropping in recent months, which should help bring buyers and sellers back to the market and could lead to an uptick in both home sales and housing supply. Affordability will still prove challenging for many homebuyers, however, and economists predict U.S. home sales will remain down compared to 2019 - 2022. As for home prices, opinions are mixed, with some analysts expecting prices will hold steady or continue rising in areas, while others foresee a modest price drop in some markets.
Table of Contents 3 Quick Facts 5 Property Type Review 6 Bedroom Range Review 7 Square Foot Range Review 8 Price Range Review 9 Area Overviews 10 Area Historical Prices Current as of January 11, 2024. All data from the San Francisco Association of REALTORS® MLS. Report © 2024 ShowingTime. | 2
Quick Facts
Bottom
SF District 8 - 15.2% SF District 4 - 16.6% SF District 1 - 15.3% SF District 1 - 17.3% SF District 7 - 17.5% SF District 3 - 20.0% SF District 2 - 19.2% SF District 10 - 21.6% SF District 10 - 20.5% SF District 8 - 21.7% SF District 3 - 21.0% SF District 7 - 23.3% SF District 4 - 25.1% SF District 2 - 25.1% SF District 5 - 30.2% SF District 5 - 30.3% SF District 6 - 30.3% SF District 9 - 30.6% SF District 9 - 31.2% SF District 6 - 32.0% SF District 4 - 18.2% SF District 7 - 3.9% SF District 1 - 21.2% SF District 8 - 5.8% SF District 3 - 22.3% SF District 10 - 10.3% SF District 10 - 23.1% SF District 2 - 13.3% SF District 2 - 23.3% SF District 9 - 18.5% SF District 7 - 24.1% SF District 5 - 28.4% SF District 8 - 25.5% SF District 6 - 32.4% SF District 5 - 31.9% SF District 3 - 40.0% SF District 9 - 32.8% SF District 1 - 42.9% SF District 6 - 34.7% SF District 4 - 65.6%
Current as of January 11, 2024. All data from the San Francisco Association of REALTORS® MLS. Report © 2024 ShowingTime. | 3
5 Areas: Change in Sold Listings from 2022
5 Areas: Change in Active Listings from 2022
5 Areas: Change in Pending Sales from 2022
2023 Annual Report on the San Francisco County Housing Market
Bottom
Bottom
Top
5 Areas: Change in Pending Sales from 2022
5 Areas: Change in Sold Listings from 2022
Top
5 Areas: Change in Active Listings from 2022
Top
5 Areas: Change in New Listings from 2022
Bottom
5 Areas: Change in New Listings from 2022 At the end of the year. 767 1,578 915 762 612 2019 2020 2021 2022 2023 5,447 5,358 7,646 5,636 4,092 2019 2020 2021 2022 2023 5,470 5,463 7,598 5,535 4,120 2019 2020 2021 2022 2023 7,000 8,756 9,244 8,231 6,209 2019 2020 2021 2022 2023
Listings Pending Sales + 25.1% + 5.6% - 11.0%
Listings Active
- 24.6% - 0.1% + 39.1% - 27.2% - 25.6% - 1.6% + 42.7% - 26.3% - 27.4% + 105.7% - 42.0% - 16.7% - 19.7%
Top
New
Sold
Listings
2023 Annual Report on the San Francisco County Housing Market
Quick Facts
SF District 7 0.0% SF District 7 + 14.0% SF District 6 - 3.8% SF District 1 - 1.7% SF District 3 - 6.5% SF District 6 - 5.2% SF District 1 - 6.9% SF District 10 - 6.5% SF District 9 - 7.6% SF District 9 - 7.3% SF District 10 - 8.0% SF District 3 - 8.7% SF District 4 - 9.4% SF District 5 - 10.0% SF District 5 - 9.9% SF District 2 - 11.8% SF District 8 - 10.7% SF District 4 - 12.2% SF District 2 - 10.7% SF District 8 - 17.6% SF District 5 + 50.0% SF District 8 - 2.6% SF District 1 + 36.0% SF District 9 - 3.3% SF District 8 + 34.0% SF District 7 - 3.7% SF District 4 + 28.0% SF District 6 - 4.0% SF District 6 + 25.6% SF District 10 - 4.2% SF District 9 + 25.0% SF District 4 - 5.0% SF District 7 + 23.7% SF District 3 - 5.0% SF District 2 + 22.7% SF District 5 - 6.6% SF District 10 + 11.4% SF District 2 - 7.4% SF District 3 + 7.1% SF District 1 - 7.9%
Top 5 Areas: Change in Median Sales Price from 2022 Top 5 Areas: Change in Avg. Sales Price from 2022 Bottom 5 Areas: Change in Median Sales Price from 2022 Bottom 5 Areas: Change in Avg. Sales Price from 2022 Current as of January 11, 2024. All data from the San Francisco Association of REALTORS® MLS. Report © 2024 ShowingTime. | 4 Bottom 5 Areas: Change in Days on Market from 2022 Bottom 5 Areas: Change in Pct. of List Price Received from 2022 Top 5 Areas: Change in Days on Market from 2022 Top 5 Areas: Change in Pct. of List Price Received from 2022 $1,353,000 $1,385,000 $1,438,000 $1,447,000 $1,315,000 2019 2020 2021 2022 2023 108.6% 104.1% 108.2% 108.2% 103.0% 2019 2020 2021 2022 2023 34 38 37 36 45 2019 2020 2021 2022 2023 $1,616,204 $1,636,366 $1,762,189 $1,733,256 $1,633,563 2019 2020 2021 2022 2023 Median Sales Price Average Sales Price + 2.4% + 3.8% + 0.6%
on Market Until Sale Percent of List Price Received - 9.1% + 1.2% + 7.7% - 1.6% - 5.8% + 11.8% - 2.6% - 2.7% + 25.0% - 4.1% + 3.9% 0.0% - 4.8%
Days
Property Type Review
Days on Market Until Sale
Median Sales Price
of List Price Received
Top Areas: Condo/TIC/Coop Market Share in 2023 SF District 8 95.6% SF District 6 84.8% SF District 9 76.3% SF District 7 70.8% SF District 5 60.7% SF District 1 42.3% SF District 4 12.7% SF District 3 12.5% SF District 2 11.1% SF District 10 10.2%
31 57 Single-Family Average Days on Market Average Days on Market Condo/TIC/Coop 2023 Annual Report on the San Francisco County Housing Market Current as of January 11, 2024. All data from the San Francisco Association of REALTORS® MLS. Report © 2024 ShowingTime. | 5 One-Year Change in Price Single-Family One-Year Change in Price Condo/TIC/Coop Pct. of List Price Received Single-Family Pct. of List Price Received Condo/TIC/Coop - 12.9% - 8.3% 107.0% 99.7% This chart uses a rolling 12-month average for each data point. 112.5% 105.3% 107.5% 101.2% 114.7% 103.8% 114.4% 103.5% 107.0% 99.7% Single-Family Condo/TIC/Coop 2019 2020 2021 2022 2023 $1551K $1200K $1608K $1190K $1800K $1210K $1780K $1200K $1550K $1100K Single-Family Condo/TIC/Coop 2019 2020 2021 2022 2023 0 10 20 30 40 50 60 70 1-2019 1-2020 1-2021 1-2022 1-2023 Single-Family Condo/TIC/Coop
95.6% 84.8% 76.3% 70.8% 60.7% 42.3% 12.7% 12.5% 11.1% 10.2% SF District 8 SF District 6 SF District 9 SF District 7 SF District 5 SF District 1 SF District 4 SF District 3 SF District 2 SF District 10
Percent
Top Areas: 4 Bedrooms or More Market Share in 2023 SF District 4 40.1% SF District 10 39.9% SF District 1 39.6% SF District 2 38.2% SF District 3 38.1% SF District 5 36.2% SF District 6 31.4% SF District 7 28.3% SF District 9 19.9% SF District 8 15.0% Reduction in Closed Sales 2 Bedrooms or Less Reduction in Closed Sales 4 Bedrooms or More
- 33.7% - 22.5% This chart uses a rolling 12-month average for each data point. 2023 Annual Report on the San Francisco County Housing Market Current as of January 11, 2024. All data from the San Francisco Association of REALTORS® MLS. Report © 2024 ShowingTime. | 6 101.2% 97.2% 101.4% 103.0% Percent of Original List Price Received in 2023 for All Properties Percent of Original List Price Received in 2023 for 2 Bedrooms or Less Percent of Original List Price Received in 2023 for 3 Bedrooms Percent of Original List Price Received in 2023 for 4 Bedrooms or More 1,058 1,974 1,634 701 1,412 1,266 2 Bedrooms or Less 3 Bedrooms 4 Bedrooms or More 2022 2023 96% 98% 100% 102% 104% 106% 108% 110% 112% 114% 116% 1-2019 1-2020 1-2021 1-2022 1-2023 2 Bedrooms or Less 3 Bedrooms 4 Bedrooms or More Closed Sales Percent of Original List Price Received - 33.7% - 28.5% - 22.5% 40.1% 39.9% 39.6% 38.2% 38.1% 36.2% 31.4% 28.3% 19.9% 15.0% SF District 4 SF District 10 SF District 1 SF District 2 SF District 3 SF District 5 SF District 6 SF District 7 SF District 9 SF District 8
Bedroom Count Review
2023
Annual Report on the San Francisco County Housing Market Square Foot Range Review -
Top Areas: 1,500 or Less Market Share in 2023 SF District 9 70.3% SF District 8 58.4% SF District 10 55.4% SF District 6 54.2% SF District 3 51.1% SF District 2 40.6% SF District 5 40.3% SF District 4 34.6% SF District 7 32.2% SF District 1 26.0%
22.2% - 29.2% Current as of January 11, 2024. All data from the San Francisco Association of REALTORS® MLS. Report © 2024 ShowingTime. | 7 Reduction in Closed Sales 2,501 or More Reduction in Closed Sales 1,500 or Less 100.9% 102.7% 102.7% 98.9% Percent of Original List Price Received in 2023 for 1,500 or Less Percent of Original List Price Received in 2023 for 1,501 - 2,000 Percent of Original List Price Received in 2023 for 2,001 - 2,500 Percent of Original List Price Received in 2023 for 2,501 or More This chart uses a rolling 12-month average for each data point. 2,978 1,084 554 545 2,107 809 411 424 1,500 or Less 1,501 - 2,000 2,001 - 2,500 2,501 or More 2022 2023 94% 96% 98% 100% 102% 104% 106% 108% 110% 112% 114% 116% 1-2019 1-2020 1-2021 1-2022 1-2023 1,500 or Less 1,501 - 2,000 2,001 - 2,500 2,501 or More Closed Sales Percent of Original List Price Received - 29.2% - 25.4% - 25.8% - 22.2% 58.4% 55.4% 54.2% 51.1% 40.6% 40.3% 34.6% 32.2% 26.0% SF District 9 SF District 8 SF District 10 SF District 6 SF District 3 SF District 2 SF District 5 SF District 4 SF District 7 SF District 1
2023 Annual Report on the San Francisco County Housing Market Current as of January 11, 2024. All data from the San Francisco Association of REALTORS® MLS. Report © 2024 ShowingTime. | 8 Price Range with Shortest Average Market Time Price Range with Longest Average Market Time of Homes for Sale at Year End Priced $749,000 or Less One-Year Change in Homes for Sale Priced $749,000 or Less $1,000,000 to $1,749,999 - 0.5% $749,000 or Less - 41.0% Share of Homes for Sale $749,000 or Less Days on Market Until Sale by Price Range
$1,000,000 to $1,749,999 $749,000 or Less 23.0% Price Range with the Most Closed Sales Price Range with Strongest One-Year Change in Sales: $749,000 or Less Price Range with the Fewest Closed Sales Price Range with Weakest One-Year Change in Sales: $1,750,000 or More - 17.1% 76 47 39 39 $749,000 or Less $750,000 to $999,999 $1,000,000 to $1,749,999 $1,750,000 or More 676 1,114 3,277 2,579 551 765 2,402 1,918 548 633 1,780 1,131 $749,000 or Less $750,000 to $999,999 $1,000,000 to $1,749,999 $1,750,000 or More 2021 2022 2023 Closed Sales by Price Range 0% 5% 10% 15% 20% 25% 1-2019 1-2020 1-2021 1-2022 1-2023
Price Range Review
2023 Annual Report on the San Francisco County Housing Market
Area Overviews
Total Closed Sales Change from 2022 Percent Single-Family Percent Condo/TIC/Coop Months Supply of Inventory Days on Market Pct. of Orig. Price Received SF District 1 298 - 21.2% 56.4% 42.3% 0.8 34 101.7% SF District 2 398 - 23.3% 88.7% 11.1% 0.8 27 110.6% SF District 3 160 - 22.3% 84.4% 12.5% 0.9 30 104.8% SF District 4 314 - 18.2% 84.7% 12.7% 0.4 32 104.6% SF District 5 618 - 31.9% 38.5% 60.7% 1.0 39 101.1% SF District 6 264 - 34.7% 12.9% 84.8% 1.1 49 99.7% SF District 7 318 - 24.1% 28.9% 70.8% 1.8 47 96.8% SF District 8 412 - 25.5% 3.4% 95.6% 3.2 67 95.2% SF District 9 861 - 32.8% 22.6% 76.3% 3.1 60 97.9% SF District 10 449 - 23.1% 87.3% 10.2% 2.1 39 104.7%
Current as of January 11, 2024. All data from the San Francisco Association of REALTORS® MLS. Report © 2024 ShowingTime. | 9
Area Historical Median Prices
2019 2020 2021 2022 2023 Change From 2022 Change From 2019 SF District 1 $1,627,500 $1,700,000 $1,800,888 $1,750,000 $1,630,000 - 6.9% + 0.2% SF District 2 $1,452,500 $1,490,000 $1,660,000 $1,655,000 $1,477,500 - 10.7% + 1.7% SF District 3 $1,175,000 $1,200,000 $1,360,000 $1,300,000 $1,215,000 - 6.5% + 3.4% SF District 4 $1,600,000 $1,681,224 $1,856,200 $1,800,006 $1,630,000 - 9.4% + 1.9% SF District 5 $1,730,000 $1,665,000 $1,750,000 $1,750,000 $1,577,500 - 9.9% - 8.8% SF District 6 $1,285,000 $1,279,000 $1,315,316 $1,300,000 $1,250,000 - 3.8% - 2.7% SF District 7 $2,000,000 $1,920,000 $2,095,000 $2,100,000 $2,100,000 0.0% + 5.0% SF District 8 $1,072,500 $1,077,500 $1,149,500 $1,100,000 $982,500 - 10.7% - 8.4% SF District 9 $1,250,000 $1,206,000 $1,205,000 $1,200,000 $1,109,000 - 7.6% - 11.3% SF District 10 $1,040,000 $1,070,000 $1,120,000 $1,140,800 $1,050,000 - 8.0% + 1.0%
Annual Report on the San Francisco County Housing
Current as of January 11, 2024. All data from the San Francisco Association of REALTORS® MLS. Report © 2024 ShowingTime. | 10
2023
Market
