
Utah Farmers Market Consumer Preferences for Local Cut Flowers
Alison Bingham, USU Extension Intern, Department of Applied Economics
Kynda Curtis, Professor and USU Extension Specialist, Department of Applied Economics
Makaylie Langford, Research Assistant, Department of Applied Economics
Introduction
Cut flower production in Utah is a rapidly growing industry. The number of cut flower farms in Utah increased from approximately 20 farms in 2018 to over 200 in 2023. As of 2023, approximately 40 acres were devoted to cut flower production in Utah (Langford et al., 2023). According to a study evaluating the economic impact of the cut flower industry on Utah’s economy (Ward & Stock, 2022), the average revenue per acre in cut flower production was $64,000, demonstrating that cut flower production is potentially a very profitable business option on urban and small farms.
Farmers markets have been a popular outlet for locally grown foods and other products over the last several decades as consumer interest in purchasing directly from growers at direct-to-consumer markets has grown. Consumers seek fresh, high-quality, local products, as well as seasonal and unique options (Gumirakiza et al., 2015; Bosworth et al., 2015) Hence, direct-to-consumer markets offer a unique opportunity for local cut flower growers to market their products, but there is little information available on consumer preferences for local cut flowers at farmers markets. As growers look to expand their businesses, market information will be vital to their planning and long-term sustainability
In this fact sheet, we review the results of a 2024 study examining consumer preferences for local cut flowers at Utah farmers markets. Study data were collected in person via Qualtrics at six farmers markets across northern Utah, with 51 total responses. We discuss farmers market consumer purchasing preferences, familiarity with labeling programs, and preferred flower colors and varieties. Additionally, the factors influencing consumer decisions when purchasing cut flowers and the product information they rely on are discussed.
Overall, the information in this fact sheet will assist cut flower growers in making informed decisions regarding production methods and marketing strategies
Results Overview
Participant Demographics
Table 1 provides an overview of the study participant demographics. Just over 75% of the participants were married, and 93% were women. About 59% indicated an average of two to three people in the household, and 55% indicated they did not have children under 18 living in their household. Many (59%) indicated they were employed full-time, with about 24% employed part-time or homemakers. Almost 45% of participants were aged 18–34 years, 28% 35–54 years, and 27% were 55 and older. Around 93% had at least some college education, and 66% had completed a bachelor’s degree or higher. The majority (69%) reported an annual household income before taxes of $50,000 and above, with around 55% reporting an income of $90,000 and above.
Cut Flower Purchases and Preferences
Participants were asked how often they purchase flower products. Approximately 84% indicated purchasing cut flower products (in bunches, bouquets, or arrangements) at least several times a year (see Table 2). Almost 52% of participants indicated they bought potted house plants once a year or less, and 68% bought bedding
Table 1. Participant Demographics
plants several times a year or more. When questioned about their reasons for purchasing cut flowers, 84% of participants indicated they purchased flowers once a year or less for an anniversary, and 61% indicated they purchased flowers several times a year or more as a show of affection, with about 6% purchasing cut flowers weekly for this reason. About 65% of participants purchased cut flowers several times a year or more to decorate their home.
Table 2. Cut Flower Purchases
do you purchase the following flower products?
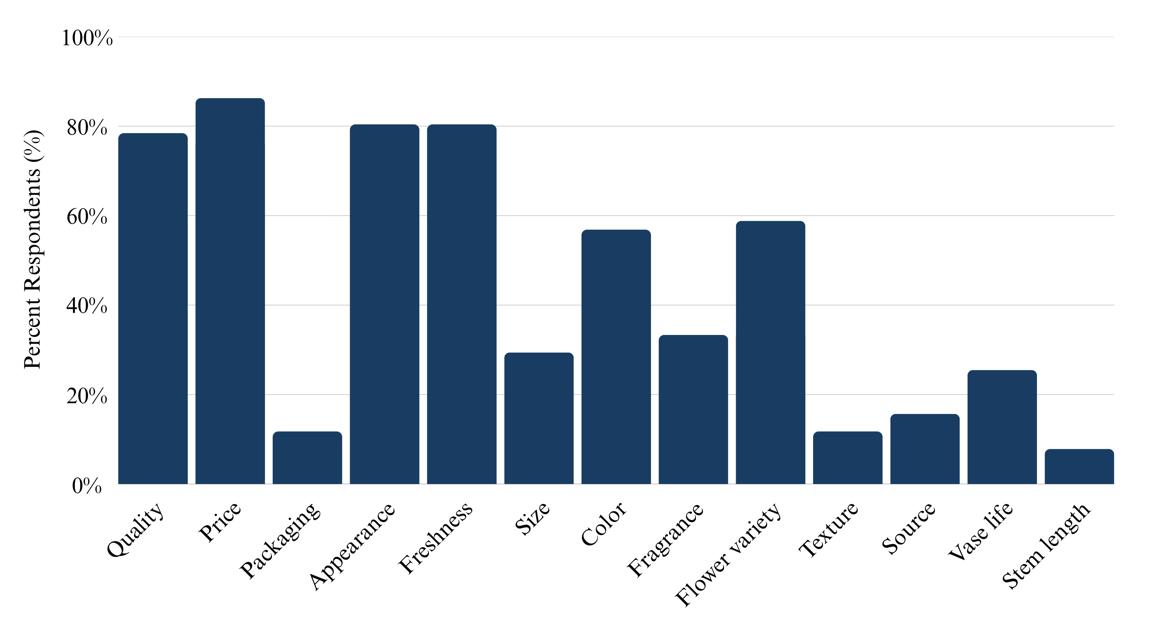
Study participants indicated that they spend a minimum of $9.75 and a maximum of $151 on each flower purchase, while the average amount spent per purchase was $46.00. When asked about the cut flower characteristics important to them, more than 83% indicated that quality, price, appearance, and freshness were most important (see Figure 1). Participants were less concerned with packaging, origin, texture, stem length, and vase life when purchasing cut flowers.
Participants were asked to indicate which cut flower colors they preferred. The top color was purple, followed by salmon/peach, and white/cream and pink tied for third. However, when asked which color scheme they preferred in an arrangement, the top choices were tied between muted/pastel/light tones (such as light pink, ivory, lavender, apricot/peach, sage, etc.) and uniquely themed flowers, such as wildflowers. The cut flower varieties most preferred included peonies, dahlias, and sunflowers (see Figure 2).
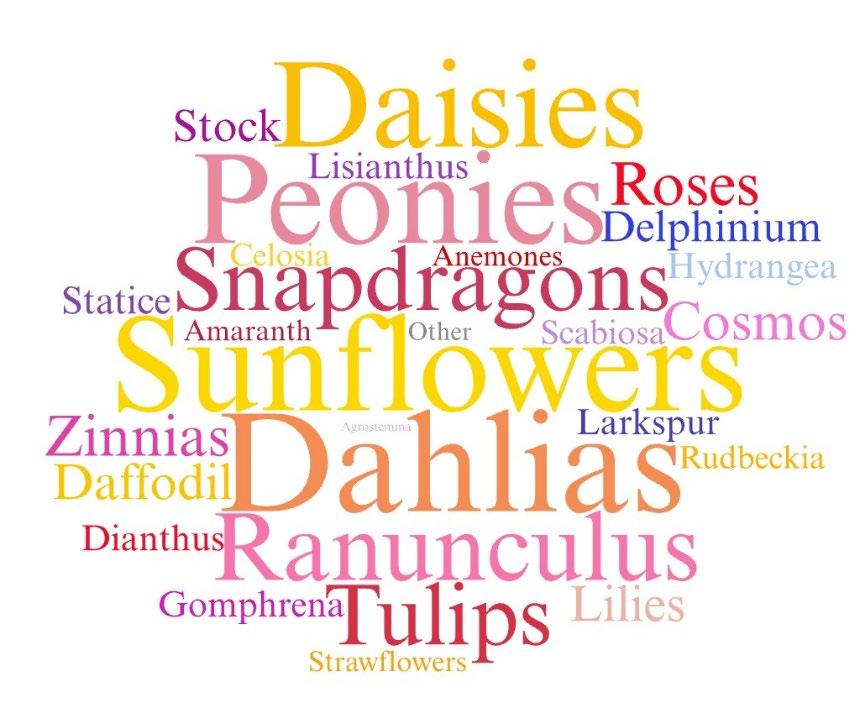
Note Variety name size indicates higher preference among study participants.
Familiarity and Preferences for Specialty Labeled Products
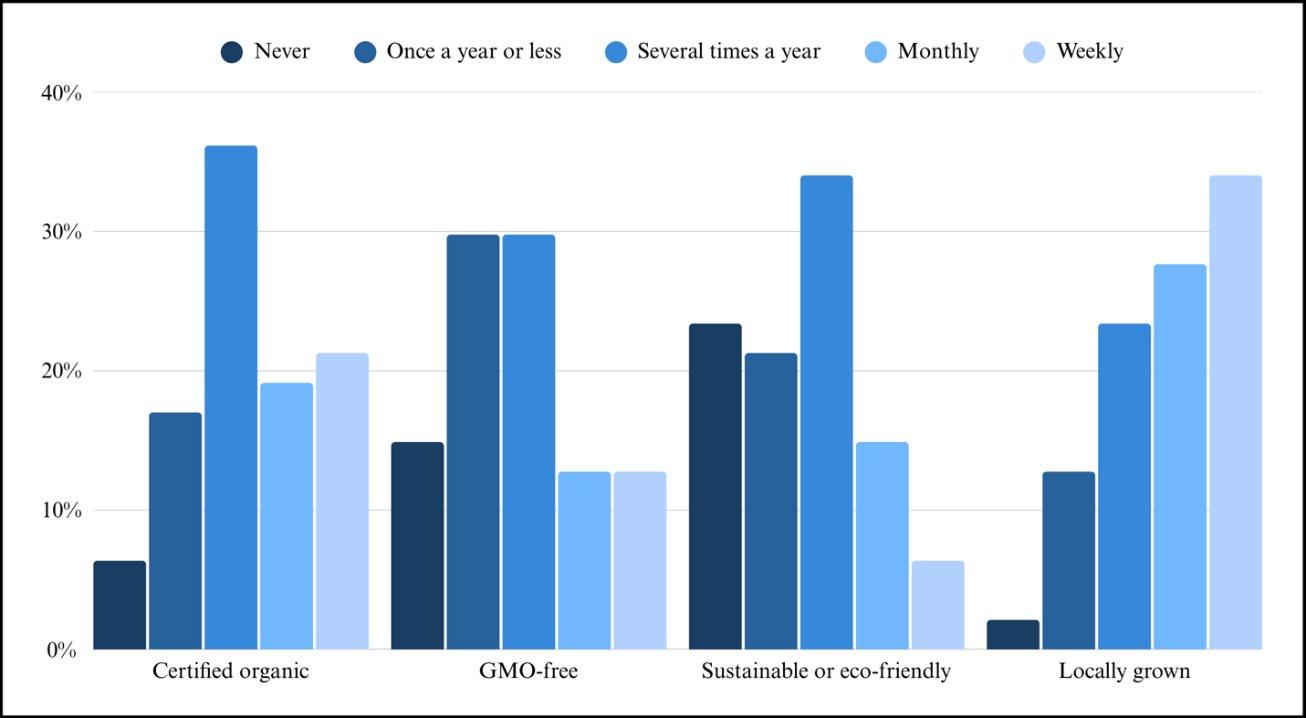
Survey participants were asked to describe their normal purchasing habits related to products with several specified specialty labels. Around 76% of participants indicated they purchased products with the certified organic label at least several times a year. Close to half, or 46%, purchased products with a GMO-free label once a year or less. In response to sustainable or eco-friendly labels, 54% of participants indicated purchasing products with these labels several times a year. Finally, 85% of participants indicated they buy products labeled locally grown several times a year (see Figure 3).
Figure
Figure 2. Preferred Flower Varieties
When asked to indicate their level of familiarity with cut flower certification and labeling programs, only 6% of participants indicated they were not at all familiar with the certified organic label, whereas 100% of participants were familiar with locally grown labels. Around 4% of participants were not familiar with the GMO-free label. Half of the participants were unfamiliar with the Rainforest Alliance Certified label, and just above 41% were unfamiliar with the Fairtrade International label. When asked to indicate the importance of labels in their purchasing decisions, the most important label to participants was locally grown or sourced, followed by pesticide-free and sustainable. This suggests that consumers are more likely to purchase floral products that align with their values (locally sourced, pesticide-free, sustainable). Local flower producers and retailers can enhance market appeal to consumers by using these labels in their marketing strategies.
Attitudes Toward Locally Grown Flowers
Study participants were asked to indicate their level of agreement with several statements on a scale of 1 to 5 (strongly disagree to strongly agree). Figure 4 shows they most agreed with the statements “Local flowers benefit local farmers” and “Local flowers are better for my community.” In response to the statement “Local flowers are better quality than non-local flowers,” only 5% disagreed. About 74% of participants agreed with the statements “Local flowers are better for the environment ” and “Local flowers are fresher than non-local flowers.” The results indicate there is strong support for locally sourced flowers. Study participants see the advantages of local cut flowers in terms of quality, environmental benefits, and community support.
Conclusions
In conclusion, cut flower farms in Utah are on the rise, and farmers are looking at current market trends for direction in their crop choices. Farmers market consumers clearly want to support products that align with their purchasing habits and preferences. When buying cut flowers, many consumers view local cut flowers as higher quality, more environmentally friendly, and beneficial to their communities. Farmers market consumers prioritize flower quality, price, appearance, and freshness when purchasing cut flower products. This information provided here enables cut flower growers to tailor their efforts with consumer needs and preferences, giving them a competitive edge and allowing them to meet market demands more effectively.
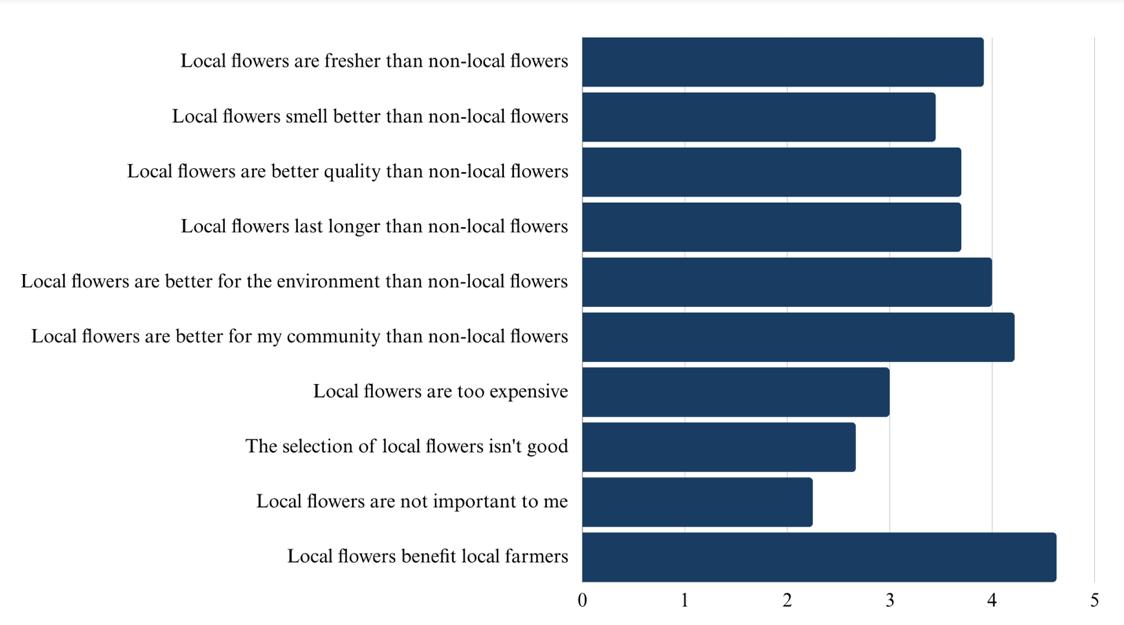
Note. Mean results on a scale of 1 to 5 (strongly disagree to strongly agree)
Acknowledgments
Support for this material was made in part by Utah State University (USU) Extension and by the National Institute of Food and Agriculture, U.S. Department of Agriculture (USDA), under award number 2022-3864037490-WS3SI through the Western Sustainable Agriculture Research and Education program under project number WPDP23-008. USDA is an equal opportunity employer and service provider. Any opinions, findings, conclusions, or recommendations expressed in this publication are those of the author(s) and do not necessarily reflect the view of the USDA. USU Extension provided all photos.
References
Bosworth, R., Bailey, D., & Curtis, K. (2015). Consumer willingness to pay for local designations: Brand effects and heterogeneity at the retail level. Journal of Food Products Marketing, 21(3), 274–292.
Gumirakiza, J. D., Curtis, K. R., & Bosworth, R. (2015). Farmers’ market consumer preferences for fresh produce attributes: Marketing and policy implications. Journal of Agribusiness, 33(1), 63–82.
Langford, M., Curtis, K., & Stock, M. (2023). An overview of the cut flower industry [Fact sheet]. Utah State University Extension.
Ward, R., & Stock, M. (2022). The value of cut flowers to Utah’s economy [Presentation] Utah State University Extension.
https://www.youtube.com/watch?v=iofT_OVfZIY&list=PLMnDQoXFVBEbhN_ZJ5fGZts81Dd2Xftjm&index= 25
In its programs and activities, including in admissions and employment, Utah State University does not discriminate or tolerate discrimination, including harassment, based on race, color, religion, sex, national origin, age, genetic information, sexual orientation, gender identity or expression, disability, status as a protected veteran, or any other status protected by University policy, Title IX, or any other federal, state, or local law. Utah State University is an equal opportunity employer and does not discriminate or tolerate discrimination including harassment in employment including in hiring, promotion, transfer, or termination based on race, color, religion, sex, national origin, age, genetic information, sexual orientation, gender identity or expression, disability, status as a protected veteran, or any other status protected by University policy or any other federal, state, or local law. Utah State University does not discriminate in its housing offerings and will treat all persons fairly and equally without regard to race, color, religion, sex, familial status, disability, national origin, source of income, sexual orientation, or gender identity. Additionally, the University endeavors to provide reasonable accommodations when necessary and to ensure equal access to qualified persons with disabilities. The following office has been designated to handle inquiries regarding the application of Title IX and its implementing regulations and/or USU’s non-discrimination policies: The Office of Equity in Distance Education, Room 400, Logan, Utah, titleix@usu.edu, 435-797-1266. For further information regarding non-discrimination, please visit equity.usu.edu, or contact: U.S. Department of Education, Office of Assistant Secretary for Civil Rights, 800-421-3481, ocr@ed.gov or U.S. Department of Education, Denver Regional Office, 303-844-5695 ocr.denver@ed.gov. Issued in furtherance of Cooperative Extension work, acts of May 8 and June 30, 1914, in cooperation with the U.S. Department of Agriculture, Kenneth L. White, Vice President for Extension and Agriculture, Utah State University. July 2024 Utah State University Extension

May 2025
Utah State University Extension
Peer-reviewed fact sheet