Community Health Worker: Common Indicator and Training Experiences Survey
COMMUNITY HEALTH WORKER
COMMON INDICATOR AND TRAINING EXPERIENCES SURVEY
Summary of Results for the State of Illinois, 2023 - 2024
Released: January 2025
This report was prepared by the University of Illinois Cancer Center, in collaboration with the ENACT Working Group and the Illinois CHW Survey Group, for the Illinois Department of Public Health
Please cite this report as: University of Illinois Cancer Center. (2025). Community Health Worker Common Indicator and Training Experiences Survey: Summary of results for the State of Illinois, 2023 – 2024.
LIST OF FIGURES
10
10
12
13
13
14
14
15
16
17
17
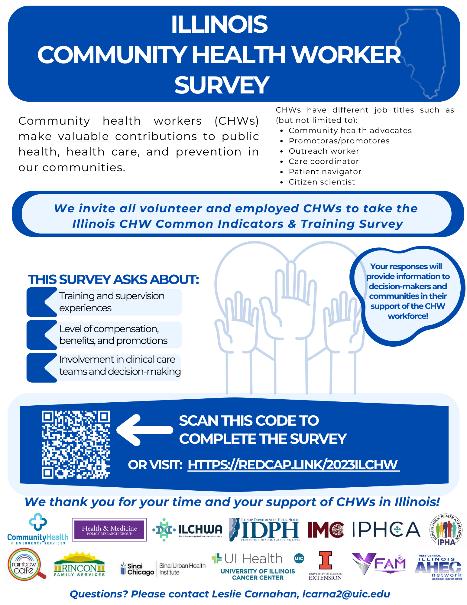
Figure 1: CHW CI and training experiences survey flyer (English)
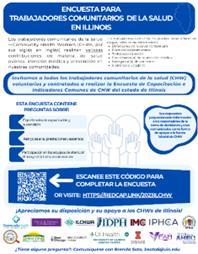
Figure 2: CHW CI and training experiences survey flyer (Spanish)
Figure 3: Determination of final analytic sample, exclusion criteria, and the number of records excluded at each stage of determination
Figure 4: Age distribution of survey respondents (n=450)
Figure 5: Respondent gender (n=450)
Figure 6: Respondent race/ethnicity (n=450)
Figure 7: Selected language for survey (n=450)
Figure 8: Distribution map of CHW survey responses by county of residence
Figure 9: Distribution map of CHW survey responses by zip code within Cook County
Figure 10: Percent of CHWs residing in metro and non-metro counties (n=434)
Figure 11: Percent of CHWs residing in and out of Cook County (n=434)
18 Figure 12: CHW service type (n=450)
18 Figure 13: Years of service as a CHW (n=450)
19 Figure 14: CHW title (n=450)
20 Figure 15: Types of organizations where CHWs work (n=450)
21 Figure 16: Map of counties where survey respondents provide CHW services
22 Figure 17: Map of zip codes within Cook County where survey respondents provide CHW services
23 Figure 18: Completion of a CHW Core 101 training and / or Specialized CHW training (n=450)
23 Figure 19: Completion of specialized CHW training (n=450)
24 Figure 20: Completion of a CHW supervisor training (n=450)
25 Figure 21: Confidence in CHW skills and knowledge competencies (n=450)
26 Figure 22: Percent of CHWs with very high self-rated confidence in CHW competencies, differences by CHW Core 101 training status
27 Figure 23: Employment status of CHWs (n=397)
27 Figure 24: Average and range number of hours worked per week based on employment status
28 Figure 25: Mean and range annual salary for full-time CHWs, by metropolitan status
28 Figure 26: Mean and range hourly rate for part-time CHWs, by metropolitan Status
29 Figure 27: Benefits offered by employers of full-time CHWs (n=313)
30 Figure 28: Benefits offered by employers of part-time CHWs (n=84)
31 Figure 29: CHW eligibility for promotions / step-ups with pay increase (n=411)
31 Figure 30: CHW eligibility for promotions / step-ups based on employment status
32 Figure 31: Distinction between administrative and clinical supervision and whether oversight of supervision is handled by different people
33 Figure 32: Mean and range hours of supervision in the last 30 days, by full- and part-time status
33 Figure 33: CHWs perceived overall quality of individual / group supervision received within the last 30 days (n=442)
34 Figure 34: Perceptions of supportive and reflective CHW supervision
35 Figure 35: Frequency of communication about program participants with colleagues
36 Figure 36: Relational Coordination Scale, mean scores from individual statements
37 Figure 37: Influence of Racism and Other Forms of Discrimination Scale
38 Figure 38: Influence of Racism and Other Forms of Discrimination Scale, mean scores from individual statements, differences by self-identified racialized identity
39 Figure 39: Additional Questions about Integration into Teams (n=442).
39 Figure 40: Record Information Access (n=443)
39 Figure 41: CHW has an employer provided workspace (n=443)
40 Figure 42: CHW Involvement in Decision and Policymaking Scale
LIST OF TABLES
42 Table 1: Sociodemographic characteristics of survey respondents (n=450)
43 Table 2: Serving as a CHW (n=450)
44 Table 3: Types of organizations where CHWs work, by metro and non-metro status
45 Table 4: Completed CHW Core 101 and specialized training (n=450)
46 Table 5: Organizations from which CHWs stated they had taken a training (n=237)
48 Table 6: Confidence in CHW skills and knowledge competencies (n=450)
49 Table 7: Confidence in CHW skills and knowledge competencies by CHW Core 101 training completion status
50 Table 8: Average number of hours worked per week, by full- and part-time status
51 Table 9: Current reported level of compensation, by employment status (full- or part-time) and metropolitan status
52 Table 10: Benefits CHWs reported to be offered by their employers, by full-time or part-time employment status
53 Table 11: Eligibility for promotion/step-ups with pay increases, based on employment status
54 Table 12: CHWs experience with supervision (n=442)
55 Table 13: Supervisor Attitudes and Characteristics (n=443)
56 Table 14: CHW integration into team, the Relational Coordination Scale, summary score by individual statement and full scale
57 Table 15: Influence of Racism and Other Forms of Discrimination on CHW Integration (n=443)
58 Table 16: Percent of CHWs reporting their race/ethnicity or culture negatively influences the way they are viewed or treated by colleagues completely/always/a lot, differences by self-identified racialized identity
59 Table 17: Additional questions about CHW integration into teams
60 Table 18: CHW Involvement in Decision and Policy Making (n=450)
ACRONYMS
CBO Community-Based Organization
CHW Community Health Worker
CHW-CRE Community Health Worker Center for Research and Evaluation
CI Common Indicator
COPD Chronic obstructive pulmonary disease
CRM Community Resilience Model
ENACT Environmental Scan of Community Health Worker Assets in Illinois
FQHC Federally Qualified Health Center
IDPH Illinois Department of Public Health
IROFD Influence of Racism and Other Forms of Discrimination
MCO Managed Care Organization
PCA Patient Care Assistant
REDCap Research Electronic Data Capture
RCS Relational Coordination Scale
RUCC Rural-Urban Continuum Codes
SAS Statistical Analysis System
SOAR SSI/SSDI Outreach, Access and Recovery
SPSS Statistical Package for the Social Sciences
SSDI Social Security Disability Insurance
SSI Supplemental Security Income
ACKNOWLEDGEMENTS
The CHW CI and Training Experiences Survey Team would like to thank all the CHWs, including those going by another title, like promotor or promotora, outreach worker, or community health advocate, that completed the CHW CI and Training Experiences Survey.
The CHW CI and Training Experiences Survey Team would also like to thank Dr. Noelle Wiggins, Pennie Jewell, and Victoria Adewumi of the National CHW Center for Research and Evaluation (formerly, the CHW Common Indicators Project) for their guidance and support throughout the planning process. For more information about the National CHW CI Project, visit https://www.chwcre.org/ The CHW-CRE Leadership Team has previously supported the CHW CI survey efforts in Illinois, wherein they were involved in the creation and fielding of the Illinois Community Health Worker-Common Indicator Employer Survey 1
The ENACT team would like to acknowledge the work of Dr. Margaret Wright Geise and Ekas Singh Abrol from the University of Illinois Cancer Center Data Integration Shared Resource for their contributions to this report, which includes the geospatial visualizations.
The ENACT Project was funded by an IDPH Intergovernmental Agreement.
1 Illinois Community Health Worker-Common Indicator Employer Survey Data Team. Community Health Worker Common Indicator Employer Survey: Summary Results for the State of Illinois. 2023. https://dph.illinois.gov/content/dam/soi/en/web/idph/publications/idph/topics-and-services/preventionwellness/chw/chw-employer-survey-report_52023.pdf
PROJECT TEAM
The CHW CI and Training Experiences Survey was created and disseminated through a collaborative effort between the following organizations in Illinois:
● Community Health & Emergency Services, Inc.
● Health & Medicine Policy Research Group
● Illinois Community Health Workers Association
● Illinois Department of Public Health
● Illinois Migrant Council
● Illinois Primary Health Care Association
● Illinois Public Health Association
● Rainbow Café LGBTQ Center
● Rincon Family Services
● Sinai Urban Health Institute
● University of Illinois Cancer Center
● University of Illinois Extension
● Valley Kingdom Development Corporation
● West Central Illinois Area Health Education Center
The CHW CI Employer Survey Team consisted of the following members:
● Community Health & Emergency Services, Inc. (Joanie Bishop, Jessica Bradshaw, JP Champion & Kanci Houston)
● Health & Medicine Policy Research Group (Angela Eastlund & Anna Yankelev)
● Illinois Community Health Workers Association (Leticia Boughton Price & Wandy Hernandez)
● Illinois Department of Public Health (Sarahjini Nunn & Lori Weiselberg)
● Illinois Migrant Council (Esperanza Gonzalez, Diana Ramos, Maggie Rivera, Margarita Rivera, & Miguel Sarmiento)
● Illinois Primary Health Care Association (Cheri Hoots, Ashley Colwell & Paula Campbell)
● Illinois Public Health Association (Michelle Sanders & Tracey Smith)
● Rainbow Cafe LGBTQ Center (Claire Hughes & Carrie Vine)
● Sinai Urban Health Institute (Stacy Ignoffo & Patricia Labellarte)
● University of Illinois Cancer Center (Leslie Carnahan, Noor Hasan, Yamilé Molina, Jeanette Santana Gonzalez, Judith Sayad, Brenda Soto, Ed Tsai, Anna Whelan & Hannah Williams)
● University of Illinois Extension (Jennifer McCaffrey & Dee Walls)
● Valley Kingdom Community Development Corporation (Runisia Henry, Kendall Henry, Ronda Wendford & Nathaniel Aikens)
● West Central Illinois Area Health Education Center (Mary Jane Clark, Shelly Fox, & Jordan Cary)
EXECUTIVE SUMMARY
Background: In support of work done nationally and statewide, the Community Health Worker Common Indicators (CHW CI) and Training Experiences Survey was launched to support the assessment of the CHW training landscape in Illinois. The University of Illinois Cancer Center, in collaboration with 13 other organizations, launched the survey with funding and support from the Illinois Department of Public Health and guidance from the CHW Center for Research and Evaluation Leadership Team.
Methodology: The CHW CI and Training Experiences survey, conducted between December 2023 and February 2024, recruited employed or volunteer adult CHWs residing in Illinois. The survey team used multiple non-probability-based recruitment methods to recruit participants and recruitment materials were available in both English and Spanish. Participants completed the survey in English or Spanish via an online REDCap form or via paper instrument. The survey included questions about the CHWs’ background, training experiences, CHW competencies, and CHW CI workforce indicators. Before the survey was launched it went through pilot testing in English and Spanish. All survey responses were assessed for eligibility and missingness, which resulted in an overall analytic sample of 450 respondents. Afterwards, the survey team used standard data cleaning procedures before completing data analysis.
Results: Given the breadth of the topics covered in the survey, the results are extensive and wide-ranging. In terms of CHWs’ backgrounds, there was almost an even distribution of respondents who described their race as Black, White, or Hispanic/Latino(a) and about 58% of respondents resided in Cook County. About 62% of respondents stated they had completed a CHW Core 101 training; those who had completed this basic skills training, compared to those who had not, were more likely to rate their confidence level as very confident for multiple skills and knowledge competencies. Around 73% of CHWs reported serving in this role for 5 years or less.
Findings from the CI workforce indicators indicate significant differences in annual wages for full-time CHWs in metropolitan ($46,280) and non-metropolitan ($38,230) areas. When asked to rate supervisor attitudes and characteristics, respondents rated their supervisors highest on rating scale measures related to encouraging professional growth and understanding community strengths and needs.
On average, respondents reported being part of highly collaborative and communicative teams However, rating scale scores indicate that experiences may vary for those CHWs with racialized identities. Respondents agree that their input is sought by those with influence in decision making processes, but there was less agreement with statements related to direct involvement in actively participating in policymaking or influencing policy.
Conclusion: The findings from the CHW CI and Training Experiences Survey are extensive and far-reaching and contribute to a clearer understanding of the current landscape of CHW demographics, experiences, and skills in Illinois. These findings will be used to inform the IDPH Illinois CHW Certification Program while also contributing to other national and state-wide efforts to assess the work and impact of CHWs in the United States.
SURVEY BACKGROUND
Community health workers (CHWs)2 are essential to addressing disparities in health care delivery and health outcomes in vulnerable populations. In the United States, the sustainability of this workforce is threatened by low wages, poor job security, and limited opportunities for comprehensive training and advancement. Passed in 2021, the Illinois Community Health Worker Certification and Reimbursement Act (410 ILCS 67), intends to address these issues through the creation of a CHW certification program and states: 3
There is created within the Department of Public Health the Illinois Community Health Worker Certification Program. The Department shall serve as the Program's regulatory body with the advice and recommendation of the Community Health Workers Review Board. This includes the development and oversight of initial community health worker certification and certification renewals for both individuals and community-based and academic training programs.
There are efforts to standardize indicators and constructs to assess the work and impact of CHWs in the United States. The CHW Common Indicators (CI)4 are the result of a national effort to identify, develop, and validate constructs and process / outcome indicators to be used across CHW programs and for CHW research and evaluation.5 There are three categories of intended respondents: CHWs, employers, and program participants. In support of the legislation, the CHW CI project, as well as statewide efforts to assess the CHW training landscape, the CHW CI and Training Experiences Survey was conducted in Illinois. This was the first time that the CI survey had been launched in the state with CHWs. Importantly, a CHW CI-Employer Survey6 was implemented in Illinois in 2022.
The survey was launched through a collaborative effort of 14 organizations with funding and support from the Illinois Department of Public Health (IDPH) Staff at the University of Illinois Cancer Center (Cancer Center) oversaw data collection, analysis, and reporting.
2 The CHW Section of the American Public Health Association has adopted the following definition: A CHW is a frontline public health worker who is a trusted member of and/or has an unusually close understanding of the community served. This trusting relationship enables the worker to serve as a liaison/link/intermediary between health/social services and the community to facilitate access to services and improve the quality and cultural competence of service delivery. A CHW also builds individual and community capacity by increasing health knowledge and selfsufficiency through a range of activities such as outreach, community education, informal counseling, social support and advocacy. American Public Health Association. Community Health Workers. apha.org. 2019. https://www.apha.org/apha-communities/member-sections/community-health-workers
3 Illinois General Assembly. Public Health (410 ILCS 67/) Community Health Worker Certification and Reimbursement Act. Ila.gov. 2021. https://www.ilga.gov/legislation/ilcs/ilcs5.asp?ActID=4090&ChapterID=35
4 The National Center for Research and Evaluation continues to develop, pilot, and disseminate process and outcome indicators. Visit https://www.chwcre.org/promotion-of-common-indicators for more information. Groups interested in using the indicators are encouraged to contact info@chwcre.org for more information.
5 Community Health Worker Center for Research and Evaluation What We Do: Promotion of Common Indicators. 2023. https://www.chwcre.org/promotion-of-common-indicators
6 Illinois Community Health Worker-Common Indicator Employer Survey Data Team. Community Health Worker Common Indicator Employer Survey: Summary Results for the State of Illinois. 2023. https://dph.illinois.gov/content/dam/soi/en/web/idph/publications/idph/topics-and-services/preventionwellness/chw/chw-employer-survey-report_52023.pdf
METHODOLOGY
SETTING, PARTICIPANTS, SAMPLING, AND RECRUITMENT
CHWs were able to complete the CHW CI and Training Experiences Survey between December 1, 2023, and February 16, 2024. Self-reported eligibility requirements were: 1) experience as a CHW, whether in a paid or volunteer capacity; 2) >18 years of age; and 3) residence in Illinois. The CHW CI and Training Experiences survey team used multiple non-probability-based recruitment methods, including electronic and physical flyer distribution and word-of-mouth, to recruit participants. Recruitment materials were available in English (Figure 1) and Spanish (Figure 2).
The survey team promoted the survey by emailing the flyer to their listservs and established networks of CHWs, CHW trainers, CHW employees, and CHW advocates. In addition to the initial launch email, five reminder emails were sent. Other methods of electronic flyer distribution included newsletters, social media pages, and virtual meetings. Physical flyers were distributed during in-person encounters with CHWs, CHW trainers, and CHW employers.
Email was the most frequently utilized survey dissemination mechanism. Collectively, the team sent emails to over 2800 individual CHW contacts, 70 organizational contacts, and 54 federally qualified health centers (FQHCs) in Illinois, although it is not possible to ascertain if there was duplication among contacts. Seven organizations distributed the survey in their newsletters and reported that newsletters were shared over 50 times. Two organizations posted the link on their website. The survey was also shared multiple times on social media including Facebook (~17 times) Instagram (~15 times), LinkedIn (~3 times), and TikTok (~15 times). In person communication was used at a minimum of four events and by informal word of mouth.
Participants did not receive an incentive for participation. This project was officially recognized as a quality improvement effort by the University of Illinois at Chicago's research policy (formal determination of quality improvement status, protocol #20230402)
Figure 1: CHW CI and Training Experiences survey flyer (English)
Figure 2: CHW CI and Training Experiences survey flyer (Spanish)
DATA COLLECTION AND ANALYSIS
After providing informed consent, participants completed the survey in either English or Spanish, via an online REDCap survey or a paper instrument. Nearly all surveys (>99%) were self-administered online wherein participants directly entered their responses into the REDCap database. Research staff entered the paper surveys (n=2) into REDCap.
The survey instrument included 51 items, including questions about CHW’s background and training experiences, self-rated confidence in CHW competencies, demographic information, and the following CHW CI workforce indicators:
• CHW Level of Compensation, Benefits, and Promotion (CHW CI #1)
• CHW Involvement in Decision and Policy Making (CHW CI #4)
• CHW Integration into Teams (CHW CI #5)
• Supportive and Reflective CHW Supervision (CHW CI #12)
The CHW CI workforce indicator questions in the survey had been pilot tested previously.7,8 Prior to the state-wide launch, the survey, inclusive of the CHW CI workforce indicators and the training questions, was further pilot tested in two rounds to assess the extent to which the instrument was appropriate, comprehensible, clearly defined, and presented in a suitable manner. Initially, five CHWs pilot-tested the English survey instrument. After slight adjustments were made to the instrument, it was professionally translated into Spanish and verified for accuracy and appropriateness by bilingual research staff. Next, another five CHWs pilot-tested the Spanish survey. Again, there were minimal adjustments made to the instrument prior to its launch.
All statistical procedures were performed using SAS (Version 9.4, SAS Institute Inc., Cary, NC: SAS Institute Inc.) and SPSS (Version 29.0, IBM Corporation, Armonk, NY: IBM Corp). First, overall and item specific missingness was assessed; this determined the analytic sample (n=450) (Figure 3). Next, standard data cleaning procedures were implemented; this included removing incomplete responses from the analytic sample, identifying and reviewing outliers, coding open-ended responses, and performing data consistency and quality assurance checks. Statistical comparisons of means and group differences were conducted using several methods (i.e., t-tests, chi-square tests) tailored to the nature of the data. Specific methods are further described in table footnotes.
7 Rodela K, Wiggins N, Maes K, et al. The Community Health Worker (CHW) Common Indicators Project: Engaging CHWs in Measurement to Sustain the Profession. Front Public Health. 2021;9:674858. Published 2021 Jun 22. doi:10.3389/fpubh.2021.674858
8 Wiggins N, Maes K, Palmisano G, Avila LR, Rodela K, Kieffer E. A Community Participatory Approach to Identify Common Evaluation Indicators for Community Health Worker Practice. Prog Community Health Partnership 2021;15(2):217-224. doi:10.1353/cpr.2021.0023
Figure 3: Determination of final analytic sample, exclusion criteria, and the number of records excluded at each stage of determination
EXCLUDED
Unknown eligibility, n=26
No CHW experience, n=58
EXCLUDED
Did not answer consent question, n=99
Refused consent, n=5
EXCLUDED Incomplete responses, n=233
EXCLUDED Home zip code not in Illinois n=13
Visited survey link n=884
Assessed for Eligibility n=800
Initiated Survey n=696
Completed survey n=463
Included in Analytic Sample n=450
RESULTS
CHW BACKGROUND
SOCIODEMOGRAPHIC CHARACTERISTICS (see TABLE 1 in appendix)
Survey respondents were asked a series of questions about their sociodemographic characteristics, including age, gender, and race / ethnicity. About 42% of respondents were between 18-40 years old and the average age was 41.9 +13.9 years (Figure 4).
18-40 years old
41-60 years old
61-79 years old
Missing
Respondents were asked to describe their gender through a check all that apply question. About 64% described their gender as female (Figure 5).
More than one gender
Transgender
Non-binary
A gender not lister here
Prefer not to answer
Figure 4: Age distribution of survey respondents (n=450)
Figure 5: Respondent gender (n=450)
Respondents were asked to best describe their race/ethnicity through a check all that apply question. There was almost even distribution of respondents who described their race as Black (24%), White (24%), or Hispanic/Latino(a) (22%) (Figure 6).
Selected language for survey completion was used as a proxy for assessing language preference. More than 18% of respondents completed the survey in Spanish (Figure 7).
Figure 6: Respondent race/ethnicity (n=450)
Figure 7: Selected language for survey (n=450)
PLACE OF RESIDENCE
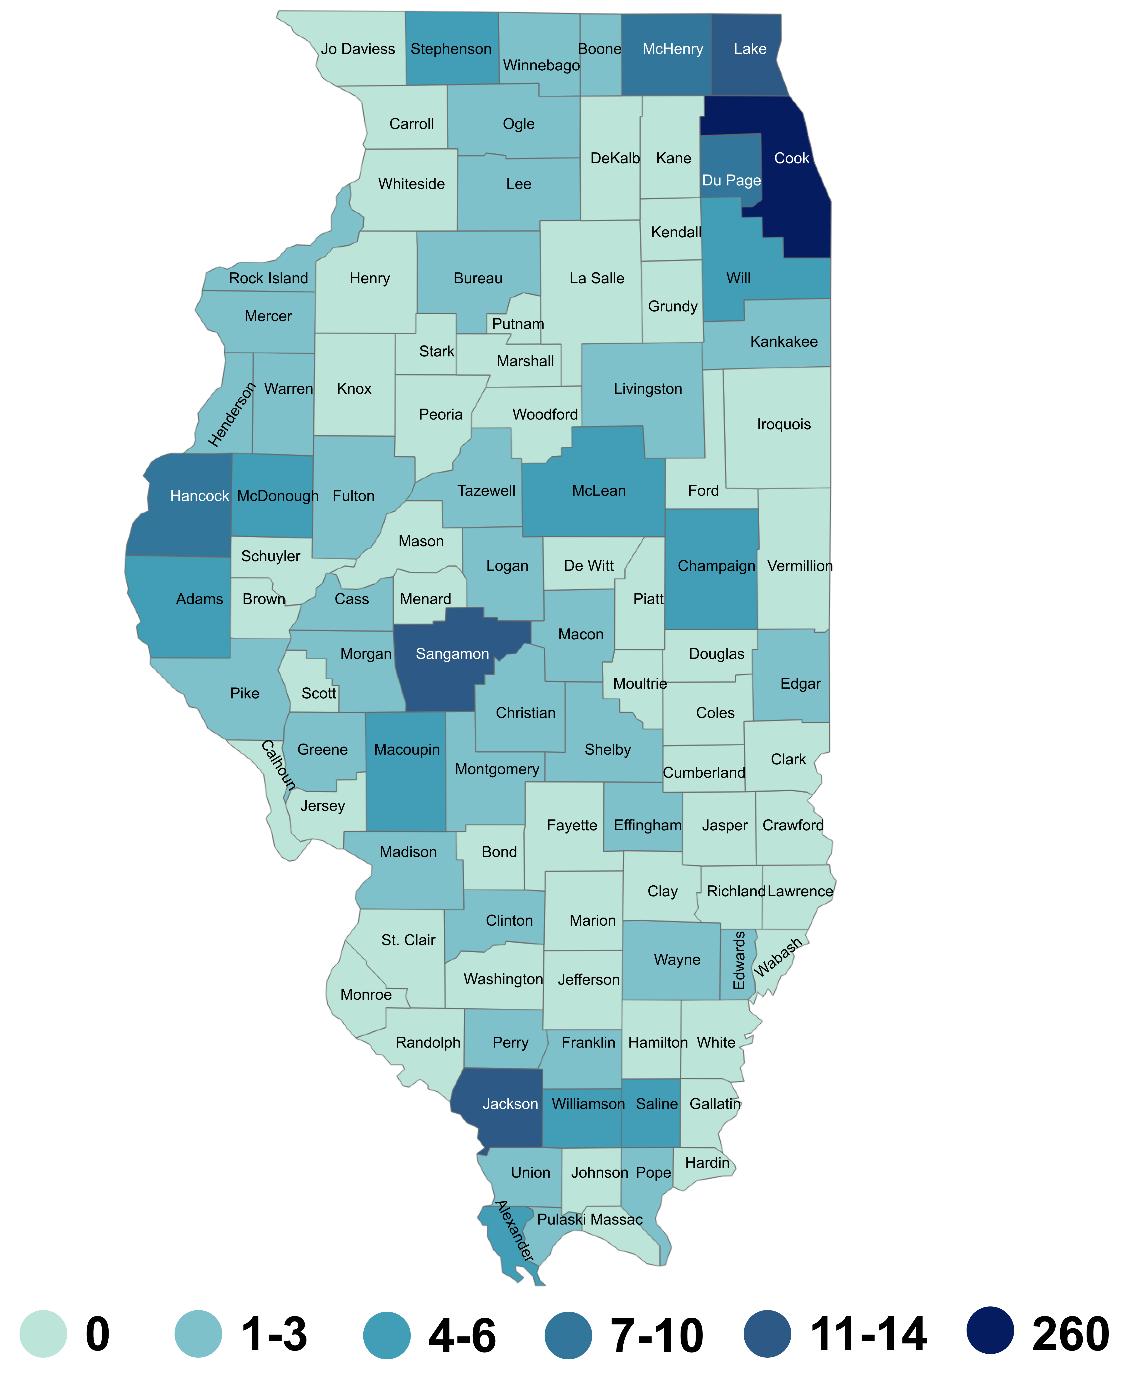
Survey respondents’ county of residence was determined based on the home zip code that was provided. In total, 52 unique counties (51% of Illinois’s 102 counties) were represented; this was determined by the 176 unique zip codes reported by survey respondents (Figure 8). About 58% (n=260) of respondents reported their place of residence as Cook County. Between 11-14 survey respondents reported Jackson, Lake, Sangamon, or St. Clair counties as their place of residence.
0 1-3 4-6 7-10 11-14 260
Figure 8: Distribution map of CHW survey responses by county of residence
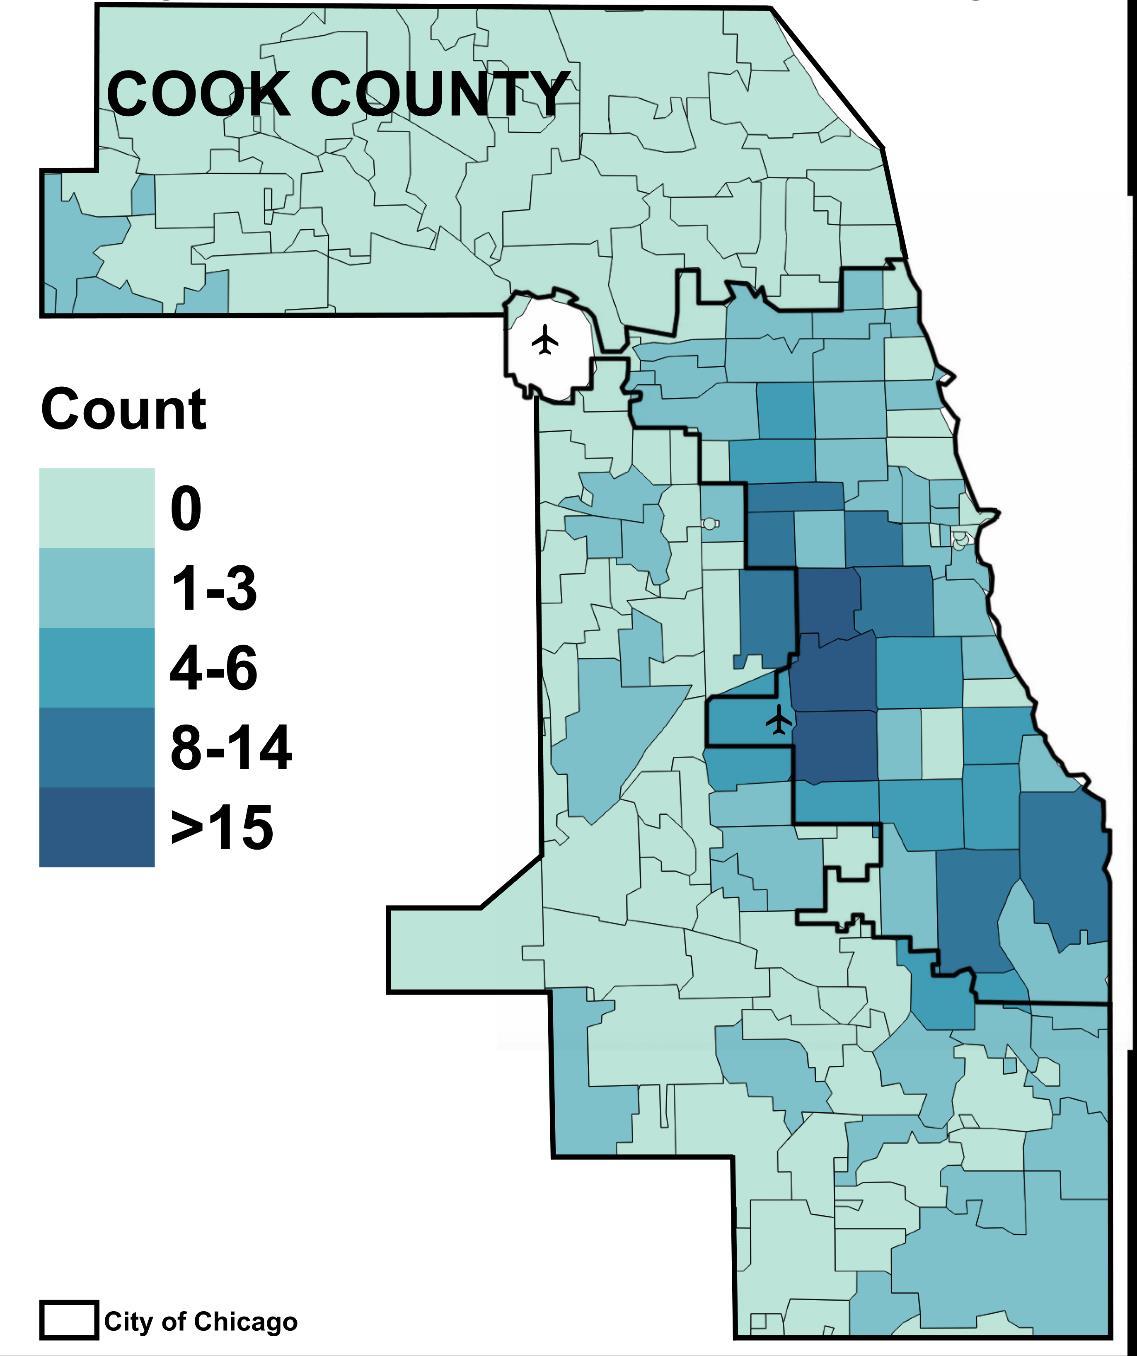
In Cook County, most respondents reported their zip code of residence to be in the City of Chicago, including three zip codes with more than 15 survey respondents (Figure 9).
9: Distribution map of CHW survey responses by zip code within Cook County
City of Chicago
Figure
In order to understand the rural and urban geography of the United States, the U.S. Department of Agriculture developed the Rural-Urban Continuum Codes (RUCC)9,10 system. This county-based system is widely used to analyze data and, in many cases, direct resources. In this survey, it was used to determine the degree of urbanization regarding respondents’ place of residence. Based on the RUCC classification, about 18% of CHWs lived in counties designated as non-metropolitan (non-metro) and 82% in counties designated as metropolitan (metro) (Figure 10).
Figure 10: Percent of CHWs residing in metro and non-metro counties (n=434)
Finally, about 40% of respondents reported residing in a zip code in Cook County and 60% in a county other than Cook County (Figure 11).
Figure 11: Percent of CHWs residing in and not in Cook County (n=434)
Not Cook County Cook County
9 Economic Research Service. U.S. Department of Agriculture. Rural-Urban Continuum Codes. January 22, 2024. https://www.ers.usda.gov/data-products/rural-urban-continuum-codes/
10 The RUCC classification distinguishes U.S. metropolitan counties by the population sizes of their metropolitan areas; in non-metropolitan counties, it is used to distinguish their rural areas, non-rural areas and measure the degree of rurality and urbanization based on the size of the non-metro population that lives adjacent to a metro area.
SERVING AS A CHW
CHW SERVICE TYPE
Community health workers were asked if their service as a CHW had been in an unpaid, volunteer only position, or if it was in a paid employment position. Just about 91% of CHWs reported that their work had been in a paid, employed position and 9% had been in an unpaid, volunteer position (Figure 12).
See Appendix Table 2 for more information.
YEARS OF SERVICE AS A CHW
Survey respondents were asked to estimate the total number of years they had served as a CHW. About 31% of respondents had served for less than two years and about 13% had served for 11+ years (Figure 13); the average years of service was 5.1 + 6.8 years of service.
See Appendix Table 2 for more information.
Figure 13: Years of service as a CHW (n=450)
Figure 12: CHW service type (n=450)
Respondents were asked to select their title from a list of options. Community health worker was the most common title (50%), followed by promotor/promotora (13%) and outreach worker (9%) (Figure 14). About 12% of respondents indicated that their title was not listed and nearly 40 additional titles were shared.8
See Appendix Table 2 for more information.
Community Health Worker
Promotor/Promotora
8 Bilingual Program Manager, Case Worker, CHW Bilingual Trainer, CHW Supervisor (4), CHW Lead (4), Client Benefits Supervisor, Community Affairs Specialist II, Community Champion, Community Engagement Manager, Community Health Manager, Community Health Navigator, Community Health Response Worker (2), Community Health Response Worker Lead, Community Outreach Coordinator, Community Relations Lead, Director of Care Coordination, Director of Education & Outreach, Director of Health, Director of Operations, Domestic Violence Advocate, Family Support Specialist, Fiscal Services, Health Equity Specialist, Health Promotion Specialist, Home Visitor, Insurance Navigator, Patient Support Services, President/CEO, Private Caregiver, Program Coordinator (6), Program Director (2), Program Services Assistant, Program Service Specialist, Public Health Ambassador, Referral Coordinator, Quality Director, Quality Nurse, Vice President
Figure 14: CHW title (n=450)
TYPE OF ORGANIZATION WHERE CHW WORKS
Respondents were asked to select from a list the type of organization where they currently worked. Overall, community-based organizations (CBOs) (34%), FQHCs (15%), and health systems / hospitals / hospital clinics (12%) were selected most often (Figure 15). Around 4% of respondents indicated that they worked for another type of organization.9 Almost 2% of CHWs reported that they were not currently working as a CHW. Differences emerged when looking at where CHWs work by metropolitan status. Among CHWs residing in metro areas, 38% serve at a CBO, 13% at an FQHC, and 12% at a health system / hospital / hospital / clinic. Among non-metro CHWs, 26% serve at a FQHC, 22% at an academic institution, and 22% serve at a behavioral health organization.
See Appendix Table 3 for more information.
Figure 15: Types of organizations where CHWs work (n=450)
Community-based organization
Federally qualified health center
Health system / hospital / hospital clinic
Community health organization
Academic (4-yr university, community college)
Local health department (county,district, city)
Community health center (not FQHC)
Social service agency
Behavioral health organization
Faith-based organization
Medicaid MCO / Medicaid health plan
Independent medical practice
Child development lab school
Schools / School-based health center
Other type of organization
Not currently working as a CHW
Missing
Total (n=450) Metro (n=357) Non-metro (n=77)
CHW SERVICE AREA
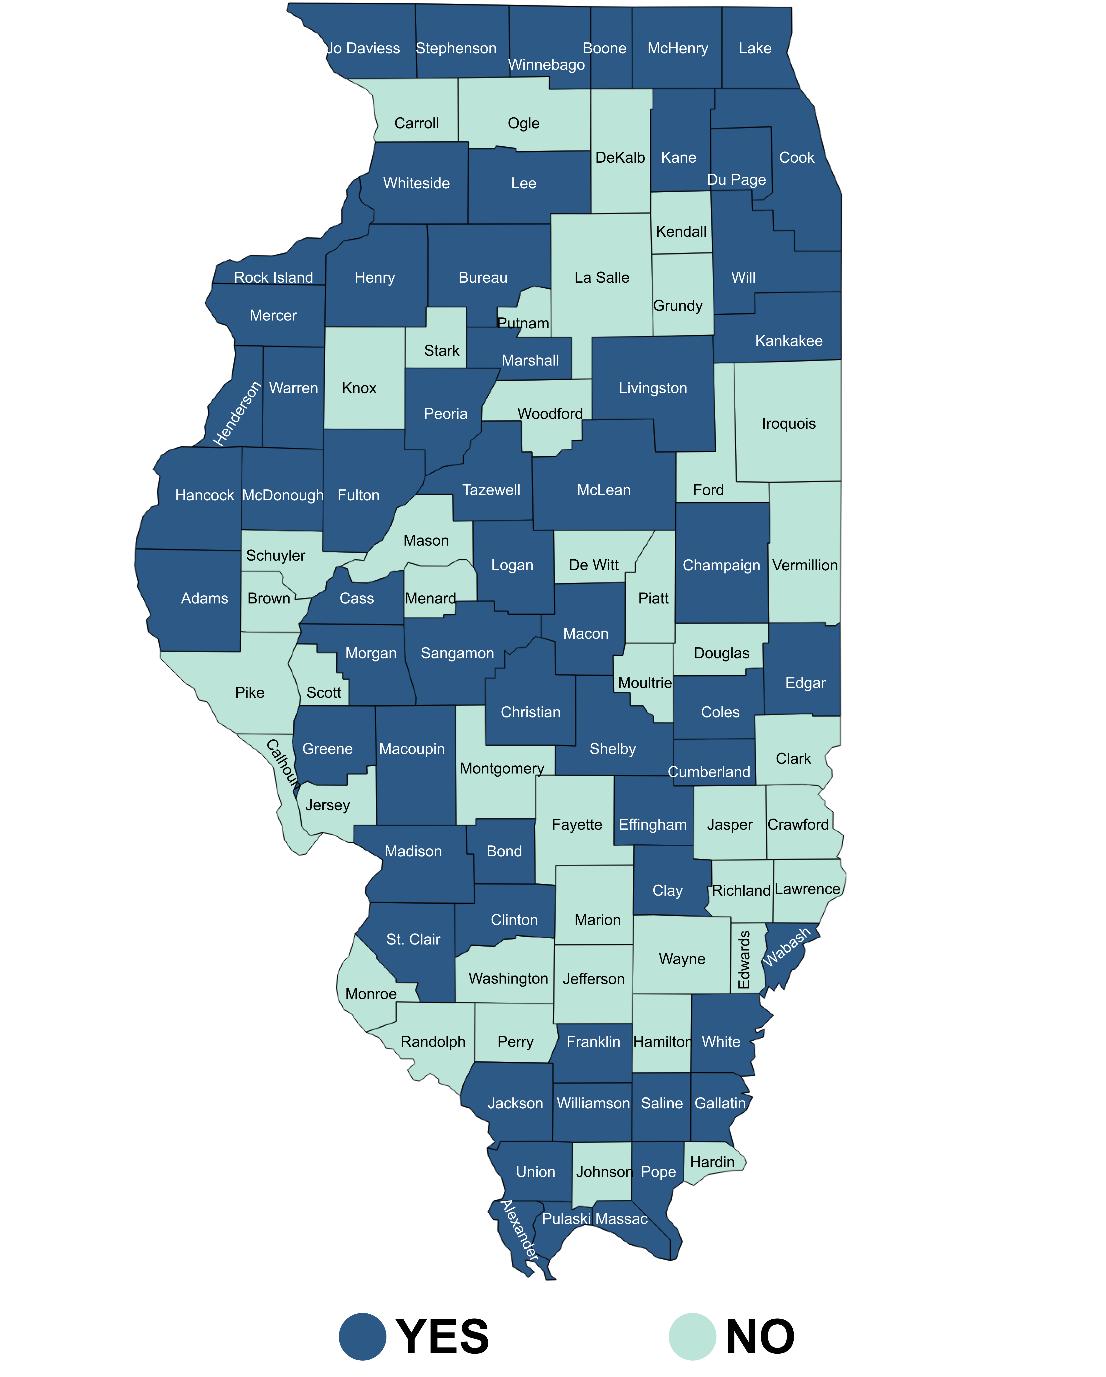
CHW respondents were asked to provide the zip code(s) where they spent the most time working as a CHW. On average, CHWs (n=423) reported providing services in 2.0 +1.7 zip codes and the number of service zip codes reported ranged from one to 17. When examining service areas from a county-level perspective, about 58% (n=59) of Illinois’s 102 counties were represented among survey respondents’ service areas (Figure 16).
Figure 16: Map of counties where survey respondents provide CHW services
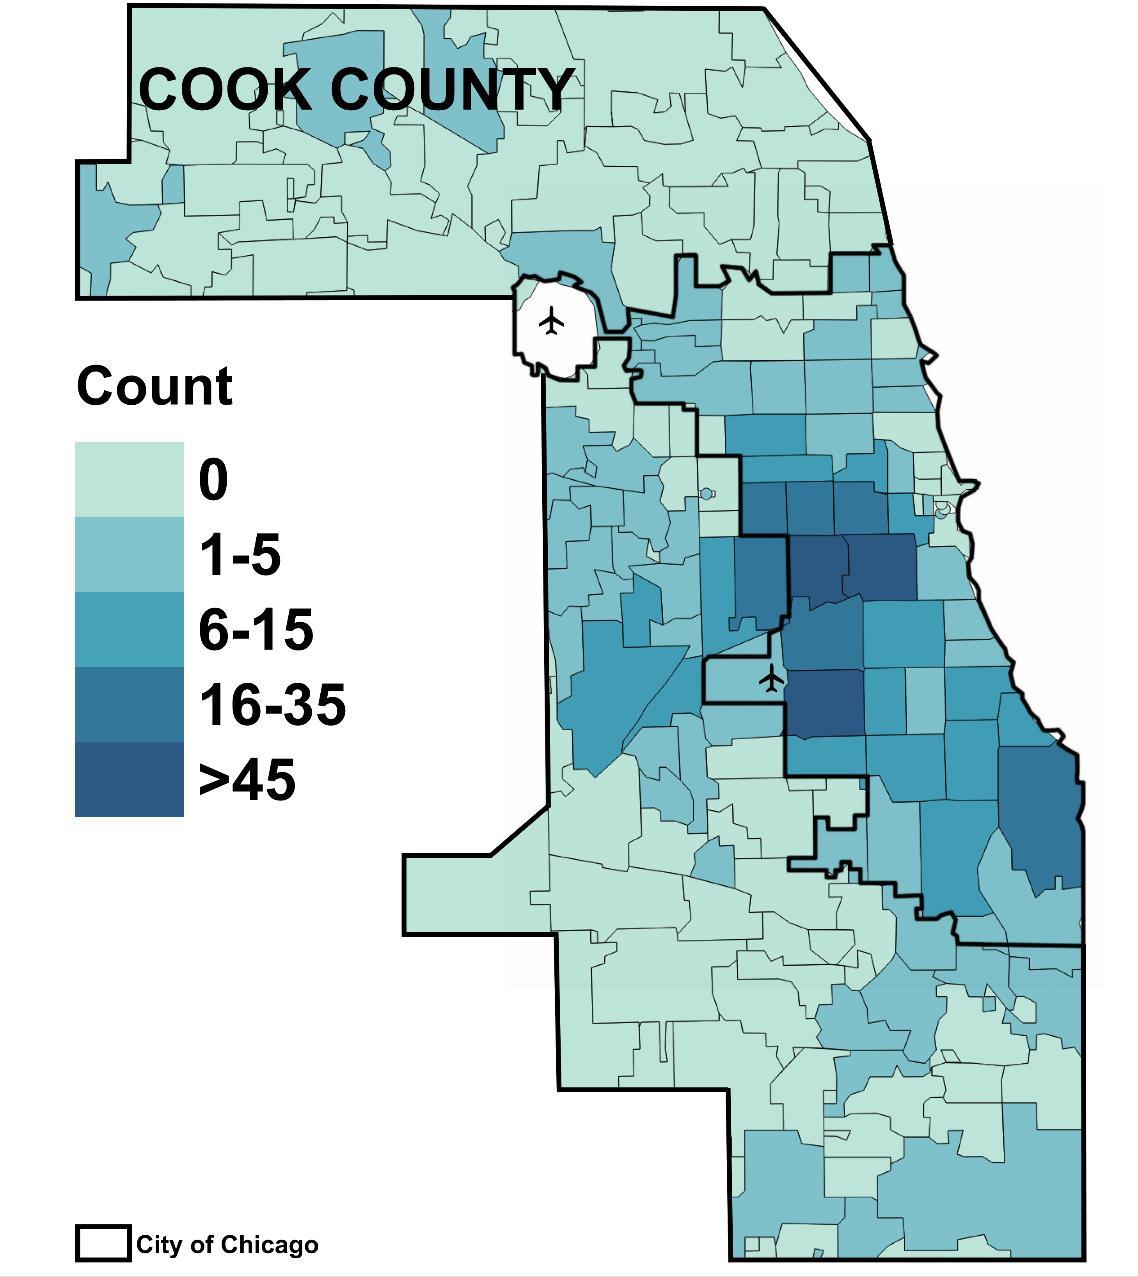
In Cook County, the City of Chicago, and areas in the western and southern parts of the county were most frequently reported as their service areas by survey respondents (Figure 17).
City of Chicago
Figure 17: Map of zip codes within Cook County where survey respondents provide CHW services
CHW TRAINING AND COMPETENCIES
CHW TRAINING EXPERIENCES
Respondents were asked to indicate completion of Core 101 and/or specialized training. About 58% of had completed a Core 101 and at least one specialized training; 4% had completed a Core 101, but no specialized training; 14% had no Core 101, but had at least one specialized training; and 24% reported no Core 101 or specialized training (Figure 18).
See Appendix Table 4 for more information.
Figure 18: Completion of a Core 101 training and / or Specialized training (n=450)
No Core 101 and NO specialized training, 24%
No Core 101, but did complete > 1 specialized training, 14%
Core 101 AND at least 1 specialized training, 58%
Core 101, but no specialized training, 4%
CHWs reported completing specialized trainings on skills and knowledge topics. Mental Health First Aid (48%), the Diabetes Prevention Program (36%), and motivational interviewing (35%) were the most frequently reported specialized trainings (Figure 19).
See Appendix Table 4 for more information.
Mental Health First
Diabetes Prevention Program
Motivational Interviewing
Behavioral health
Health insurance navigation
Emergency prevention
Health system navigation
Hypertension Prevention Program
Refugee, immigrant, and migrant populations
Alzheimer's/Dementia education
Asthma/COPD/Live Well Breathe Well
Infection prevention
Equity in action
Digital literacy navigation (may include telehealth
Cancer navigation
Palliative care
Parkinson's navigation
Other training
Figure 19: Completion of specialized CHW training (n=450)
CHWs were also asked about if they had completed CHW supervisor training; about 13% indicated they had completed this type of training (Figure 20).
See Appendix Table 4 for more information.
Figure 20: Completion of a CHW supervisor training (n=450)
ORGANIZATIONS NAMED BY CHWs AS TRAINING PROVIDERS
In the survey, CHWs were asked to name organizations from which they had received any CHW training. Respondents named organizations that were located both in and outside of Illinois.
See Appendix Table 5 for more information
CHW CONFIDENCE IN SKILLS AND KNOWLEDGE COMPETENCIES
Respondents were asked to self-rate their confidence level for several CHW skills and knowledge competencies (Figure 21).11,12 Overall, CHWs reported high level of confidence for several knowledge and skill competencies, including communication (78%), interpersonal skills, relationship building, advocacy, organizational skills, outreach skills, and providing direct services. CHWs reported feeling less confident in competencies related to public health knowledge, evaluation and research, and individual and community assessment.
See Appendix Table 6 for more information
Figure 21: Confidence in CHW skills and knowledge competencies (n=450)
11 Wiggins, N., & Borbón, I. A. (1998). Core roles and competencies of community health workers. In Final report of the National Community Health Advisor Study (pp. 15–49). Baltimore, MD: Annie E. Casey Foundation.
12 Rosenthal, E.L. Menking, P. and St. John, J. (2018). The Community Health Worker Core Consensus (C3) Project: A Report of the C3 Project Phase 1 and 2, Together Leaning Toward the Sky. A National Project to Inform CHW Policy and Practice.Texas Tech University Health Sciences Center, El
CHW CONFIDENCE IN SKILLS AND KNOWLEDGE COMPETENCIES BY CHW CORE 101 TRAINING COMPLETION STATUS
CHWs who had completed a CHW Core 101 training, compared to those who had not, were more likely to rate themselves very confident for the following competencies: communication (81% versus 72%); advocacy (73% versus 59%); cultural competency (66% versus 51%); understanding of health systems; basic diseases and behavioral health issues (62% versus 49%); evaluation and research (44% versus 35%); outreach skills (78% versus 57%); and providing direct services (76% versus 56%) (Figure 22).
See Appendix Table 7 for more information.
Figure 22: Percent of CHWs with very high self-rated confidence in CHW competencies, differences by CHW Core 101 training status * indicates a statistically significant difference between groups
Communication*
Interpersonal skills and relationship building
Service coordination and navigation skills
Capacity-building
Advocacy*
Presentation and facilitation skill
Organizational skills
Cultural competency*
Public health knowledge
Understandning of health systems…*
Evaluation and research*
Individual and community assessment
Outreach skills*
Providing direct services*
LEVEL OF COMPENSATION, BENEFITS, & PROMOTION (CHW CI #1)
Common Indicator #1, developed by the CHW Center for Research and Evaluation, assesses CHW wages, benefits, and opportunities for advancement; it includes versions for CHWs and employers. The version for CHWs was included in this survey. CHWs were first asked to report the number of hours they typically worked in a week. About 79% of CHWs reported working full-time (35+ hours/week) and about 21% reported working part-time (<35 hours/week) (Figure 23).
See Appendix Table 8 for more information.
Overall, CHWs reported working an average of 35.6 hours per week (range: 3 to 80 hours). Full-time CHWs reported working an average of 40.3 hours per week (range: 35 to 80 hours); part-time CHWs reported working an average of 18.2 hours per week (range: 3 to 32 hours) (Figure 24).
See Appendix Table 8 for more information.
Figure 24: Average and range of number of hours worked per week based on employment status
Figure 23: Employment status of CHWs (n=397)
CURRENT
CHWs were asked to report their earnings by sharing their current annual salary and/or hourly rate and number of hours worked per week Full-time CHWs (working 35 hours or more per week) for whom an annual salary was calculated (n=292), estimated annual salaries ranged from $25,000 - $101,400 and the mean annual salary was $46,430 (Figure 25.) When looking at differences in mean annual salaries by metropolitan (metro) status, the mean annual salary was higher for metro full-time CHWs when compared to nonmetropolitan full-time CHWs, $47,637 versus $42,568, respectively.11
See Appendix Table 9 for more information.
Figure 25: Mean and range of annual salary for full-time CHWs, by metropolitan status
Full-time, Overall (n=292)
Full-time, Metro (n=219)
Full-time, Non-Metro (n=58)
Annual Earnings in Dollars
The mean hourly rate for part-time CHWs (working less than 35 hours per week) (n=77) was about $20.00 per hour for both metro and non-metro CHWs (Figure 26). The 45 CHWs who worked as volunteers and/or were not currently employed were excluded from the analysis.
See Appendix Table 9 for more information.
26: Mean and range of hourly compensation rate for part-time CHWs, by metropolitan status
Part-time, Overall (n=77)
Part-time, Metro (n=67)
Non-Metro (n=8)
Hourly Earnings in Dollars
Figure
CHWs were asked about benefits currently offered by their employer, including health and disability insurance benefits, paid leave / vacation benefits, reimbursement for workrelated expenses, and other benefits. The most common benefits offered to full-time CHWs were health insurance (91%), vacation (87%), and dental insurance (82%) (Figure 27). About 76% of full-time CHWs were offered transportation or mileage reimbursement; however, a smaller proportion of full-time CHWs were offered reimbursement for other work-related expenses. CHWs were also offered other benefits which included: an employee assistance program (35%), retirement/pension fund (55%), and professional development opportunities (in-house) (41%).
See Appendix Table 10 for more information.
Figure 27: Benefits offered by employers of full-time CHWs (n=313)
As expected, fewer part-time CHWs reported that their employer provided benefits.12 Overall, the most common benefits for part-time CHWs were transportation or mileage reimbursements (18%), sick leave (14%), and vacation (13%) (Figure 28). Only 11% of part-time CHWs reported that they were offered health insurance and even fewer were offered dental (7%), disability (5%), or mental health insurance (4%). Most part-time CHWs were not offered any “other benefits” apart from in-house (12%) and other professional development opportunities (11%).
See Appendix Table 10 for more information.
Employee assistance program Internet service subsidy reimbursement
12 In the United States, it is common practice that part-time employees do not
their employers.
Figure 28: Benefits offered by employers of part-time CHWs (n=84)
ELIGIBILITY FOR PROMOTIONS / STEP UPS WITH PAY INCREASES
CHWs were asked whether they are eligible for promotions / step-ups with pay increases at their place of employment (Figure 29). Overall, just under half of all CHWs reported being eligible for promotions / step-ups (49%).
See Appendix Table 11 for more information.
When comparing eligibility based on employment status, full-time CHWs were more likely to report being eligible for promotions / step-ups when compared to part-time CHWs (54% versus 36%) (Figure 30).
See Appendix Table 11 for more information.
Part-time (n=84) Full-time (n=313)
Figure 30: CHW eligibility for promotions / step-ups based on employment status*
Figure 29: CHW eligibility for promotions / step-ups with pay increases (n=411)
SUPPORTIVE & REFLECTIVE CHW SUPERVISION (CHW CI #12)
The CHW version of Indicator #12 has three parts: 1) supervision quantity; 2) supervision quality, and 3) supervisor attitudes and characteristics
CHWs were asked whether their current position distinguishes between administrative and clinical supervision (Figure 31); slightly over 40% of respondents responded ‘Yes’ that their position distinguishes between those types (43%). Of the respondents whose position does distinguish between the two (n=188), 65% responded that two different people are responsible for supervision.
See Appendix Table 12 for more information.
Figure 31: Distinction between administrative and clinical supervision and whether oversight of supervision is handled by different people
Yes, my position distinguishes between administrative and clinical supervision
No, my position does not distinguish between administrative and clinical supervision
Missing
Yes, two different people responsible for supervision
No, one person responsible for supervision
Missing
SUPERVISION QUANTITY
CHWs were asked to provide the number of hours of individual and group supervision they received in the past 30 days (Figure 32). CHWs who work full-time responded that they received between zero to 176 hours of both individual and group supervision in the last 30 days, while part-time CHWs received between zero and 100 hours. On average, full-time CHWs received just over 10 hours of individual (11.2 hours) and group (10.7 hours) supervision in the last 30 days. Part-time CHWs responded that their average number of supervision hours was just a few hours below full-time CHWs for both individual (7.5 hours) and group (8.5 hours) supervision.
See Appendix Table 12 for more information.
Figure 32: Mean and range of supervision hours in the last 30 days, by full- and part-time status
Individual supervision, overall (n=388)
Individual supervision, full-time (n=264)
Individual supervision, part-time (n=53)
Group supervision, overall (n=329)
Group supervision, full-time (n=256)
Group supervision, part-time (n=52)
SUPERVISION QUALITY
CHWs were asked about the overall quality of both individual and group supervision they had received within the last 30 days (Figure 33). Around two-thirds of CHWs responded that the overall quality of individual (68%) and group supervision (66%) they received in the last 30 days was excellent or good. When comparing CHWs’ perceived overall quality of individual and group supervision, they were almost identical.
See Appendix Table 12 for more information.
Figure 33: CHWs percieved overall quality of individual / group supervision received within the last 30 days (n=442)
Individual supervision
Group supervision
Hours of supervision
SUPERVISOR ATTITUDES AND CHARACTERISTICS
For Part 3 of the indicator, CHWs were asked to respond to six items characterizing supervision by the person they consider to be their primary supervisor during the past thirty days, with answers on a 4-point Likert scale from “Strongly disagree” (1) to “Strongly Agree” (4). The average overall score was 3.2 (SD = 0.83). Figure 21 shows the average response by question. Average question-specific scores exceeded 3.0 for all questions (Figure 34).
See Appendix Table 13 for more information.
Figure 34: Supervisor attitudes and characteristics scale, mean scores from individual statements
My supervisor understands the strengths and needs of the communities we serve (n=436)
My supervisor understands that improving health requires addressing racism/oppression (n=437)
My supervisor has participated in training about the CHW profession (n=433)
My supervisor encourages my professional growth (n=435)
My supervisor appreciates my role as a CHW (n=438)
My supervisor advocates for the role of CHWs with upper management (n=430)
CHWs were also asked their participation on hiring panels when CHW supervisors are selected; just over 50% of CHWs disagreed or strongly disagreed that CHWs participate on hiring panels when CHW supervisors are selected (Figure 35)
See Appendix Table 13 for more information.
Figure 35: Level of agreement with the statement, "In my organization, CHWs participate on hiring panels when CHW supervisors are selected (n=443)
CHW
INTEGRATION
INTO TEAMS (CHW CI #5)
Common Indicator #5, developed by the CHW-CRE, includes three sub-measures of integration onto teams. This indicator is composed of three parts: 1) A 7-item Relational Coordination Scale (RCS) created by Gittel and colleagues,13,14 2) A novel scale Influence of Racism and Other Forms of Discrimination on CHW Integration (IROFD) and 3) Four additional questions related to CHW integration into teams
RELATIONAL COORDINATION
The RCS asks participants to respond to a series of questions to assess the extent to which CHWs are members of a collaborative and communicative team with colleagues (i.e., clinicians, health educators, pharmacists, etc.) within professional settings. Each question in the RCS provides five response options coded 1 to 5. The one item that is worded negatively was reversed so that more positive or desirable answers are associated with higher scores. The average overall score was 3.67 (SD = 0.67) Average question-specific scores were at 3.5 for all questions (Figure 36).
See Appendix Table 14 for more information.
Figure 36: Relational Coordination Scale, mean scores from individual statements
How frequently do you communicate about program participants with the … providers with whom you work? (n=436)
Do the other ... providers with whom you work communicate with you in a timely way about program participants? (n=433)
Do the other ... providers with whom you work communicate with you accurately about program participants? (n=436)
When an error has been made about program participants, do the other ... providers with whom you work blame others rather than sharing responsibility? (n=428)
To what extent do the other ... providers with whom you work share your goals for the care of program participants?4 (n=432
How much do the other ... providers with whom you work know about the work you do with program participants? (n=433)
How much do the other … providers with whom you work respect you and the work you do with program participants? (n=438)
13 Gittell JH, Fairfield KM, Bierbaum B, et al. Impact of relational coordination on quality of care, postoperative pain and functioning, and length of stay: a nine-hospital study of surgical patients. Med Care. 2000;38(8):807-819.
14 Gittell JH, Beswick J, Goldmann D, Wallack SS. Teamwork methods for accountable care: relational coordination and TeamSTEPPS®. Health Care Manage Rev. 2015;40(2):116-125.
INFLUENCE OF RACISM AND OTHER FORMS OF DISCRIMINATION ON CHW INTEGRATION
The IROFD on CHW Integration scale measures the impact of discrimination based on race/ethnicity or culture on integration into teams Each question in the IROFD on CHW Integration Scale provides five response options coded 1 to 5,15 wherein the lower the score indicates a lower level of reported discrimination. The average overall score was 1.57 (SD = 0.81) Average question-specific scores indicate relatively low levels of discrimination based on race/ethnicity for the sample as a whole (Figure 37).
See Appendix Table 15 for more information.
Figure 37: Influence of Racism and Other Forms of Discrimination Scale, mean scores from individual statements
Do you feel isolated from the other healthcare, social service, and/or education providers with whom you work because of your culture or race/ethnicity? (n=435)
Do you feel like you have to be the only voice for your race/ethnicity or culture amongst the other healthcare, social service, and/or education providers with whom you work? (n=437)
Do you feel dismissed or devalued by the other healthcare, social service, and/or education providers with whom you work because of your ethnic/racial or cultural background? (n=432)
Do you feel that the other healthcare, social service, and/or education providers with whom you work make assumptions about you because of your race/ethnicity or culture? (n=437)
15 At the time of data collection, the survey included a 5-point response scale. In August 2024, The National Center for Research and Evaluation released a new data analysis guide, which included guidance about these items to include a 4-point scale. They continue to develop, pilot, and disseminate process and outcome indicators. Visit https://www.chwcre.org/promotion-of-common-indicators for more information.
When examining differences in means by self-reported racialized identity, there were significant differences between groups. CHWs with a racialized16 identity, compared to those with a non-racialized identity, were more likely to report a higher overall summary score (1.57 versus 1.26), suggesting higher levels of discrimination. Significant differences were also seen for each of the individual items in the scale, and again, CHWs with a racialized identity were more likely to report higher scores (Figure 38).
See Appendix Table 16 for more information.
Figure 38: Influence of Racism and Other Forms of Discrimination Scale, mean scores from individual statements, Differences by self-identified racialized identity
* indicates a statistically significant difference between groups
Do you feel isolated from the other healthcare, social service, and/or education providers with whom you work because of your culture or race/ethnicity? (n=435)*
Do you feel like you have to be the only voice for your race/ethnicity or culture amongst the other healthcare, social service, and/or education providers with whom you work? (n=437)*
Do you feel dismissed or devalued by the other healthcare, social service, and/or education providers with whom you work because of your ethnic/racial or cultural background? (n=432)*
Do you feel that the other healthcare, social service, and/or education providers with whom you work make assumptions about you because of your race/ethnicity or culture? (n=437)*
16 ‘Racialization' refers to the process through which the concept of 'race' is socially constructed and racialized identities are formed. Racialization highlights the historical, social, and political factors that contribute to the institutionalization of racism. Bernard, Wanda T., and Ellice Daniel. “Social Work with Racialized Groups: Frameworks for Practice.” International Encyclopedia of the Social & Behavioral Sciences, Second Edition, vol. 22, Elsevier Ltd, 2015, pp. 821–26, https://doi.org/10.1016/B978-0-08-097086-8.28031-8.
ADDITIONAL QUESTIONS ABOUT CHW INTEGRATION INTO TEAMS
Survey respondents were asked additional questions about their integrations into teams. When asked about feeling comfortable talking about participants’ needs with teams, about 67% reported feeling completely or somewhat comfortable (Figure 39). However, when asked about the extent to which their team understood their role and what they do as a CHW, only 47% reported feeling that their team understood completely or a lot.
See Appendix Table 17 for more information
To what extent do you feel comfortable going to the other healthcare, social service, and/or education providers with whom you work to talk about participants' needs?
To what extent do the other healthcare, social service, and/or education providers with whom you work understand your roles and what you do as a CHW?
Respondents were asked about their access to record information (any participant record, not necessarily a medical record) for their participants in their employer’s participant tracking system. About 72% of CHWs responded that they do have access (Figure 40).
See Appendix Table 17 for more information.
When asked about their workspace, most (89%) responded that their employer provides them with adequate, dedicated space where they can work (Figure 41).
See Appendix Table 17 for more information.
Figure 39: Additional questions about integration into teams (n=442)
Figure 41: CHW has employer-
Figure 40: Record information access (n=443)
CHW INVOLVEMENT IN DECISION AND POLICYMAKING (CI #4)
Common Indicator #4, a scale developed by the CHW Center for Research and Evaluation, measures the degree to which CHWs report being involved in decision- and policymaking, both within and outside of their organizations. Respondents are asked to indicate how much they agree with 6 statements, using four response options of “Strongly disagree,” “Disagree,” “Agree,” and “Strongly Agree,” coded with numeric values of 1 to 4. An average of these scores is taken, with a maximum possible score of 4 and minimum 1.
Across the six items, the average score among respondents was 2.83. Respondents were least likely to report being members of groups that influence policy within their organizations (average score = 2.5) (Figure 42). They were most likely to report having identified the people and organizations that influence change in their communities (average score = 3.2) and that people who influence change seek their opinion and participation (average score = 3.0).
See Appendix Table 18 for more information.
Figure 42: CHW Involvement in Decision and Policymaking Scale, mean scores from individual statements
As part of my job, I have identified the people or organizations that influence change in my community (n=436)
As part of my job, people who influence change seek my opinion and participation. (n=429)
As part of my job, I am a member of one or more groups/organizations that make (i.e., develop and/or enact) policy for my community, city, county, state, or tribe (n=434)
My employer/supervisor supports my involvement in policy making on work time (n=421)
I am a member of one or more groups that influence policy in my employing organization (n=427)
I believe that as a CHW, I have influenced policy in my organization or community (n=430)
RESPONSES TO OPEN-ENDED QUESTION ABOUT CHW EXPERIENCES
Respondents were asked to share any additional information about their experiences serving as a CHW. The most common themes shared by CHWs were their low pay, limited opportunities for growth, and lack of sustainability of their jobs. Many CHWs shared similar sentiments about how rewarding their job is, their passion for their work, and how working as a CHW has improved many of their skills. However, many also mentioned that apart from appreciation expressed by their clients, they feel undervalued, disrespected, and receive minimal recognition from upper management. Some respondents attributed the under appreciation to a lack of understanding from coworkers or management about CHWs and the services they provide. Additionally, many CHWs emphasized the need for additional training opportunities, specifically related to immigrant health, senior services, mental health, and clinical training. Respondents shared that they appreciated being asked for their input via the survey and hope to be included in further conversations about CHW development opportunities.
STRENGTHS & LIMITATIONS
This survey report has several strengths and limitations. Strengths include that the survey instrument was based on the CHW Common Indictors, which have been used in several states and at the national level. The Illinois effort was developed through a collaboration between a diverse group of 14 organizations who all brought their unique experiences and expertise to the group. This also helped to increase the reach of its recruitment efforts, and hopefully increased the credibility of the efforts. Another notable strength of the survey includes its availability in both English and Spanish.
Finally, the survey covered a broad range of topics ranging from the CI constructs to CHW training experiences. The results from these questions will inform the development of the IDPH Illinois CHW Certification Program by providing insights related to capacity building opportunities for CHWs throughout the state. Additionally, results can inform advocacy in areas such as pay equity within and sustainability of the CHW workforce.
The survey also has some limitations. There is no centralized CHW database for the state, so it is not possible to determine the overall proportion of CHWs represented in the data. Furthermore, non-probability sampling methods were used to recruit CHWs, so respondent bias may be present. While the survey was offered in both English and Spanish, it was not offered in additional languages; this may have contributed to an absence of responses from certain groups of CHWs in Illinois. Without the perspectives of these CHWs, the results of the survey may not be an accurate representation of all CHWs in Illinois.
CONCLUSION
Findings from the CHW CI and Training Experiences Survey provide a better understanding of the CHW workforce in Illinois, specifically related to the characteristics of Illinois CHW background, their training experiences, and their self-rated confidence in CHW competencies. It also provides insight into several of the CHW CI workforce indicators, and demographic characteristics. These results will be important in informing the development of the IDPH Illinois CHW Certification Program and may also be helpful for other CHW stakeholders including employers, supporters, funders, researchers and CHWs themselves.
As Illinois moves toward the development of a CHW certification program, information related to common issues that impact CHWs such as low wages, poor job security, and limited opportunities for comprehensive training and advancement within the profession will be essential to understand. The findings from this survey may offer a clearer understanding of next steps and best practices moving forward. Given that this is the first CHW CI and Training Experiences Survey in Illinois, future considerations may include repeating the survey to compare responses and changes over time.
Illinois has a wide-reaching and diverse CHW workforce that is addressing the needs of our state’s most underrepresented, under resourced, and underserved populations. Future efforts to support this important workforce should center around ensuring accessibility of CHW Core 101 training and ongoing professional development opportunities, as well as promoting thriving wages, and interdisciplinary teams in supportive work environments.
Table 2: Serving as a CHW (n=450)
1 Respondents asked to provide a best estimate, rounded to the nearest year, if they could not recall the exact amount of time
2 Bilingual Program Manager, Case Worker, CHW Bilingual Trainer, CHW Supervisor (4), CHW Lead (4), Client Benefits Supervisor, Community Affairs Specialist II, Community Champion, Community Engagement Manager, Community Health Manager, Community Health Navigator, Community Health Response Worker (2), Community Health Response Worker Lead, Community Outreach Coordinator, Community Relations Lead, Director of Care Coordination, Director of Education & Outreach, Director of Health, Director of Operations, Domestic Violence Advocate, Family Support Specialist, Fiscal Services, Health Equity Specialist, Health Promotion Specialist, Home Visitor, Insurance Navigator, Patient Support Services, President/CEO, Private Caregiver, Program Coordinator (6), Program Director (2), Program Services Assistant, Program Service Specialist, Public Health Ambassador, Referral Coordinator, Quality Director, Quality Nurse, Vice President
Abbreviations: FQHC, Federally qualified health center; MCO, Managed care organization
Table 4: Completed CHW Core 101 and specialized training (n=450) Trainings
Completion of CHW Core 101 & Specialized CHW Training
1Respondents able to check all that applied
2Patient navigation in the clinical space and community services
Table 5: Organizations from which CHWs stated they had taken a training (n=237)
ACCESS Community Health
Age Options
Aging Care Connections
Alas-Wings
Alliance Care360
Alzheimer's Association
American Cancer Society
American Diabetes Association
American Heart Association
American Lung Association
American Parkinson Disease Association
American Red Cross
Arab American Family Services
Archdiocese of Chicago
Arizona State University
Arturo Velasquez Institute
Ascension Healthcare
Association for Professionals in Infection
Control and Epidemiology
Association of Clinical Research
Professionals
Association of Diabetes Care & Education Specialists
Association of State and Territorial
Health Officials
Blessing Health System
Blue Cross Blue Shield
Blue Door Neighborhood Center
Bridgeway, Inc.
Callie Boyd Community Center
CARA Collective
Care Coordination Systems
Caring Communities Cape Girardeau
MO School District
Catholic Charities
Centene Corporation: Managed Care & Healthcare Solutions
Centers for Disease Control and Prevention
Centers for Medicaid & Medicare Services
Centers for New Horizons Inc.
HealthLinc
Healthy Hood Chicago
Heartland Alliance
Help Hub
Henderson County Health Department
Howard Brown Health Center
Idaho State University
Illinois Breast & Cervical Cancer Program
Illinois Central College
Illinois Coalition for Immigrant and Refugee Rights
Illinois Community Health Workers Association
Illinois Critical Access Hospital Network
Illinois Department of Health
Illinois Department of Human Services
Illinois Department of Public Health
Illinois Department on Aging
Illinois Federation of Families for Children's
Mental Health
Illinois Migrant Council
Illinois Pathways to Health
Illinois Primary Health Care Association
Illinois Primary Healthcare Association
Illinois Public Health Association
Illinois State Police
Illinois Unidos
Immigrant Solidarity DuPage
Increase the Peace
Indiana University
Institute for Workforce Education
Integrative Health Practitioner
John Hopkins University
La Villita Community Church
Lake County Health Department
Latino Alzheimer's And Memory Disorders Alliance
Latino Alzheimer's Memory And Disorders Alliance
Centro Romero Lawrence Hall
Centro San Bonifacio Livingston Dermatology
Chestnut Health Center
Chicago City Colleges
Chicago Cook Workforce Partnership
Chicago Department of Public Health
Chicago Worker's Collaborative
Chicagoland Community Engagement Alliance
Christian Healthcare Ministries
City Colleges of Chicago
City of Chicago
Community Health & Emergency
Services Inc.
Community Health Care, INC
Community Health Partnership of Illinois
ComWell Behavioral Health Services
Loretto Hospital
Loyola University
Lutheran Social Services of Illinois
Macoupin County Public Health Department
Malcolm X College
Mano a Mano Family Resource Center
Maryland University Extension
MCD Global Health
McHenry County Mental Health Board
McHenry Health Department
Medical Home Network
MedTrainer
Memorial Health
Pillars Community Health
PODER Immigrant Integration Center
Chicago
Preferred Family Healthcare
Prevent Child Abuse Illinois
Puerto Rican Cultural Center
QHR Health
Quincy Medical Group
Rainbow Cafe LGBTQ Center
Regional Office of Education #26
Relias
REM Occupational Health & Wellness
Respond Now
Rhode Island CHW Program
Richard J Daley College
Richmond State School
Rincon Family Services
Rush University Medical Center
Safer Foundation
Saint Anthony Hospital
Sarah Bush Lincoln
Sertoma Star Services
SGA Youth and Family Services
SIHF Healthcare
Sinai Urban Health Institute
Sista Afya Community Mental Wellness
Sisters Working it Out
South Suburban College
Southeastern Illinois College
Southern Illinois Center for Independent Living
Southern Illinois Healthcare
Southern Illinois University (SIU) School of Medicine
Southern Illinois University School of Medicine
Southern New Hampshire University
Southwest Organizing Project
Spanish Coalition For Housing
Springfield Police Department
St. Alphonsus Health System
Stanford University
Start Early
State of Illinois (Train Program)
Substance Abuse and Mental Health
Services Administration
Susan G. Komen: Breast Cancer Foundation
Tazewell County Emergency
Management Agency
Tazewell County Health Department
TCA Health Inc.
Telligen
Texana Center
The HAP Foundation
The Immigration Project
Table 5: Organizations from which CHWs stated they had taken a training (n=237)
Cook County Department of Public
Health
Cook County Health
Cook County Health Ruth M. Rothstein
CORE Center
Cook Workforce Partnership
Mental Health Training Consultants
Mercer County HD Aledo
MercyOne
Midwest AIDS Training & Education Center
Coursera Moraine Valley Community College
Cultivating Health Ministries
Delta Region Community Health
Systems Development Program
Douglas County Health Department
DuPage County Health Department
Egyptian Health Department
El Sol Neighborhood Educational Center
Emory School of Nursing
Enlace Chicago
Equal Hope
Erie Neighborhood House
Esperanza Health Center
EverThrive
Friend Health
Full Gospel Church of God and Christ
Gateway Foundation
Global Health Center
Mujeres Latinas en Acción
National Alliance for Hispanic Health
National Alliance on Mental Illness
National Association for Alcoholism and Drug Abuse Counselors
National Association of Community Health Centers
National Association of Community Health Workers
National Council for Behavioral Health
National Council For Mental Wellbeing
National Council of Wellbeing
National HIV Classroom Learning Center
National Institute for Medical Assistant Advancement
National Institute of Health
National Kidney Foundation of Illinois
National Latina Institute for Reproductive Justice
National Youth Advocate Program
New England Public Health Training Center
Governors State University North Lawndale Employment Network
Grand Prairie Services Integrated
Healthcare North Shore Hospital
Greater West Town Community
Development Project
Hancock County Health Department
Haymarket Center
Health & Medicine Policy Research
Group
Health Network Solutions
Health Project
HealthConnect One
Northwest Center
Nurturing Parenting Program
Oak Street Health
One Lawndale
Overlook Medical Center
P.A.S.O.- West Suburban Action Project
Parkinson's Foundation
The Latino Alzheimer's and Memory Disorders Alliance
The Resurrection Project
Traliant
Trauma Resource Institute
Triage Cancer
Trinity Health Oakland Hospital
UIC Office of Community Engagement and Neighborhood Health Programs
Un Nuevo Despertar - A New Awakening
Universidad Popular
University of Arkansas
University of Chicago
University of Chicago Medicine
University of Illinois
University of Illinois Cancer Center
University of Illinois Chicago
University of Illinois Chicago Office of Community Engagement and Neighborhood Health Partnerships (OCEAN-HP)
University of Illinois Chicago School of Public Health
University of Illinois Extension
University of Illinois in Chicago Hospital
Health Sciences System
University of Illinois Urbana-Champaign
University of Pennsylvania
Utah State University
Utah State University Extension
Vaccinate Your Family
Warren Barr Gold Coast
Wellness West
West Central Illinois AHEC
West Side Health
Table 6: Confidence in CHW skills and knowledge competencies (N=450)
Table 7:
Confidence in CHW skills and knowledge competencies by CHW Core 101 training completion status
1The p-value is a statistical measure. A lower p-value (typically less than 0.05) suggests that the observed results are unlikely to have occurred by chance alone, indicating a statistically significant effect or difference. Conversely, a higher p-value suggests that the results could be due to random variation. Pearson Chi Square Test or the Fisher-Freeman-Halton Exact Test (in instances where expected cell counts were less than 5) used.
Table 8: Average number of hours worked per week, by full- and part-time status
Table 9: Current reported level of compensation, by employment status (full- or part-time) and metropolitan status 1
Full-time CHWs (35+ hours/week) Calculated
Part-time CHWs (<35 hours/week) Calculated
1 CHWs who reported working in unpaid, volunteer only positions (n=39) and CHWs who reported being currently unemployed (n=7) excluded from the analysis. Earnings information for 5 full-time individuals were determined to be outliers and were removed from the analysis; salaries exceed mean calculated and all described their “job title as not listed” so unable to ascertain with certainty whether respondent was currently serving as a CHW
2 The p-value is a statistical measure. A lower p-value (typically less than 0.05) suggests that the observed results are unlikely to have occurred by chance alone, indicating a statistically significant effect or difference. Conversely, a higher p-value suggests that the results could be due to random variation. P-values calculated to examine differences in mean earnings by place of residence (metro versus non-metro)
Table 10: Benefits CHWs reported to be offered by their employers, by full-time or part-time employment status 1 ,2
1 Respondents not currently employed (n=7) and without current employment status reported (n=1) were not asked about benefits; Respondents not reporting employment status (full- or part-time) (n=45) excluded from stratified analyses
2 E.g., Funds or paid time for participation in external professional associations and attending conferences and trainings.
Table 11: Eligibility for promotion/step-ups with pay increases, based on employment status
1 Respondents who reported working in an unpaid, volunteer only position (n=39) not asked this question
2 The p-value is a statistical measure. A lower p-value (typically less than 0.05) suggests that the observed results are unlikely to have occurred by chance alone, indicating a statistically significant effect or difference. Conversely, a higher p-value suggests that the results could be due to random variation. Fisher-Freeman-Halton Exact Test (expected cell counts were less than 5) used to examine differences in eligibility for promotions / step ups with pay increases by fullor part-time status
Table 12: CHWs experience with supervision (n=442) 1
1 Respondents not currently employed (n=7) and missing employment status (n=1) excluded
How frequently do you communicate about program participants with the other healthcare, social service, and/or education providers with whom you work? (n=436)
Do the other healthcare, social service, and/or education providers with whom you work communicate with you in a timely way about program participants? (n=433)
Do the other healthcare, social service, and/or education providers with whom you work communicate with you accurately about program participants? (n=436)
When an error has been made about program participants, do the other healthcare, social service, and/or education providers with whom you work blame others rather than sharing responsibility? (n=428)
To what extent do the other healthcare, social service, and/or education providers with whom you work share your goals for the care of program participants?4 (n=432
How much do the other healthcare, social service, and/or education providers with whom you work know about the work you do with program participants? (n=433) 3.50
How much do the other healthcare, social service, and/or education providers with whom you work respect you and the work you do with program participants? (n=438)
1 CHWs not currently employed (n=7) not asked these questions
2 Respondents asked to think about their teams as including the other healthcare, social services and/or education providers with whom they work
3 Respondents (n=6) were excluded from the summary score for the full scale if 4 or more of the 6 questions were unanswered.
4 This question is referring to shared goals for the client
Table 15: Influence of Racism and Other Forms of Discrimination on CHW Integration1 Influence of Racism and Other Forms of Discrimination on CHW Integration Scale (n=438)2
Individual Statement -Included in scale Individual StatementsInfluence of Racism and Other Forms of Discrimination2
Do you feel isolated from the other healthcare, social service, and/or education providers with whom you work because of your culture or race/ethnicity? (n=435)
Do you feel like you have to be the only voice for your race/ethnicity or culture amongst the other healthcare, social service, and/or education providers with whom you work? (n=437)
Do you feel dismissed or devalued by the other healthcare, social service, and/or education providers with whom you work because of your ethnic/racial or cultural background? (n=432)
Do you feel that the other healthcare, social service, and/or education providers with whom you work make assumptions about you because of your race/ethnicity or culture? (n=437)
1 CHWs not currently employed (n=7) not asked these questions.
2 Respondents were excluded from the summary score for the full scale if more than 2 questions were unanswered (n=5)
Table 16: Influence of Racism and Other Forms of Discrimination on CHW Integration, Differences by self-identified racialized identity1
Racialized Identity Non-Racialized Identity
Influence of Racism and Other Forms of Discrimination on CHW Integration Scale2
Individual Statements from scale2
Do you feel isolated from the other healthcare, social service, and/or education providers with whom you work because of your culture or race/ethnicity?
Do you feel like you have to be the only voice for your race/ethnicity or culture amongst the other healthcare, social service, and/or education providers with whom you work?
Do you feel dismissed or devalued by the other healthcare, social service, and/or education providers with whom you work because of your ethnic/racial or cultural background?
Do you feel that the other healthcare, social service, and/or education providers with whom you work make assumptions about you because of your race/ethnicity or culture?
1 CHWs not currently employed (n=7) not asked these questions.
3 Respondents were excluded from the summary score for the full scale if more than 2 questions were unanswered (n=5)
3 The p-value is a statistical measure. A lower p-value (typically less than 0.05) suggests that the observed results are unlikely to have occurred by chance alone, indicating a statistically significant effect or difference. Conversely, a higher p-value suggests that the results could be due to random variation. One-sided TTests, with equal variance between groups assumed, were used.
Table 17: Additional questions about CHW integration into teams (n=443)
To what extent do you feel comfortable going to the other healthcare, social service, and/or education providers with whom you work to talk about participants' needs?
To what extent do the other healthcare, social service, and/or education providers with whom you work understand your roles and what you do as a CHW?
Do you have access to record information about your participants in your employer’s main participant tracking form/system?
Does your employer provide you with adequate, dedicated space where you can work (e.g., meet with participants, complete paperwork, make phone calls, access a computer, etc.)?
Table 18: CHW Involvement in Decision and Policymaking1 CHW Involvement in Decision and Policy Making Scale (n=436)2
Involvement in Decision and Policymaking Scale – Mean
(n=436)2
As part of my job, I have identified the people or organizations that influence change in my community (n=436)
As part of my job, people who influence change seek my opinion and participation. (n=429)
As part of my job, I am a member of one or more groups/organizations that make (i.e., develop and/or enact) policy for my community, city, county, state, or tribe (n=434)
My employer/supervisor supports my involvement in policy making on work time (n=421)
I am a member of one or more groups that influence policy in my employing organization (n=427)
I believe that as a CHW, I have influenced policy in my organization or community (n=430) 2.82 0.85
1 CHWs not currently employed (n=7) not asked these questions
2 Respondents were excluded from the summary score for the full scale if more than 3 questions were unanswered (n=7)