Welcome to the Fall 2025 University City District (UCD) Transportation Report. In our previous report, released in the spring of this year, our team detailed the recent history of daylighting and pedestrian plazas in University City. In this installment, we provide a mid-year look into how residents, commuters, and visitors get around University City.
All data, unless otherwise noted, focus on University City District, which we define for these purposes as the UCD service boundary. This area encompasses roughly 2.5 square miles from the Schuylkill River in the east, to 50th Street in the west, north by Spring Garden and Market Streets, and south by Woodland Avenue and the SEPTA Regional Rail tracks. You can find an map of the service boundary here. The trended transportation data in this report is current up to July 2025.
This report was released after the SEPTA funding crisis, which impacted service from August 24 th to September 14 th. While a transfer of capital funding to operational funding has stabilized service in the near-term, we hope that a sustainable source of operations funding for SEPTA is achieved in the future, especially in light of the positive ridership trends this report shows. All data in this report are reflective of SEPTA service and ridership before the reduction of service in August and September that resulted from the funding crisis.
Key Takeaways
• Over 1,000,000 trips take place by foot, bicycle, public transit, and private car every day in University City, with half of those trips starting or ending in UCD.
• SEPTA has achieved its highest ridership since 2019 on the Market Frankford Elevated (L1) and buses within University City. Ridership on all regional rail routes is up 7.5% from 2024.
• Pedestrian foot traffic on the Walnut Street Commercial Corridor (36th to 40 th Streets) is up 10% compared to 2024.
• Vehicle traffic remains steady in University City, while Indego ridership fell slightly in the first half of 2025, likely due to colder winter weather than in 2024.
• UCD recommends the construction of protected bike lanes on 33rd and 34th Streets to reduce short-distance car trips, which occur more frequently on this corridor than other high-capacity roads in University City.
University City Transit At-Large
UCD now partners with Replica, a transportation data modeling company which incorporates a variety of data sources to compute a wholistic transit model for the entire United States. This data source models trips on all major transportation methods on the average weekday and weekend day. It accounts only for trips which have a defined beginning and end destination, excluding walks or bike rides for the sake of exercise or sightseeing drives around town. While Replica’s latest model for Spring 2025 was not available at the time of this report, we have included their statistics for Fall 2024, as they show revealing insights about how people get around University City.
Over 1,000,000 unique trips take place in University City on an average weekday on foot, or by bicycle, public transit, or private car. 51% of those trips pass through the area with destinations and origins outside of UCD. These pass-through trips are predominantly auto (75%), with 20% being public transit, 3% commercial freight, and 2% walking or biking. On the average Saturday, overall trips remain steady at approximately 1,000,000; however, the transportation method distribution
changes drastically when compared to a weekday. While the overall number of private auto trips remains similar on weekends at 66% compared to the 61% of weekdays, weekend trips in University City show significantly higher rates of auto-passenger trips, with lower shares of private auto trips (which represent only the driver of each vehicle). These data suggest that weekend trips feature higher rates of carpooling, perhaps due to the increased flexibility of weekend trips and the prevalence of social activities like shopping and dining out. This conclusion is supported by Replica’s trip purpose data, which shows that trips for shopping or eating increase by 3% and 2% respectively on weekends, while trips for work decrease by 6%.
TRIP TRANSIT METHOD BY DAY OF THE WEEK
TRIP PURPOSE BY DAY OF THE WEEK
Replica’s dataset also allows a detailed understanding of trip length in University City. Trips under 2 miles are considered prime targets for converting from single-occupancy private vehicles to multimodal transportation, such as walking, biking, or taking public transportation. Over 180,000 short distance trips take place every day in University City; 51% are walking trips, 36% are private auto, 7% involve public transportation, and 4% by bike. Distribution of trip purpose is similar between those taking short trips with a private auto compared to multimodal methods, suggesting that factors outside of the destination type make a larger impact.
Source: Replica
Source: Replica
SEPTA
CAPITAL PROJECTS
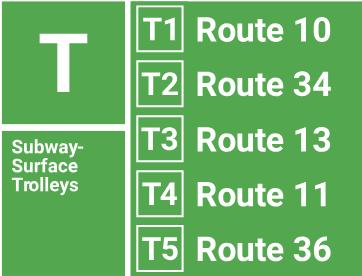
University City is host to exciting, major upgrades to SEPTA in the near future. Since our last Transportation Report that included SEPTA analysis in fall 2024, the agency began the rollout of the SEPTA Metro wayfinding, which included new names for the Market Frankford Line (now the L1) and all five subway-surface trollies (now named T1-T5, with line numbers descending as the route travels farther south). Trolley vehicles will include both the original route numbers (some of which date back to as early as 1911) and the new “T” naming scheme for some time to allow riders to adjust to the change. Signage within stations is in the process of being updated, with the terminus at 13th Street being the latest station to receive an update as of publication.
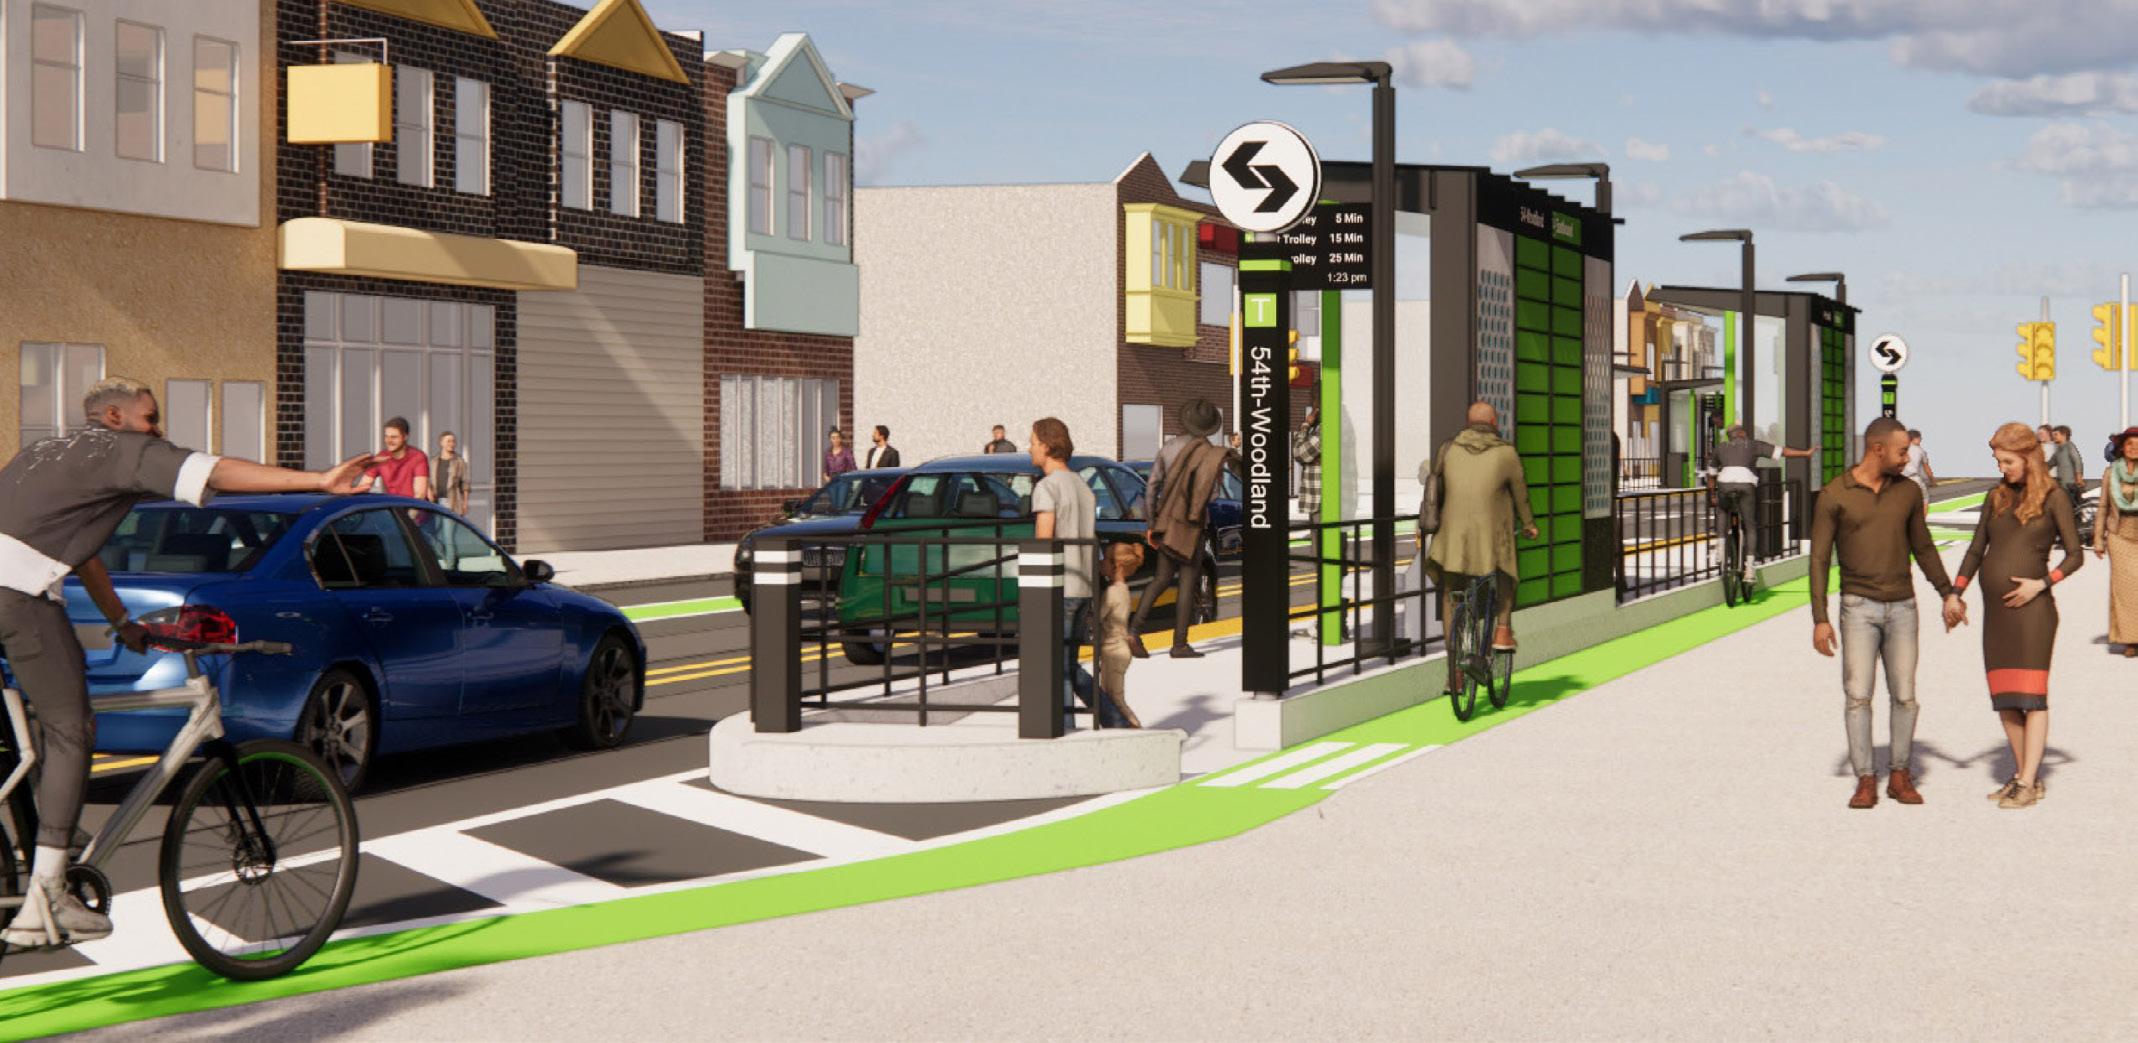
The planning team at SEPTA has also advanced work on their Trolley Modernization project. Trolley Modernization is a complete upgrade to the subway-surface trollies that define local transit in West and Southwest Philadelphia. While these routes are vital, their operations have changed little since their early 20th century origins. The current trolleys are over 40 years old and cannot be made ADA-accessible. While work on new, fully accessible and modern trolley vehicles is ongoing, this spring brought the first SEPTA proposal of new stop locations for the T5 (Route 36). Currently, West Philadelphia’s trolleys have some of the closest stop spacing in North America, with vehicles stops on every block that are often marked by little more than a signpost on the sidewalk. Trolley Modernization will condense the number of trolley stops while constructing new, fully modern on-street stations at each stop. Amenities are set to include weather shelters, full accessibility, and audio-visual trolley departure information.
The new station proposal can be viewed here. In University City, T4 and T5 stations will be constructed at 42nd and Woodland as well as 46th and Woodland. Farther along Woodland and Elmwood Avenues, stop spacing would increase to approximately one stop every two blocks. Stop rebalancing will provide faster service, reduced wait times, and greater overall reliability.
R IDERSHIP
We first reported a gradual increase in SEPTA’s ridership in University City in our last transportation report, released in Fall 2024. Bus ridership remains high in University City, with total ridership on routes in the area surpassing 2019 ridership for the first time. Increases have come largely from the three highest ridership routes in University City: Route 42 (increase of 504 rides per average weekday), Route 21 (increase of 493 rides), and Route 40 (increase of 392 rides).
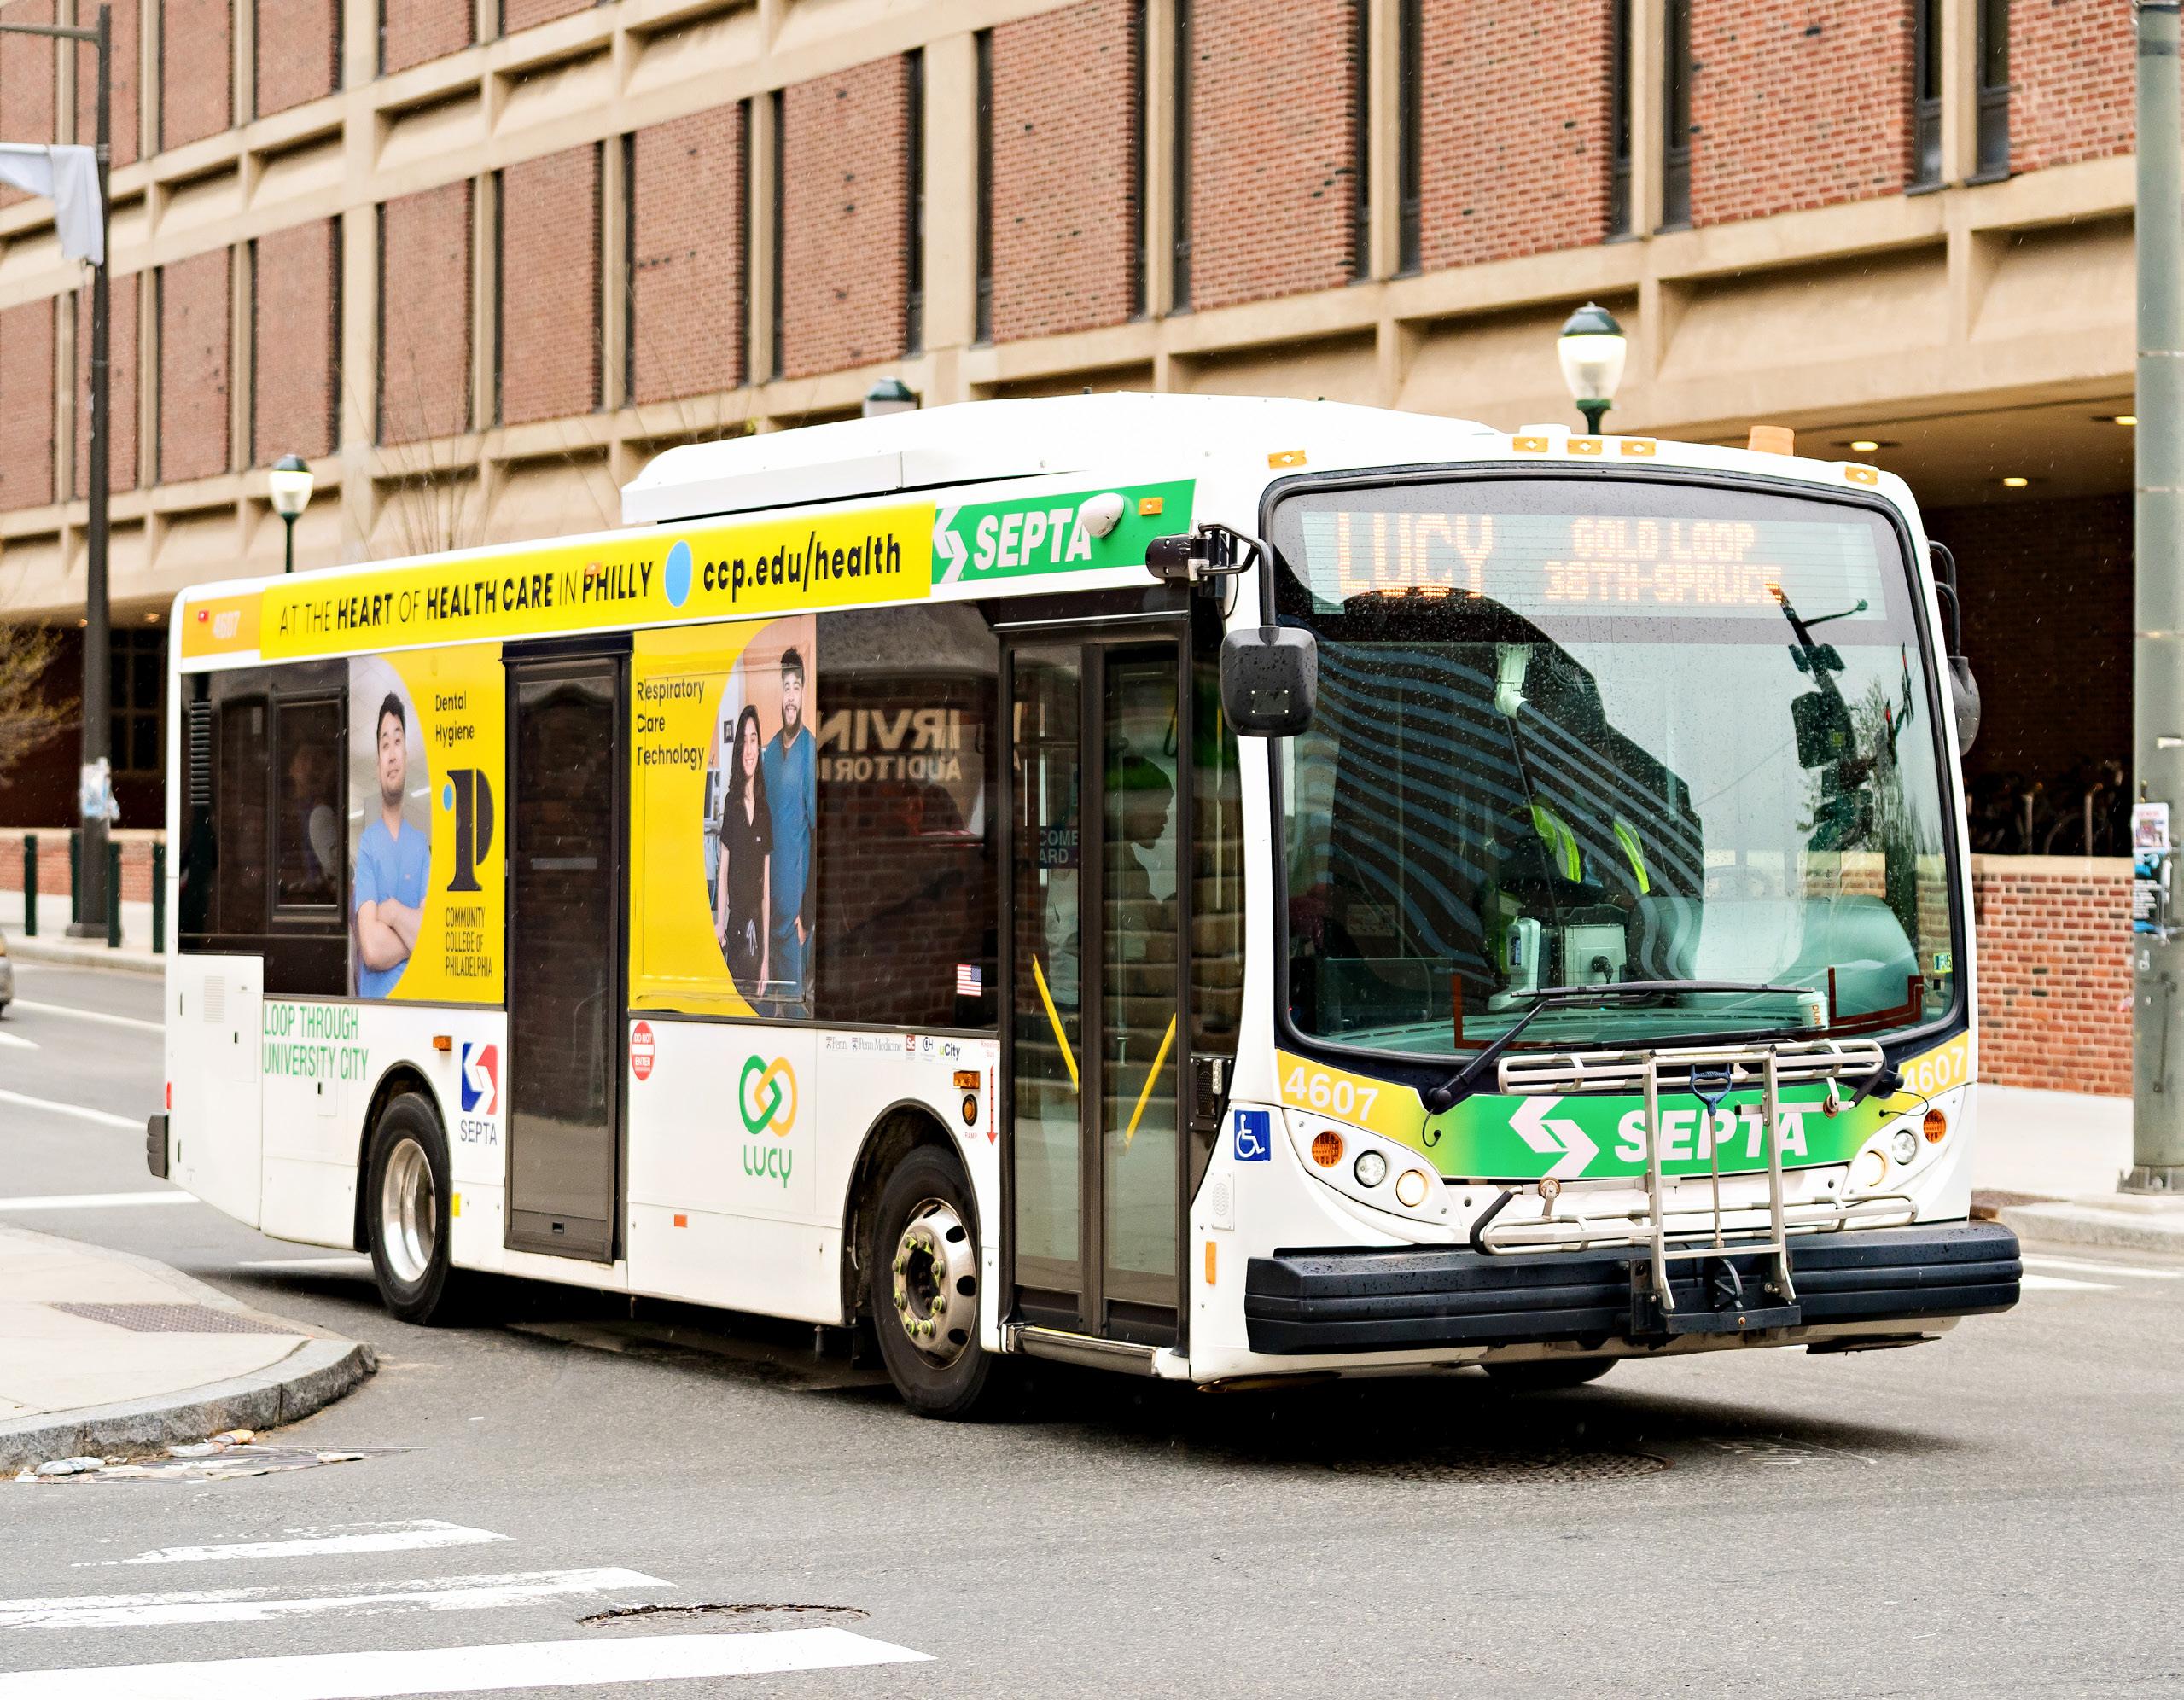
The Loop Around University City (LUCY), which UCD operates in partnership with SEPTA, has seen stable ridership since 2023, with 1,400 riders across both the Gold and Green routes. University City and its LUCY partner institutions are investing in the future of LUCY, including investigating improvements to the routes’ operations and marketing. To learn more about riding LUCY, click here.
LUCY RIDERSHIP
LUCY Green
LUCY Gold
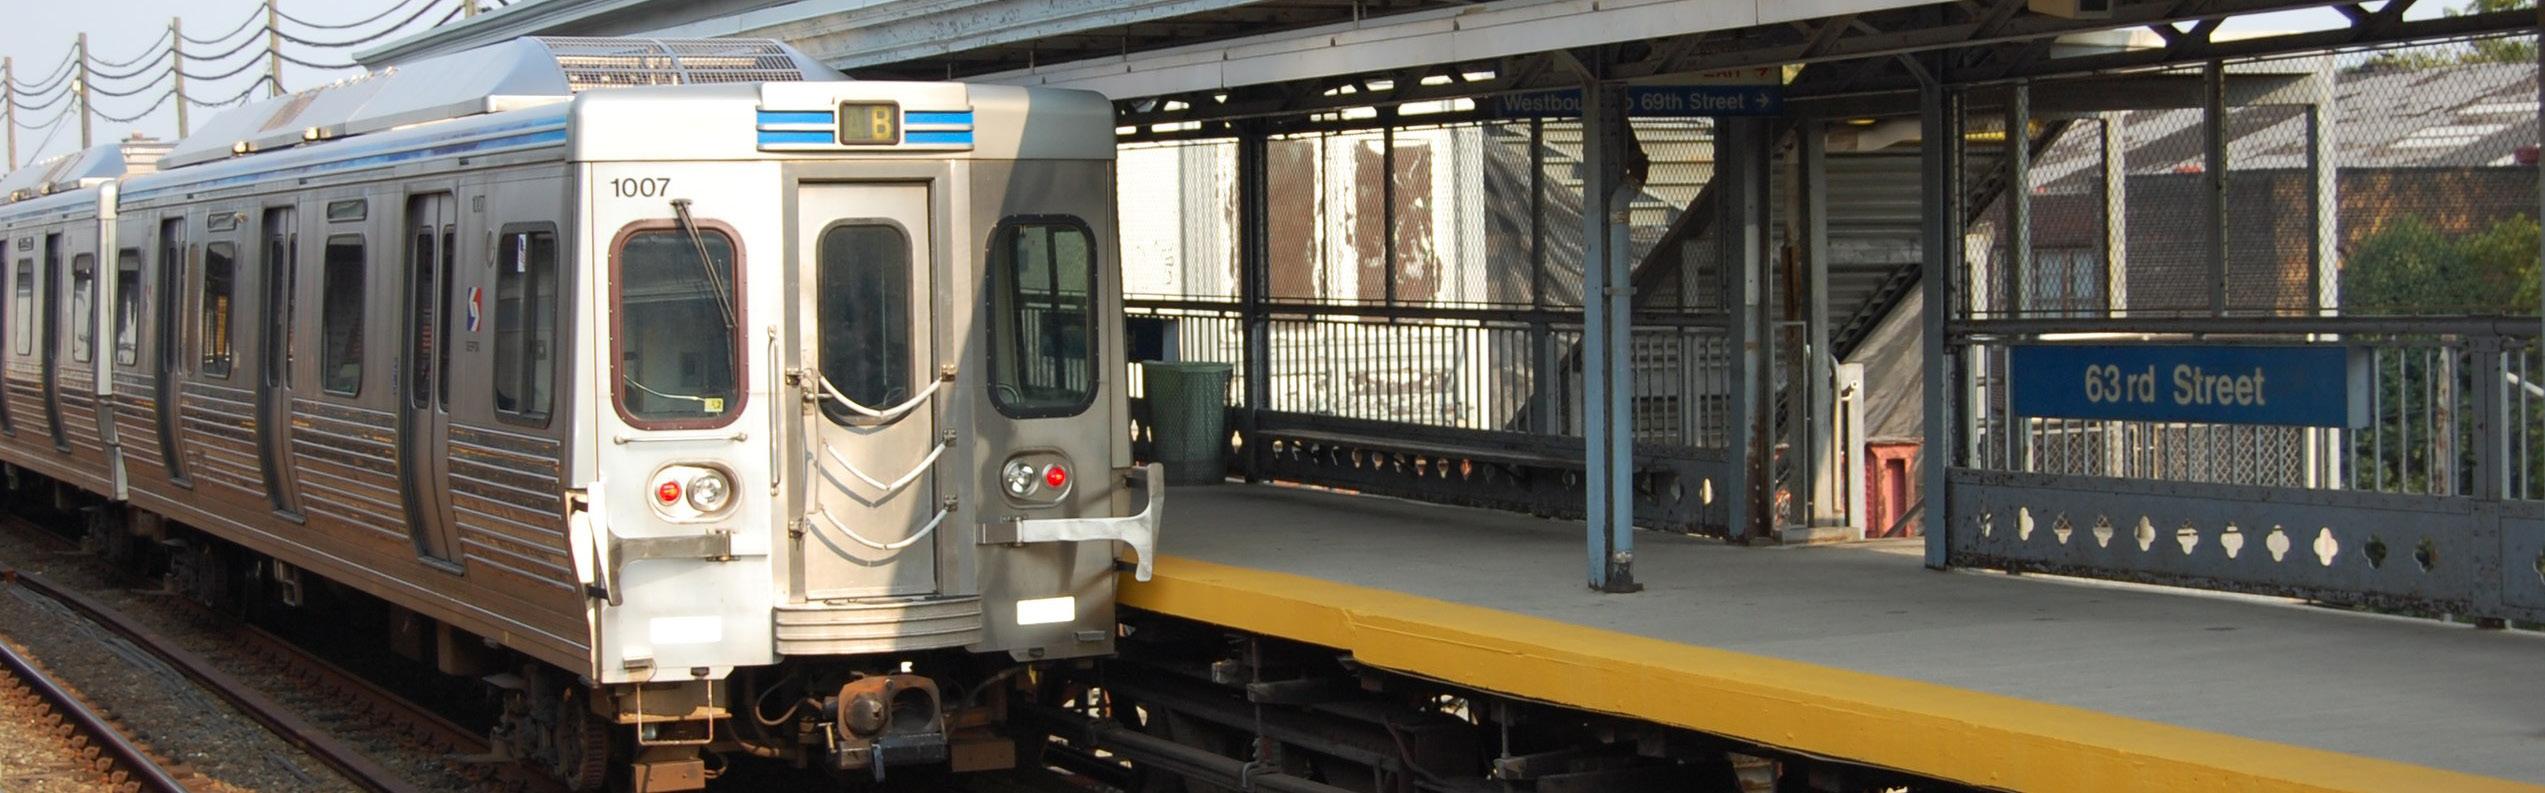
Trolley ridership remains relatively stable from 2024 to the first half of 2025, with just over 40,000 average weekday riders across the five lines that predominantly serve West Philadelphia. Ridership is distributed evenly across each route, with approximately 8,000 riders per day per line. The L1, formerly the Market Frankford Line, has surpassed 125,000 average rides per weekday for the first time since 2019. Meanwhile, Regional Rail ridership across all lines is up to 84,000 on the average weekday, an increase of 7.5% compared to the same period last year.
DAILY TROLLEY RIDERSHIP
DAILY L1 (MFL) RIDERSHIP
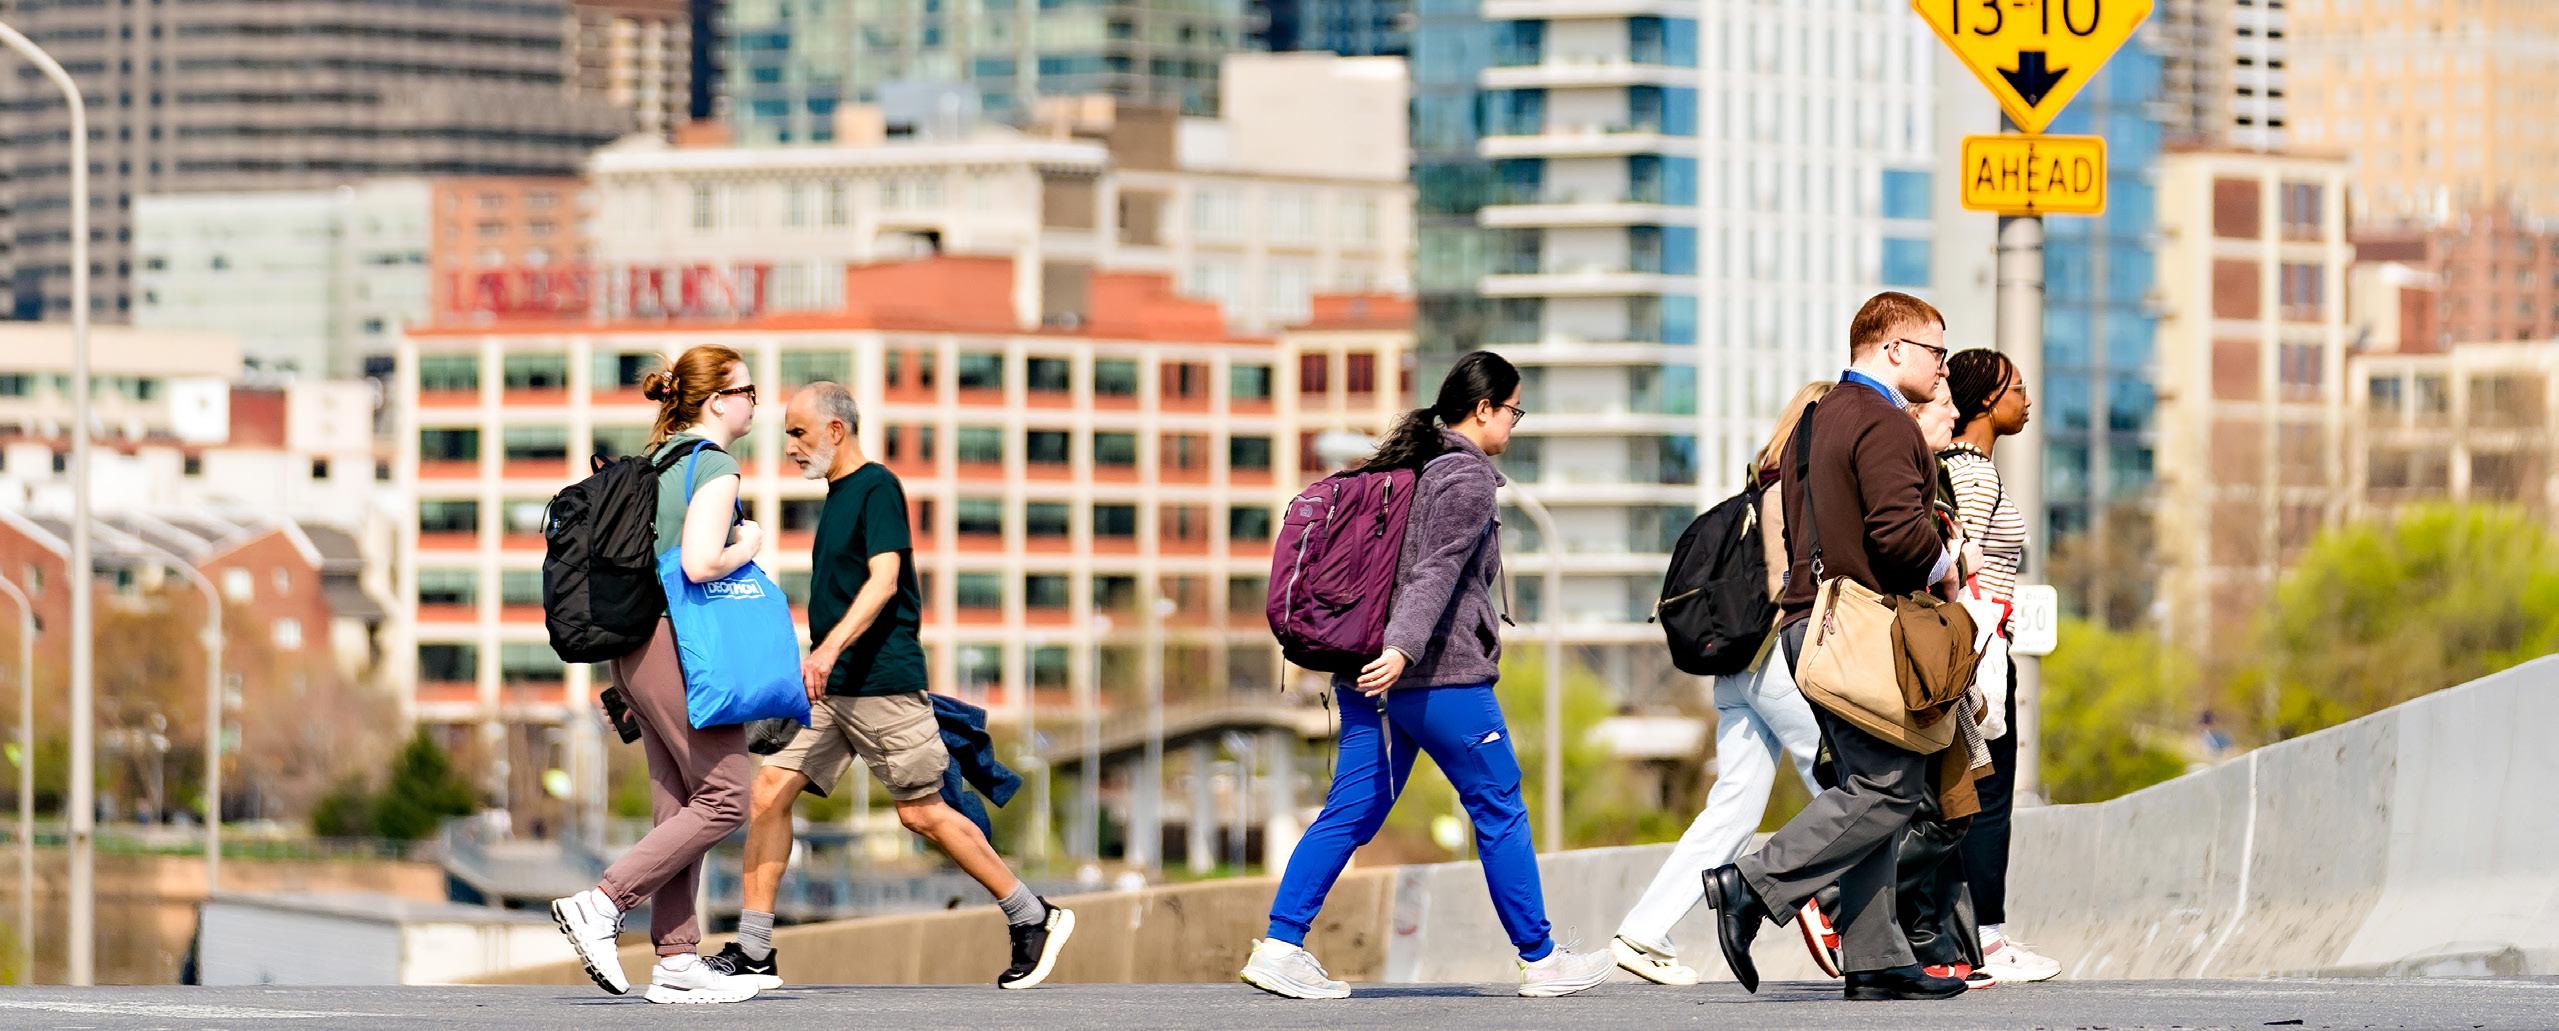
Pedestrians
Pedestrian visitor traffic in University City remains on a positive trajectory. Through the end of July 2025, non-resident visits to the area totaled over 21,000,000 for the year, up 3% compared to the same period in 2024, as measured by Placer.ai, an aggregated cell phone GPS service which counts all visits within UCD’s service boundary that are greater than 10 minutes. 14% of non-resident visits come from those who live within the three neighboring West Philadelphia ZIP codes (19143, 19139, and 19104), but not inside UCD’s service area itself. Among qualifying ZIP codes, 19103, which constitutes Center City West roughly between Pine and Vine Streets and from the Schuylkill River to 16th Street, saw the largest year over year increase in visits to UCD, an increase of 113,000 visits.
Pedestrian visitation numbers tell three distinct stories on the three key commercial corridors of University City defined as Baltimore Avenue, Walnut Street, and Lancaster Avenue. On Walnut Street between 36th and 40th Streets, at the edge of the University of Pennsylvania’s campus, visits peak each year in August and April. Overall visits during January through July 2025 are 97% of their 2019 figure and are up 10% compared to the same period last year.
On Lancaster Avenue, between 34th and Spring Garden Streets, visits are up a remarkable 23% since 2019 and are virtually identical to the 2024 figure. A string of developments along the corridor, including the large ANOVA uCity Square project completed in March 2022, may have contributed to this increase.
Baltimore Avenue still has the most room to grow in returning to its 2019 visit numbers of the three commercial corridors analyzed. It sits at 75% of the 2019 figure, with visits remaining identical between the same period in 2024. It is important to note that Baltimore started at a higher overall number of visits in 2019 when compared to the similar size and density of Lancaster Avenue. Foot traffic peaks each year in June when UCD’s Baltimore Avenue Dollar Stroll and the yearly Porchfest DIY music festival occur.
LANCASTER AVENUE COMMERCIAL CORRIDOR
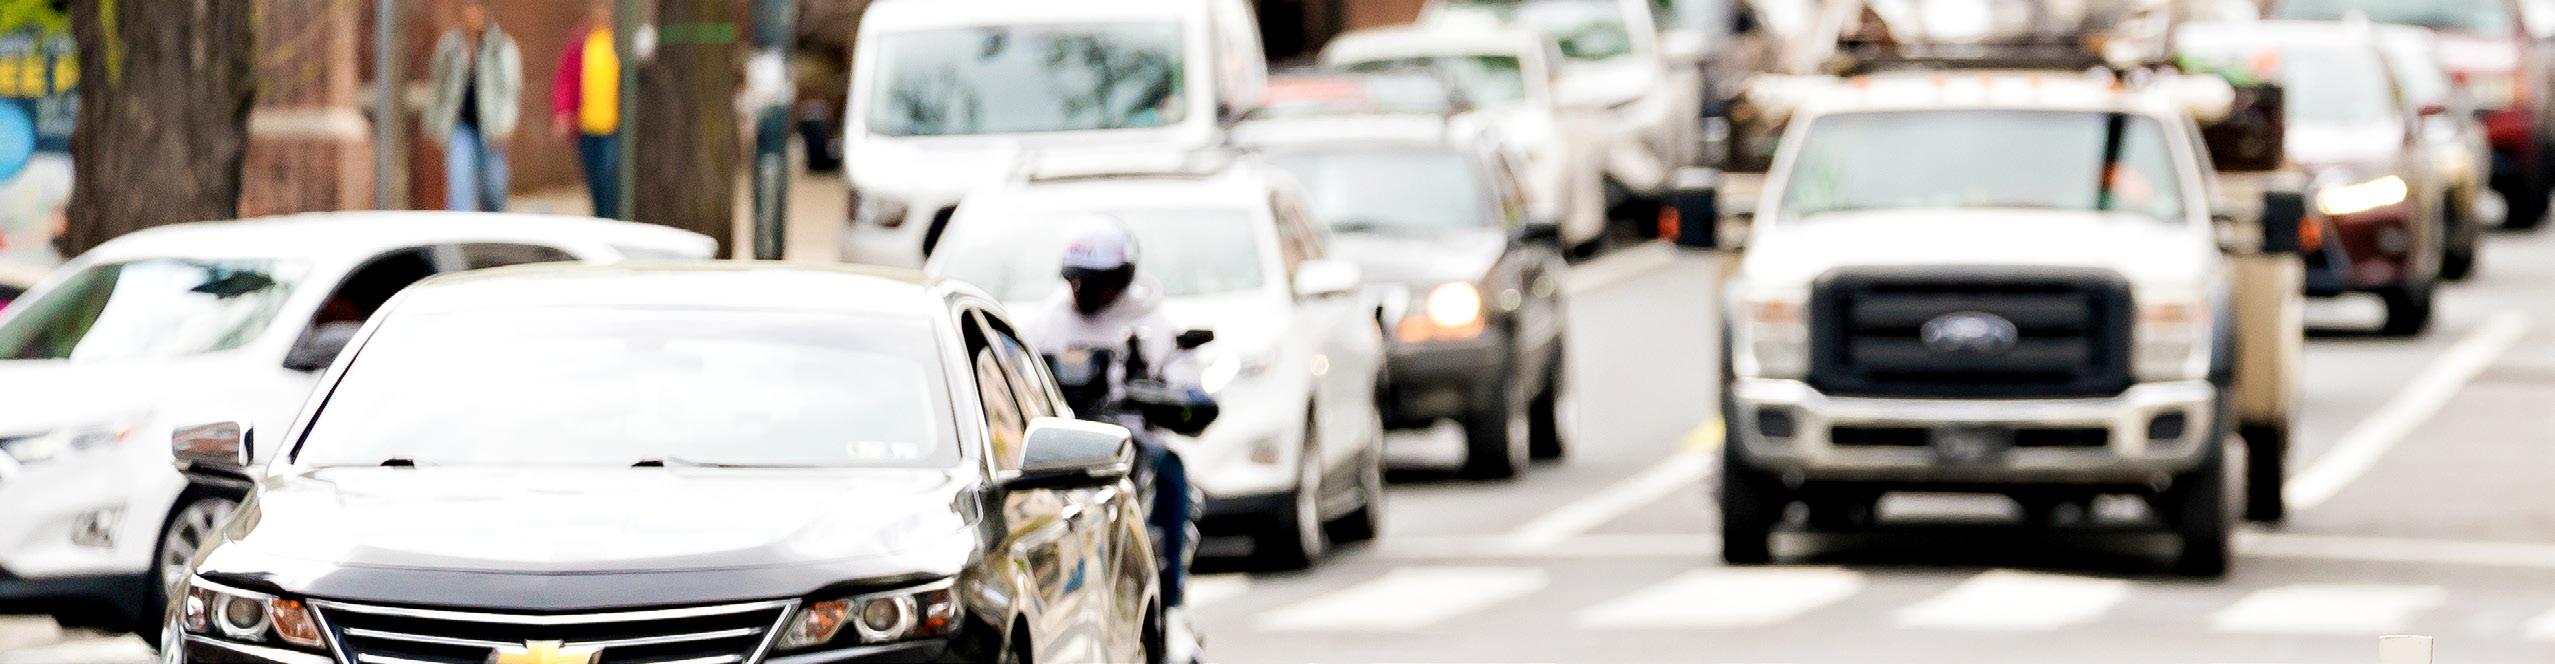
Cars
University City’s average daily private vehicle traffic has remained roughly constant from 2022 through 2025. Streetlight, a service that collects car trip data, reports that the volume of traffic in UCD is over 172,000 trips per day, excluding trips that pass through UCD but do not start or end inside it.
AVERAGE DAILY CAR TRAFFIC IN UCD
Traffic is concentrated in the areas around both hospital campuses in University City at Civic Center Boulevard and Penn Presbyterian, with significant volume also in the areas around 30th Street Station and Drexel University.
Car trip characteristics also remain in line with observations from the previous Transportation Report. 70% of trips have an average speed under 20 miles per hour, while 45% of trips are under 5 miles in length. Per Replica’s Fall 2024 data, in UCD 19% of all private auto trips are under 2 miles in length, totaling almost 40,000 trips per average weekday. This is a lower figure than Philadelphia as a whole (26%), yet higher than Center City at 17%.
The consistency of these attributes, along with the stable number of overall vehicle volume, tells us that while significant potential exists to convert low-distance car trips to multimodal modes such as bikes, scooters, or public transit, progress on this goal remains slow at best. We will continue to monitor how changes in the infrastructure and promotion of multimodal transit, such as the construction of the 47 th and 48 th Street bike lanes, impact these figures in the future.
Source: Streetlight Insights
Through street-level data, we can see that the highest volumes of short-distance car trips are concentrated on the main north-south links in central University City along 33 rd, 34 th, and 38 th Streets, as well as sections of Chestnut and Walnut Streets. 34 th Street between Ludlow and Cherry Streets accounts for the ten highest volume segments; in this stretch, over 20% of car trips are 2 miles or less in distance. 33 rd Street sees a similar percentage of short-volume trips, while Walnut and Chestnut Streets are lower, at 10-14%.
CAR TRIPS UNDER 2 MILES IN UNIVERSITY CITY
Source: Replica - Fall 2024, Average Weekday Traffic
The vast majority (76%) of trips under 2 miles on 33 rd or 34 th Streets are between Census Tract 90, which includes most of Drexel’s campus north of Market Street, and Census Tract 369.01, which comprises the majority of Penn’s campus between Market and Spruce Streets, from the Schuylkill River to 37 th Street.
While Chestnut and Walnut Streets see fast, frequent SEPTA service through Route 21, and have protected, separated bike lanes for much of their duration, 33 rd and 34 th Streets are comparatively lacking. North-south SEPTA service is patchy, requiring riders to walk to Market Street first to go southbound, and there is no protected bike lane between Drexel and Penn’s campuses. Replica’s transportation modeling forecast suggests that adding protected bike lanes to 33 rd and 34 th Streets (assuming a 10% mode shift to biking, which aligns with the current academic literature) would impact over 5,400 bike trips on the average weekday, potentially reducing vehicle miles traveled (VMT) by almost 4,000 miles.
Indego Bike Share
Indego ridership within our neighborhood is measured by trips that started or ended at a station within UCD. From January through the end of June, 114,000 trips started or ended in UCD, which represents 20% of all trips in Philadelphia (567,000 trips). Ridership in these first two quarters is down roughly 5% from the same period in 2024, perhaps due to the significantly lower average temperature in January and February 2025 (both were 5° cooler than the same months in 2024).
Indego trip characteristics in University City and Philadelphia continue to trend towards those on electric bikes and the Indego 365 pass. Indego 365 is the annually billed Indego pass, allowing unlimited rides of up to 60 minutes. Indego’s dataset does not differentiate between the base Indego 365 pass and the Indego 365 Plus pass, which adds two e-bike trips per day. The share of trips in University City taken on electric bikes rose by 5%, while the share of trips taken by Indego 365 passholders increased from 38% in 2024 to 45% in the first two quarters of 2025. Both figures are the highest shares achieved in Indego’s dataset, which goes back to January 2019. The growth in both categories is 5% higher in University City than in Philadelphia at large. Indego 365 passes are the only Indego pass type that allow the use of electric bicycle trips without an additional fee (up to a maximum of two per day), which may explain the similar increase in both categories.
Indego rides in University City remain more likely to be taken by an Indego 30 or Indego 365 Plus passholder than in the city as a whole. While the reintroduction of Indego’s single ride fare in August 2024 is likely the cause of the 5% increase in rides taken on short-term passes in UCD, their share of overall rides of 7% remains below Philadelphia’s average of 11%.
Trips (Q3 '24 - Q2 '25)
Source:Indego • Note: Change is measured from the most recent 4 quarters (Q3’24-Q2’25) compared to the
The most popular Indego stations within University City remain those to the east, including many that serve the Civic Center hospitals and 30 th Street Station. Stations north of Market Street have seen the largest fluctuation in the last two years, with the station at Saunders & Pearl seeing the largest increase in trips while Powelton & Lancaster has seen the most drastic decline. Stations in Center City West across the Schuylkill River remain the most popular destinations for origins outside of UCD, with the highest ridership stations being 23 rd & South, 23 rd & Market, and 21 st & Catherine.
Taken as a whole, Indego’s data suggests that riders in University City are more likely to be committed, long-term subscribers who use the system to commute to or visit high-impact employment or transit centers, including CHOP, HUP, 30 th Street Station, and employment centers in the core of University City along Market, Chestnut, and Walnut Streets.
Source:Indego
If you would like to discuss these findings in more depth or suggest future topics, please contact:
Joe Dizenhuz
Manager of Research
& Analysis
jdizenhuz@universitycity.org
267.635.2861
For press inquiries, please contact:
Chris Richman Vice President of Marketing & Communications chris@universitycity.org