IGS Ge de the
ACTIVITIES OF THE IOWA GEOLOGICAL SURVEY, 2021–22


of the Iowa Geological Survey 2021–22
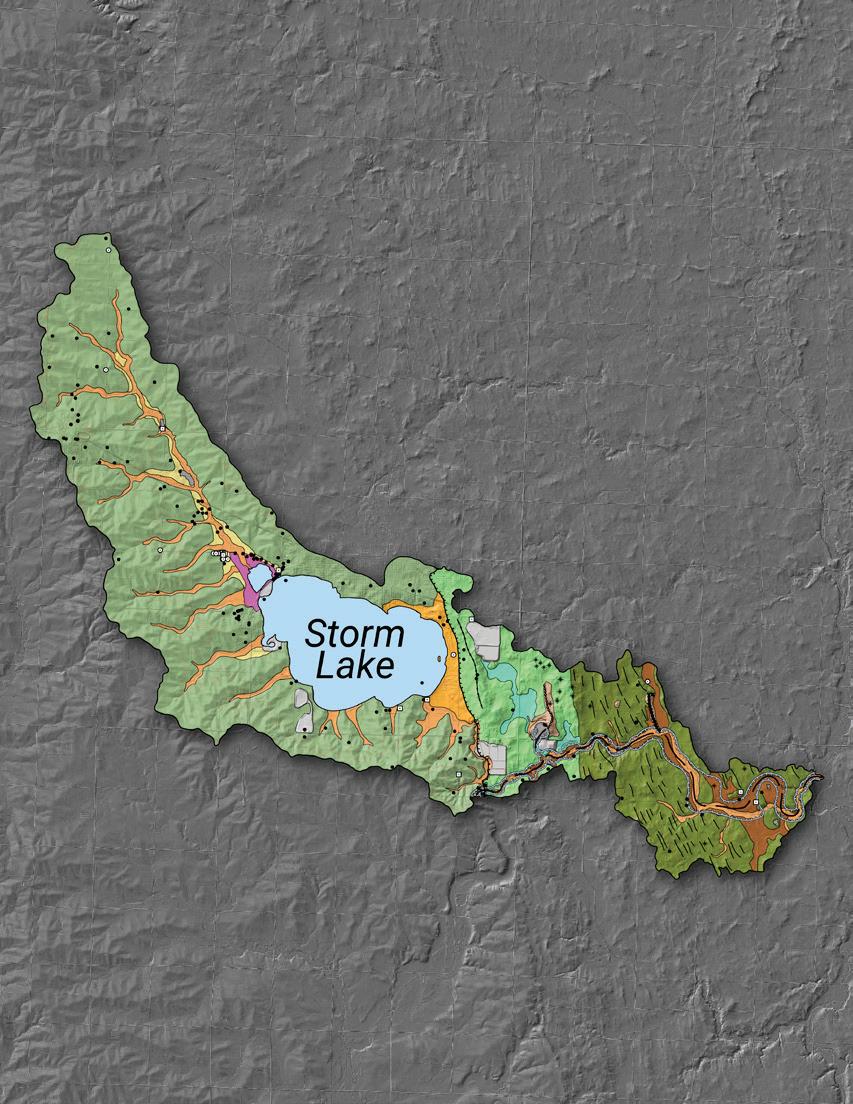
ON THE COVER: A 1:24,000 scale surficial geologic map of the Outlet Creek (HUC 12) Watershed, which includes Storm Lake in Buena Vista County.
THE IGS MISSION: To collect, reposit, and interpret geologic and hydrogeologic data; to conduct foundational research; and to provide Iowans with the knowledge needed to effectively manage our natural resources for long-term sustainability and economic development.

THE IGS VISION: To be a nationally recognized leader in geologic and hydrogeologic sciences, building upon our rich scientific heritage and serving Iowans through research, education, and outreach.
Editors: Alyssa Bancroft and Rosemary Tiwari Design: Benson & Hepker Design
Mapping the Illinoian Glacial Boundary in Southeast Iowa
Lake on the Plains: The Geologic History of Storm Lake
Effects of Cattle Manure, Crop, and Soil Parent Material on Shallow Groundwater Quality
A Snapshot of Iowa’s Water Resources –the Water Summary Update
Loess Hills State Forest
Monitoring Iowa’s Phosphorus Using Turbidity
Fluoride in Iowa Groundwater
Assessing Delta Sediments and NO3-N Reductions at Lake Red Rock
and
WELCOME TO THE 2021-2022 issue of The IGS Geode, our magazine that serves as an annual report of the Iowa Geological Survey. As previous issues have demonstrated, I think you will find a wide array of interesting and relevant projects highlighted this year as well. Over the years I have heard from readers that The IGS Geode is read cover to cover with great interest and shared among friends, relatives, and associates. I certainly enjoy attending meetings or outreach events and bringing along current and past issues to share, welcoming the inevitable questions or comments that its articles typically generate.
CONTACT US: Iowa Geological Survey The University of Iowa 300 Trowbridge Hall Iowa City, Iowa 52242 Office: 319-335-1575 Email: iihr-iowa-geological-survey@uiowa.edu Web: https://www.iowageologicalsurvey.org www.facebook.com/IowaGeologicalSurvey twitter.com/IowaGeoSurvey
Historical Watershed Studies
A feature we chose to highlight on this year’s Geode covers and in the article by Phil Kerr is the long-standing work done by the IGS on watershed projects throughout the state. One of Phil’s mapping projects this past year was focused on the Quaternary geology of the Outlet Creek (HUC 12) Watershed in west-central Iowa, which includes one of Iowa’s best known natural lakes, Storm Lake. The IGS has often conducted mapping as defined by political boundaries as part of the USGS STATEMAP Program, but in this case, we felt that the societal issues related to sediment erosion and water quality at Storm Lake required a different approach to mapping — one that recognized that environmental issues surrounding the lake relate first and foremost to the watershed area draining into it. Phil’s mapping effort revealed the complex history of the lake’s formation and will serve as the foundation for developing solutions for improving its future sustainability.
A focus on watersheds has always been important to the IGS and on the back cover we reflect on two long-term watershed monitoring projects that have been a part
of recent IGS lore. The Sny Magill/Bloody Run and Walnut Creek projects led by the IGS in the early 1990s through mid-2000s were nationally recognized, 10-year, paired watershed studies that documented the effects of conservation and land use change on water quality in Iowa. These projects, along with many others completed by the IGS, which now include Storm Lake and the Iowa Great Lakes, attest to the tradition and expertise of IGS geologists and hydrogeologists working at the watershed-scale.
Elsewhere in the 2021–2022 issue, you will find other stories, figures, and photographs related to watersheds, water quantity, and surface and groundwater quality. Matthew Streeter has been investigating the relationship between groundwater quality to fertilizer and manure applications at Kirkwood Community College, and together with a larger IGS effort funded by the Iowa Nutrient Research Center, we evaluated how grass waterways in agricultural catchments can be used to reduce subsurface nitrate contamination. New IGS post-doctoral researcher Elliot Anderson is working on a project that uses turbidity measurements in rivers to estimate total phosphorus export from watersheds in the state — an issue highly relevant to meeting nutrient reduction targets. We further introduce a new project funded by the Army Corps of Engineers at Lake Red Rock in southern Iowa where we are evaluating the potential impacts of delta sediment on nitrate loads in the Des Moines River. Lastly, Sophie Pierce zeroed in on groundwater quality in the state, evaluating how naturally occurring fluoride concentrations vary in Iowa’s major aquifers.
The IGS’ geological mapping efforts continue to pay dividends for Iowans. Mapping by Stephanie Tassier-Surine in southeast Iowa has better delineated the elusive Illinoian-age glacial advance. Furthermore, Stephanie and Alyssa Bancroft discuss how collaborations with the University of Iowa Department of Earth and Environment Sciences (EES) continue to benefit the IGS (as well as EES students). Ryan Clark and Alyssa team-up to report on the search for critical minerals in Iowa, a topic that will only increase in societal relevance in the coming decades. New tools for mapping are highlighted by Jason Vogelgesang
(geophysics) and Rick Langel (core photography) that will help lead the IGS into the next frontier of geology in the state.

Lastly, I wanted to report on a recent retirement at the IGS, after 24 years of service Mike Gannon retired this past February. We wish Mike all the best and will greatly miss his insights into Iowa’s groundwater resources and his important contributions toward improving aquifer sustainability using groundwater modeling. Greg Brennan has stepped into this role at the IGS and we look forward to his contributions! Greg has also been leading IGS efforts to use passive seismic geophysics to constrain bedrock depths and is developing new approaches for evaluating aquifer vulnerabilities in the state.
Overall, as I seem to mention each year, the breadth of skills and amount of interesting work being done by our IGS staff is amazing. We utilize a rather shoe-string contribution from the state that provides only 40% of our operating expenses, and leverage some of this base funding to acquire other projects and contracts. Given the expertise and capabilities of the IGS Team, imagine what we could do if we received an increase in state appropriation that would put us at a similar level as other state-funded scientific centers, such as the Iowa Nutrient Research
Center or the Iowa Flood Center (increase to $1.5 million appropriation). An increase of this nature would allow the IGS to place more focus on regional statewide initiatives which help ensure that sustainable soil, mineral, and water resources are locally available for the future. I truly believe the IGS has demonstrated an unmatched trackrecord of excellence over the years, but that it could be greatly enhanced for the benefits of all Iowans.
KEITH SCHILLING State Geologist
WHEN PRECISE, DETAILED geologic information is needed at a specific site then a core is collected by drilling solid, continuous, cylindrical sections of the underlying bedrock (a borehole). The IGS houses a unique repository of rock cores from the state of Iowa at a facility on the University of Iowa Oakdale Campus.


Similar to the final scene of Raiders of the Lost Ark, the rock core stored at the IGS’ Rock Library are stored in cardboard boxes and stacked in row upon row of shelving in the Oakdale warehouse. Until recently, the only way for anyone to view this core was by visiting the IGS repository, which severely limited the accessibility of this collection.
However, that all began to change in 2016 due to the assistance of funding from the U.S. Geological Survey’s National Geological and Geophysical Data Preservation Program (NGGDPP). Two NGGDPP grants have allowed the IGS to hire numerous students to help photograph the core and to create a website for the images.
After nearly six years, the IGS has essentially photographed its entire core collection — just under 15,000 core boxes from more than 1,100 boreholes have been imaged. Laid end-to-end, the core in these boxes would span more than 27 miles. The best part of this multi-year endeavor is that all of these core photographs (such as Figures 1 and 2) are available for viewing anytime via the IGS GeoCore website (https://www.iihr.uiowa.edu/ igs/geocore/home). These photographs depict the lithologies (rock types) of 130 (of 155 total) different geologic bedrock units (groups and formations) that have been formally described here in Iowa. Check out IGS GeoCore if you have questions about what a certain type of rock looks like — you may be able to find your answer. However, if you are unable to find your answer, please let us know and we would be more than happy to help answer any questions you may have.
In the meantime, we’ll be finishing photographing the last few cores that still need to be imaged in the IGS’ Rock Library.
FIGURE 1
One
The aftermath of a meteorite impact preserved in a rock core that was drilled as part of an IGS study of the Manson Impact Structure in Pocahontas County, Iowa (in 1991).
IF YOU HAVE DRIVEN around Iowa and looked at the rolling agricultural landscape, you cannot help but notice linear strips of grass that occupy drainageways between cropped hillsides. These features, called grass waterways, are a common agricultural conservation practice to slow surface water runoff and reduce soil erosion from farm fields. As a soil erosion reduction practice, the benefits of grass waterways are well understood, but the subsurface characteristics and potential nutrient reduction benefits of grass waterway systems have not been investigated. In work funded by the Iowa Nutrient Research Center (INRC), the Iowa Geological Survey (IGS) evaluated the subsurface soils and hydrogeology found in two drainageway areas in eastern Iowa and assessed the potential for nitrate (NO3-N) processing to occur in these lowland environments.
Our study focused on grass waterways located south of Cedar Rapids in Linn County, Iowa. One area was on property owned and managed by Kirkwood Community College (Kirkwood) and the other area was on
farmland owned by the College Community School District. Both fields with grass waterways were being managed under twoyear corn and soybean crop rotations and drainageway vegetation primarily consists of cool-season smooth brome.
The IGS drilled 12 shallow borings across six different drainageways at each of the two study areas and installed monitoring wells in each borehole. Sediments in these grass waterways consists of fine-grained, nutrient-rich alluvial soils derived from the erosion and deposition of upland loess and till. Mean concentrations of NO3-N in grass waterway groundwater (3.1 mg/L) were 70% lower compared to groundwater beneath nearby cropped fields (10.5 mg/L). A shallow water table in the organic-rich drainageway soils provides the requisite organic carbon, anaerobic soil conditions, and nitrogen supply for denitrification to occur. A numerical groundwater flow model was developed for the Kirkwood site and was used to estimate groundwater flow from the catchment to the waterway (Figure 1). Modeling suggests
that groundwater from the surrounding catchment discharges approximately 53 m3/day into the waterways and reduces NO3-N mass by 144.3 kg/yr (or 7.8 kg/ha). This amount of NO3-N load reduction is similar to the load reductions measured by conservation practices such as saturated buffers, bioreactors, and oxbows.
Subsurface tile drainage is a recommended grass waterway design practice, but this results in groundwater bypassing the possible denitrification that occurs in these drainageway deposits. Based on data from this study, it is important to consider possible modifications to existing grass waterway practices and reconnect upland groundwater with organic-rich drainageway deposits to enhance NO3-N reduction. Ultimately, grass waterways could be better exploited for additional NO3-N processing of tile drainage water in the agricultural Midwest.
Results from this study were recently published: Schilling, K., M. Streeter, S. Pierce, G. Brennan, and M. St. Clair, 2022. “Subsurface Nitrate Processing Beneath Drainageways: Are They Landscape Opportunities for Subsurface Drainage Remediation?” Journal of the ASABE (American Society of Agricultural and Biological Engineers), 65(5):985-995.
FIGURE 1. Groundwater model domain and simulated hydraulic heads at a grass waterway monitoring site in eastern Iowa on property owned and managed by Kirkwood Community College (south of Cedar Rapids, Linn County).

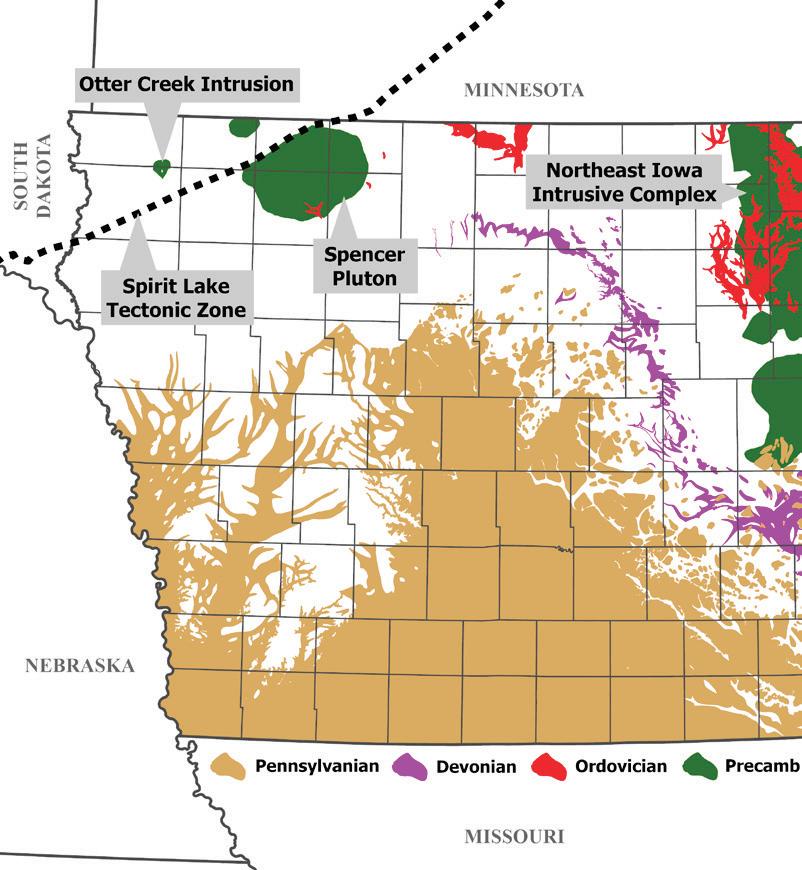
FIGURE 1. Map showing the various Earth MRI focus areas in Iowa. Most of these focus areas have been or are currently being investigated and the others remain eligible for future funding by the initiative.
In 2018 the United States Geological Survey (USGS) implemented a partnership with state geological surveys (and industry) to evaluate the critical mineral potential of the country — the Earth Mapping Resources Initiative (Earth MRI). To accomplish this mission, Earth MRI is using a multi-faceted approach that focuses on geologic mapping, geophysical surveys, and increasing the LiDAR (light detection and ranging) coverage across the country. The Iowa Geological Survey (IGS) is among the more than 30 state geological surveys participating in the program and is actively engaged in a variety of projects.
The USGS defined a list of 35 critical minerals (CMs) as non-fuel commodities that are significantly sourced from foreign countries and whose supply chains are vulnerable to disruption. The list includes elements, minerals, and groups of elements (e.g., uranium, barite, and rare earth elements) that are vital to our Nation’s economy and security. This initiative is intended to address the country’s need for critical minerals by conducting an inventory of domestic deposits that could help alleviate, or in some cases eliminate, our dependency on foreign supplies. Using a mineral systems approach, the USGS and participating state survey staff compile a comprehensive list of “focus areas” that have the potential to host CMs. Each year the program focuses on a subset of the list of 35 CMs and funds projects that address those specific commodity groups. In most cases, the projects include multiple states and require the seamless collaboration of state survey staff conducting field work, collecting samples for geochemical analyses, processing and analyzing data, and synthesizing the findings in reports and maps.
The state of Iowa potentially hosts valuable and viable CM deposits due to its extensive Paleozoic sedimentary rock record as well as its Precambrian basement geology, which includes a large portion of the Midcontinent Rift System and associated igneous intrusions (Figure 1). The IGS has collaborated with more than a dozen state surveys on large-scale geochemical reconnaissance projects on Pennsylvanian-, Devonian-, and Ordovician-aged rocks in the Midcontinent and Appalachian regions. A Pennsylvanian project, led by the West Virginia Geological Survey, involved six states and focused on the characterization of underclay (paleosol) deposits that are potential hosts for lithium. The Indiana Geological and Water Survey led a project that included 15 states and focused on delineating rare earth element (REE) concentrations in Devonian phosphatic shales. Currently, the IGS is leading a project with the Illinois State Geological Survey that involves six states to assess the potential for REE-enriched phosphatic shales in Ordovician rocks.
The future of Earth MRI is bright, thanks to an influx of funding via the Bipartisan Infrastructure Law that was passed in late 2021. The Kansas Geological Survey recently began a project involving seven states, including Iowa, to investigate Pennsylvanian black shales as potential hosts for REEs, vanadium, uranium, and a variety of other CMs. Additionally, the Earth MRI program will fund a large-scale airborne geophysical survey over portions of northwestern Iowa and adjacent parts of Nebraska, South Dakota, and Minnesota in 2023. That survey will refine our understanding of concealed Precambrian igneous intrusions and the Spirit Lake Tectonic Zone as potential sources of CMs.

FIGURE 1 (ABOVE).
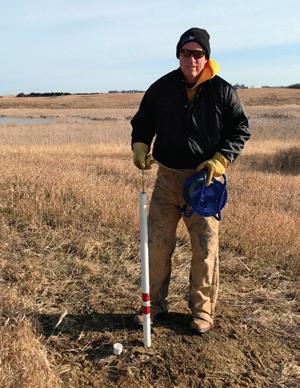
Installation of a shallow monitoring well in the Iowa Great Lakes Watershed.
FIGURE 2
State Geologist Keith Schilling measuring water table depths at a newly installed monitoring well at the Spring Run Wetland Complex near East Okoboji Lake, in Dickinson County.
THE IOWA GEOLOGICAL SURVEY (IGS) works collaboratively with the Iowa Department of Natural Resources (Iowa DNR) on many issues related to Iowa’s water and natural resources. The organizations share data and expertise across several different platforms, including information related to well records, geologic samples, pump test data, and geospatial data. During the 2021-2022 fiscal year the IGS provided the Iowa DNR with the following services:
• IGS staff, led by Rick Langel, updated the IGS GeoSam database by adding 905 well records. Of these records, 40 were specifically for the Iowa DNR’s Water Supply Engineering programs and 32 were specifically for the Iowa DNR’s Animal Feeding Operations program.
• IGS staff, led by Ryan Clark, provided lithologic strip logs for two wells. One was a Jordan well in Clarke County that was 2,985 feet deep and the other was a Dakota well in Buena Vista County that was 465 feet deep.
• IGS provided an urgently needed lithologic strip log for a public water supply well as part of an arsenic mitigation issue at an active drilling site.
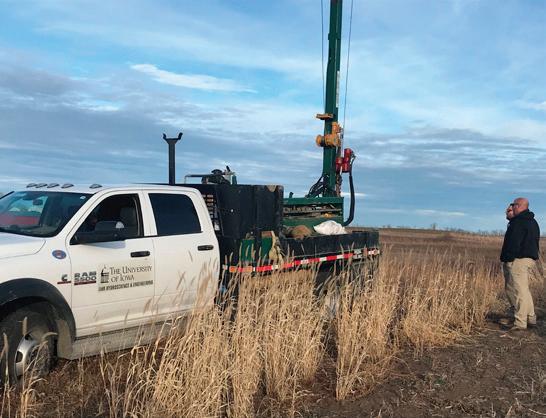
• IGS is working closely with DNR Lake Restoration and Fisheries programs on a water budget and nutrient diagnostic study of the Iowa Great Lakes. Led by State Geologist Keith Schilling and Research Soil Scientist Matthew Streeter, the IGS installed and sampled monitoring wells and is leading the coordination of discharge and turbidity monitoring and surface water sampling at multiple sites in the watershed.
• IGS staff, led by Greg Brennan, evaluated shallow groundwater levels monthly for inclusion in the Iowa DNR’s monthly Water Summary Update. The IGS input specifically aids on-going assessment of drought conditions and potential impact to shallow alluvial aquifers.
• State Geologist Keith Schilling joined the Iowa DNR-led science team to develop the Iowa Drought Plan.
• Phil Kerr gave a presentation to the Iowa DNR staff at the Stream and Watershed Integrated Management (SWIM) Workshop (July 2022) on landform regions and watershed characteristics of Iowa.
FIGURE 1 (BELOW).
Coal fragments are common in the Illinoian glacial sediments of southeast Iowa as a result of the bedrock materials the glacier passed over as it advanced into this region of the state.

FIGURE 2 (LEFT).
Recent surficial geologic mapping in southeast Iowa has moved the terminal boundary of the Illinoian glacial advance farther south in Lee County than it had been previously mapped.
 Stephanie Tassier-Surine
IOWA HAS BEEN glaciated at least nine times over the last 2.6 million years. Many people are familiar with the Des Moines Lobe landform region in north-central Iowa that represents the last glacial advance into the state. However, a lesserknown advance in Iowa occurred between approximately 130,000 to 190,000 years ago in southeast Iowa. This advance only extended about 25 miles into the state, as the Lake Michigan Lobe crossed Illinois and entered Iowa from the northeast. These deposits are differentiated from earlier glacial advances that came from the north by the mineralogy and clasts of the glacial till. The clay mineralogy and clast lithology of these deposits is distinct because the advancing glacier travelled over Pennsylvanian-age rocks in Illinois. Most easily recognized are coal fragments (Figure 1) and various shale and sandstone clasts. The land surface also yields clues
to the presence of this glacial advance. In southeast Iowa, the terminal moraine (the maximum extent of the glacial advance) is evident as a ridge running roughly north to south through Louisa, Des Moines, and Lee counties. Several towns are perched atop this ridge, including Keokuk and West Point, and the orientation of river drainages (away from this ridge) is also a clue. The terminus is more difficult to discern farther north in Muscatine and Scott counties, but historic convention places the boundary coincident with the Wapsipinicon River. Earlier maps have extended the terminal edge of the Illinoian glacial advance as far north as Clinton County, however further study is necessary to confirm this.
Recent mapping by the Iowa Geological Survey (IGS) as part of the U.S. Geological Survey STATEMAP program has helped to refine the Illinoian boundary and characterize its glacial sediment record.
The IGS has been mapping bedrock and surficial geology in southeast Iowa since 2017 and completed a Surficial Geologic Map of Lee County in 2022. It has been nearly 40 years since former IGS geologists established the framework for the Illinoian glacial advances in southeast Iowa. The majority of the field work conducted for the previous studies was completed north of Lee County, but new geospatial data (LiDAR topography, digital soil surveys) and drill holes have been used to refine the Illinoian boundary, especially near Keokuk (Figure 2). As a result of these recent STATEMAP surficial mapping efforts, a new boundary of the Illinoian terminal moraine has been defined in southeast Iowa.
Tassier-Surine, S.A., R.J. Clark, P. Kerr, and A.M. Bancroft, 2022. Surficial Geologic Map of Lee County, Iowa: Iowa Geological Survey, Open File Map OFM-22-2, 1:100,000 scale map sheet.

FIGURE 1.
Map view (top) showing two of the electrical resistivity (ER) geophysical lines completed as a part of this site characterization. The ER geophysical results (bottom, left-to-right) from the West Line and the East Line, respectively. Locations of horizontal-to-vertical spectral ratio (HVSR) passive seismic data are also shown.
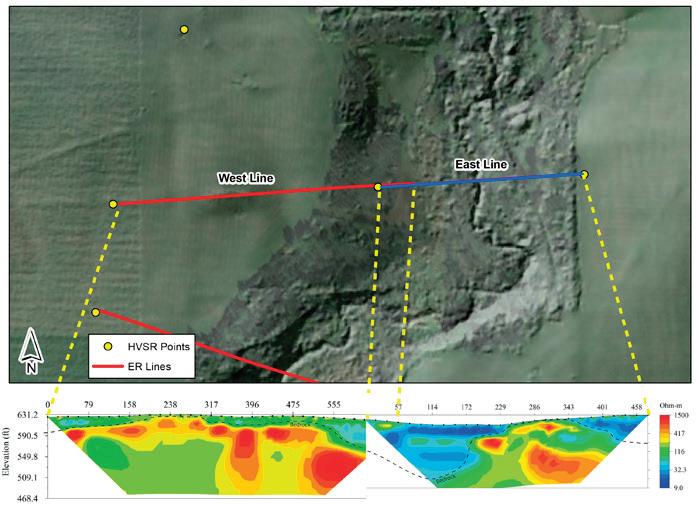
Understanding how bedrock depth and topography vary across an area is very important for many applications and, like many aspects of life, the closer you examine something the more details are revealed. The IGS was recently commissioned to assist with a complex hydrogeologic site characterization. The site was investigated using two different geophysical methods, electrical resistivity (ER) and horizontal-to-vertical spectral ratio (HVSR) passive seismic. The purpose of this work was to develop high-resolution bedrock topographic and depth to bedrock maps of the site. The new maps will be used to better understand the groundwater flow regime of the site, which
is complicated by an extremely variable bedrock surface. In addition to the new ER and HVSR geophysical surveys, a wealth of existing borehole data was evaluated and incorporated into the dataset that was used to construct the bedrock elevation map. Results from the geophysical surveys were ground-truthed and interpreted alongside existing borehole data, and a high-resolution bedrock topographic map was created.
Figure 1 shows results from two ER surveys in the northern part of the study area. A clear bedrock surface was interpreted between the green and blue colors (dashed line) on the geophysical profile, indicating that a bedrock channel,
Detailapproximately 90 feet in depth, exists toward the west end of the East Line (shown in blue in Figure 1, map view). Some resistivity variability exists in this channel feature (green horizontal feature on the geophysical profile), possibly indicating variability among the unconsolidated geologic materials filling the channel. Bedrock appears to rise near the surface toward the center of the line and then drop again toward the east. Since the major channel feature toward the west of the East Line was not imaged to its full western extent, a separate ER line (shown in red in Figure 1, map view) was deployed just west of the East Line, with approximately 60 feet of overlap between the two lines.
Since these lines were collected in a similar geologic setting, resistivity scales were normalized (9 – 1,500 ohm-m), allowing for direct color-to-resistivity comparisons. Results from the West Line correlate well with results from the East Line. A clear bedrock surface is interpreted between the yellow and green colors (Figure 1, dashed line on geophysical profile). Bedrock appears to drop off toward the east of the West Line, corresponding with the channel feature imaged on the East Line. In this case, a clear western extent of the feature appears to be imaged on the West Line and indicates that this channel could be approximately 240 feet wide at this location. Bedrock appears to rise near the surface along the majority of the West Line, with some variability, and then drops slightly toward the west.
Three map products were created as part of this project: a bedrock topography contour map, a bedrock elevation raster map, and a depth to bedrock raster map. Although the IGS has delineated the bedrock topography of the entire state with
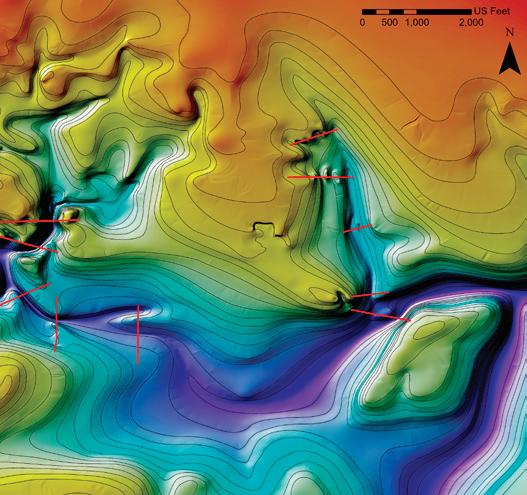
50-foot contour intervals, much finer detail was required for this site characterization. Consequently, the bedrock topography map for this project was drawn using 10foot contour intervals to further refine the resolution of the bedrock surface. Figure 2 is a colorized raster image of the bedrock elevation map interpolated from the bedrock elevation contours. A “hill shade” effect was applied to enhance the relief of the bedrock surface. Illustrating bedrock topography is an interpretive process that involves assessing the validity of each data set while making every effort to generate a realistic visualization of the entirely concealed bedrock surface. Understanding how modern waterways erode and sculpt regions of Iowa with near surface carbonate bedrock was an important aspect for interpreting the likely morphology of incised bedrock channels underlying the site. Across the study area, the estimated bedrock elevation varies by more than 100 feet. As an example, the transect area (Figure 1) shows a decrease in bedrock elevation of more than 80 feet in only 50 horizontal feet.
The integration of geophysical surveys and bedrock elevation mapping revealed a significant bedrock channel in the western part of the site. The depth to bedrock in this channel could be up to 120 feet below the ground surface. This western channel appears to shallow sharply toward the north where it branches in multiple directions. The southern portion of the study area has less borehole data coverage and the bedrock channel appears to widen while continuing to gradually deepen toward the east. Another more subtle bedrock channel is also apparent in the eastern part of the site. This channel appears to be less sharply incised but also shows evidence of karst in the bedrock. Unlike the western channel, the eastern channel does not appear to branch out toward the north. Results from this investigation are currently being used to map high-resolution groundwater flow at the site.
FIGURE 2. Colorized raster image of the bedrock elevation generated from the bedrock topography contour lines (10-foot interval). The location of the electrical resistivity (ER) geophysical surveys completed as part of this site characterization are depicted in red.
FIGURE 1. Water from the Outlet Creek Watershed drains to the Mississippi River despite being significantly closer to the Missouri River.
FIGURE 2.
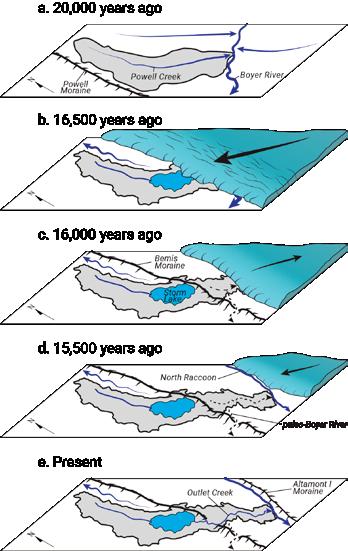
a) The western boundary of the modern watershed was set in place by a glacial advance 42,000 years ago creating the Powell Moraine, which has since been eroded. b) Ice advanced into the map area and reached its maximum 16,500 years ago, which dammed Powell Creek to form Storm Lake and filled the Boyer River with coarse sediment (Figure 3). c) Ice retreated out of the mapping area. d) Ice readvanced and formed the Altamont 1 Moraine (shown in Figure 2e) and the North Raccoon River.
Storm Lake, located in western Iowa, is a seeming contradiction to the surrounding landscape. This body of water is the only sizeable natural lake west of the Des Moines Lobe and is significantly shallower than most of the Iowa Great Lakes to the north. Oddly, it does not drain to the nearby Missouri River, but to the Mississippi River in the very southeast corner of the state (Figure 1). The basin surrounding Storm Lake is the Outlet Creek Hydraulic Unit Code (HUC) 12 Watershed, and the area is relatively flat due to Quaternary glaciations. Today, this area of the state is predominantly in row crop agriculture, but the sediments blanketing the region indicate a rich history of very different environments and climates in the recent geologic past. Due to current land usage, the lake is threatened by excessive siltation and nutrient loading.
Understanding the geologic history between Storm Lake and its basin is essential for preserving the lake’s future. An innovative approach is necessary for understanding this complex relationship — and such an approach requires mapping outside of the 7.5’ quadrangle box. This was the IGS’ first STATEMAP project using a watershed as the map boundary (cover image of Geode). Reframing the mapping investigation allowed simultaneous assessment of the evolution of the watershed while also accounting for modern-day issues. Completing this endeavor required thorough consideration of the types of sediments, their processes, and the timescales at which they were emplaced or reworked.
The Outlet Creek (HUC 12) mapping area includes two landform regions, the Northwest Iowa Plains (NWIP) to the west and the Des Moines Lobe (DML) to the east, and both areas contain landforms that are relicts of previous glacial advances. The NWIP is underlain by clay-rich glacial till of the Sheldon Creek Formation, deposited approximately 42,000 years ago. From around 28,000-20,000 years
ago, most of northern Iowa underwent a period of hillslope erosion driven by melting permafrost which transferred large volumes of upland sediments into the valley. The overall effect was that highangled slopes were beveled down. A thin layer (5 feet) of Peoria Loess was blown in around 30,000-18,000 years ago and since its deposition has been reworked via slopewash which has smoothed the topography even further.
The NWIP and the DML are, tellingly, separated by the terminal Bemis Moraine. This landform, and the rest of the DML topography, was formed by the advance, retreat, and collapse of the most recent ice advance approximately 16,500 years ago. The resulting landscape consists of glacial landforms such as kettles, kames, eskers, and ‘washboard’ moraines (linear features that are 5 to 10 feet higher than the surrounding till plain). Due to the combination of processes on both landform regions, the Outlet Creek (HUC 12) Watershed has a subdued topography when compared with much of the state.
The complicated drainage arrangement of Powell Creek and the Boyer River, as well as the formation of Storm Lake, is closely tied with the glacial history of the area (Figure 2). Before the last advance of the Des Moines Lobe, Outlet Creek and the North Raccoon River did not exist. Instead, the area was drained entirely by Powell Creek then flowed into the paleo-Boyer River which was a tributary of the Missouri River. However, as Des Moines Lobe ice reached its maximum extent 16,800 years ago it produced thick deposits of outwash sand and gravel which filled the Boyer Valley. Ice also formed the Bemis Moraine, damming Powell Creek. It was the combination of these processes that resulted in the formation of Storm Lake. Now, although the headwaters of the Boyer River still have a well-defined geometry, no water flows within the valley, which contains thick sand and gravel deposits just a few miles from Storm Lake. Sometime after the
ice retreated, the Bemis Moraine gave way but the new drainage, Outlet Creek, could not reoccupy the former western pathway to the Missouri River because the Boyer River was blocked and no longer accessible. The path of least resistance was east across the freshly glaciated till plain via a sand- and gravel-filled meltwater channel, which empties into the North Raccoon River. This dramatic rerouting provides the explanations for why Storm Lake is the largest lake outside of the Des Moines Lobe landform region and why it drains to the Mississippi River. Today, Powell Creek flows into Little Storm Lake and lies in a broad, sediment-filled valley. The lower part of this sedimentary package is made of mudflow-like material deposited by erosion from melting permafrost, but these coarse sediments are buried by a large volume of reworked loess that has been mobilized by recent land use practices.
Mapping the Outlet Creek (HUC 12) Watershed has illuminated how this unique landscape was formed and evolved over the Late Quaternary. Gaining a better understanding of the watershed’s
history, especially the stages of sediment deposition/erosion and the development of the stream channels, provides valuable context for developing management plans that focus on reducing sediment and nutrient delivery to Storm Lake today. Indeed, while post-settlement agricultural practices have changed and imprinted new water and sediment transport pathways in the watershed, the foundational properties of the watershed remain intact. The Surficial Geologic Map of the Outlet Creek (HUC 12) Watershed (cover image of Geode) provides a solid foundation for improving watershed models and developing conservation solutions that aim to slow the movement of water, and consequently sediment and nutrients, to Storm Lake. Furthermore, reframing our questions by mapping using watershed boundaries to investigate landscape-wide questions has applicability throughout the state of Iowa.
Kerr, P., 2022. Surficial Geologic Map of the Outlet Creek (HUC 12) Watershed, Buena Vista County, Iowa: Iowa Geological Survey, Open File Map OFM-22-9, 1:24,000 scale map sheet.
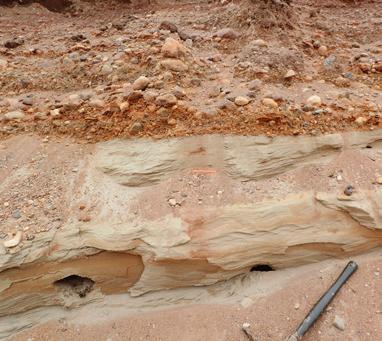
FIGURE 3. Thick packages of coarse sand and gravel, called outwash, are found in drainages that carried glacial meltwater. The orange pen shown is 5 inches in length.
LIVESTOCK ARE A critical agricultural commodity in the Midwestern United States and are directly linked to row crop production. Modern livestock production systems have moved largely from landscape-scale forage systems to confinement-style operations thereby concentrating livestock and the manure that they produce. Row crop production required to produce feed and fuel (ethanol) in Iowa requires chemical and manure nutrient application which has resulted in significant losses of nitrogen (N) and phosphorus (P) to downstream ecosystems causing environmental crises, like seasonal hypoxia, in the Gulf of Mexico. Use of cattle manure has been shown to have multiple benefits over commercial fertilizer, including increased soil carbon levels and improved nutrient cycling, and should be considered a critical component for future agricultural production in Iowa.
In 2020, the IGS sought to continue their collaboration with Kirkwood Community College in Cedar Rapids, Iowa by working together on a project funded by the Iowa Department of Agriculture and Land Stewardship (IDALS) to consider the effects of geologic parent materials and farm management decisions on shallow groundwater. The IGS conducted an extensive geophysical conductivity survey of the field and installed shallow groundwater monitoring wells to better understand the lithology and assess water quality conditions. The conductivity survey showed a dominating change in the field’s parent material from fine-grained glacial till-derived sediment at the summits to coarse-grained colluvium and alluvium near the stream which bisects the field (Figure 1).
We found that soil parent material was the dominant influence on groundwater quality with NO3-N, Cl, groundwater depth pH, and specific conductance all significantly affected. While crop type had minimal influence on groundwater quality,

fertilizer applications from commercial fertilizer and cattle manure had significant effects on nutrient concentrations. NO3-N was significantly higher in manure areas and dissolved P was higher in nonmanure areas. The significance in NO3-N concentrations was likely due to the additional 70 kg/ha of N applied to the manure areas of the study site. Overall,
FIGURE 1.
The inset map (top right) depicts the location of Kirkwood Community College in Cedar Rapids, Linn County, Iowa. The larger map shows each quadrant of the field study site (manure versus non-manure), locations of the monitoring wells and cattle feedlot, electromagnetic (EM) conductivity geophysical survey results, and parent materials (glacial till or colluvium and alluvium).
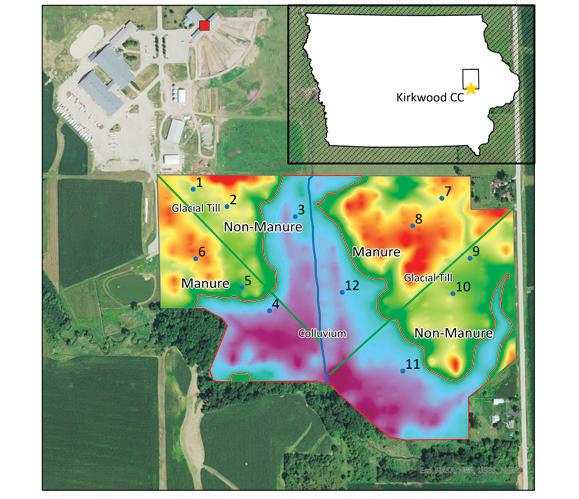
FIGURE 2.
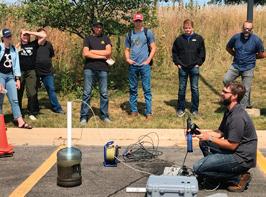
IGS Soil Scientist, Matthew Streeter, explaining the process of groundwater sampling to Kirkwood Community College students.
our results stress the importance of appropriate nutrient application rates over nutrient source.
At the completion of the project, the IGS hosted a field day at the Kirkwood Campus with Kirkwood and Iowa State University during which project results were shared with several different Kirkwood classes and over 40 students (Figure 2).

THE IOWA DEPARTMENT of Natural Resources (Iowa DNR), in collaboration with the Iowa Geological Survey (IGS), the Iowa Department of Agriculture and Land Stewardship (IDALS), the U.S. Geological Survey (USGS), and the Iowa Homeland Security and Emergency Management Division (HSEMD), publishes a monthly Water Summary Update, which is an overview of the status of Iowa’s water resources, trends, and events affecting water supplies.
The IGS contributes the shallow aquifer groundwater component of the Water Summary Update. The state does not yet have a comprehensive shallow groundwater monitoring network, but in lieu of a formal network, the base flow component of total flow in rivers is used as a proxy indicator of groundwater conditions during a drought. Two primary sources are reviewed to infer how a climatic drought may be impacting groundwater levels in the shallow alluvial aquifers of Iowa, the USGS’s WaterWatch and Groundwater Watch sites.
1.
First, WaterWatch has a drought statistic based on the “28-day average streamflow” which depicts the gauged locations across the state that are below normal flow conditions. Specifically, the current conditions are compared to percentiles of historical, below normal, 28-day-average streamflow for that day of the year. The 28-day period is important because it reveals longer-term trends in river levels to which hydraulically connected aquifer levels similarly rise or fall, albeit typically in a time-delayed and subdued response. When harsh climatic drought conditions persist, river flows decline, first to “below normal” (10th –24th percentile) and then to “moderate hydrologic drought” (6th – 9th percentile). Flows are increasingly sustained by base flow which is the component of total flow that is derived from the movement of groundwater from an adjacent aquifer into the river. Extended dry conditions cause groundwater levels in shallow alluvial aquifers to decline, potentially limiting the yield of an aquifer and/or the operating capabilities of local production wells (i.e., less available drawdown, lower pumping rate). Such conditions are predictable by looking at the 28-day-period record.
Second, Groundwater Watch exhibits a very limited number of drought wells across the state whose water levels are classified as below normal based on water level percentile groupings, where “below normal” is within the 10 th – 24 th percentile class and “much below normal” is the <10 th percentile class. As a general note, Groundwater Watch is currently offline for upgrades.

Once the below normal 28-dayaverage streamflow conditions and the below normal drought wells are distinguished, these data are then color coded and plotted such that specific droughtimpacted watersheds are identified. Then a brief narrative is generated discussing the shallow groundwater and aquifer conditions of the state. The results are then shared with the Iowa DNR for inclusion in the monthly Water Summary Update (Figure 1).
Activities of the Iowa Geological Survey,

Extending in a narrow band adjacent to the Missouri River, the Loess Hills are one of the most unique landform regions in Iowa. Characterized by a dense drainage network and steep-sided valleys, streams have carved an intricate pattern on the landscape that provide picturesque views of the region. The Loess Hills are home to three state parks (Stone, Preparation Canyon, and Waubonsie) as well as numerous state forests, preserves, and recreation areas. Here we highlight the Loess Hills State Forest, due to its proximity to the town of Pisgah, whose name is used for a significant loess stratigraphic unit in Iowa.
The Loess Hills of western Iowa stand out as a unique landform region when compared with the rest of the state.
The Loess Hills State Forest was established in 1985, making it Iowa’s newest publicly owned forest. Located in western Iowa near the Harrison and Monona county line, this public area spans more than 11,000 acres and includes four regional land units: Preparation Canyon, Little Sioux, Pisgah, and Mondamin. Recreational opportunities within this state forest area include camping, hiking, and hunting.
The Loess Hills of western Iowa stand out as a unique landform region when compared with the rest of the state. The hills are made of loose, flour-sized (silt) grains, yet have steep-sided exposures that tower above the nearby Missouri River Valley (Figure 1). These features help tell the story of how this landscape was formed. Early researchers thought the loess deposits had a lacustrine (lake) origin. However, further study and the recognition of terrestrial fossil snails (Figure 2) in the sediment revealed that loess is in fact wind-blown silt. During the last glacial episode climatic conditions and river valleys fed by glacial meltwater and sediment created the perfect set of conditions for the formation of the Loess Hills. Glacial erosion generated abundant silt-sized particles which were then carried by meltwater streams in front of the ice margin and eventually deposited downstream in sediment-laden, braided
rivers. The silt in these outwash deposits was easily mobilized by wind during drier times. The Missouri River Valley was a major channel for these meltwater deposits, and its broad floodplain easily allowed wind to blow sediment out of the valley to be redeposited on the adjacent landscape. The loess deposition was quite remarkable down-wind of the valley and is more than 200 feet thick in some areas. If you live in or travel to this region of the state, note the exceptional views from the overlook near Moorhead (Figure 3).
FIGURE 1 (LEFT). Loess (wind-blown silt) has the unique property of maintaining its continuity when exposed in near vertical faces.

FIGURE 2 (BELOW, LEFT).
Terrestrial snail shells found in loess deposits helped early researchers to determine that loess was not a lacustrine (lake) deposit as previously thought.

FIGURE 3 (BELOW). The overlook at the Loess Hills State Forest provides picturesque views of the Loess Hills landform region.
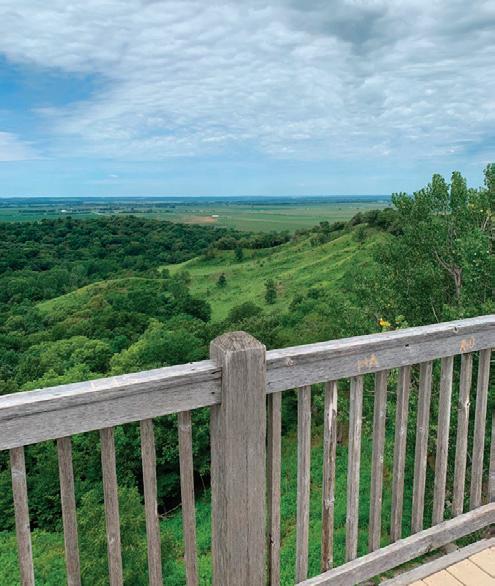
FIGURE 1.
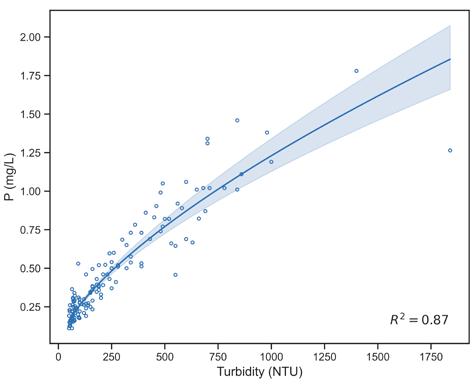
The phosphorus (P) versus turbidity model for the Skunk River at Augusta, Des Moines County, Iowa.
When trying to gauge the quality of surface water, one of the first things anyone does is make a general observation – how clear is the water? Water clarity is a relatively straightforward and intuitive concept that has been evaluated for decades. Darker, murkier water often indicates the presence of sediment, but it can also provide clues about potential contaminants that may be lurking. The IGS is taking this concept, water clarity, and using it to inform research on one of the most important constituents found in Iowa’s rivers –phosphorus (P). Iowa has a love-hate relationship with P, which is an essential element needed by all plants and animals to survive. Although P is naturally present in our soils and is a crucial ingredient in the fertilizer used to boost crop yields, when it enters various waterbodies, it becomes
a pollutant. More notably, P is primarily responsible for the chronic algal blooms that plague our state.
Many urban and rural Iowans have worked diligently to reduce the waterborne presence of P by improving wastewater treatment and implementing agricultural best management practices. Keeping P on farm fields and out of Iowa’s waters is a vital component of these practices. However, it is not easy to evaluate how well these efforts are truly working at a statewide level. Directly measuring P is challenging and expensive because samples must be collected onsite, brought to a lab, and analyzed via several chemical procedures. Historical and current P sampling of Iowa’s principal water bodies is done on an approximately monthly basis, but concentrations can change quite drastically over a short period of time. This means that delineating what, exactly, is happening to phosphorous during these expansive intervals between sample collection is extremely difficult. Ultimately, the data is not at a high enough resolution to accurately assess the presence of P or variations in its concentration. Conceptually, this would be similar to only measuring streamflow once a month. One monthly measurement of streamflow would not provide the requisite information necessary for characterizing the hydrologic behavior of that stream — consider the myriad flow events that occur over a month that would not be captured by a singular measurement. Therefore, streamflow is typically measured every 15 minutes. Unfortunately, measuring P at such a rate is just not practical, but this is where water clarity provides a solution to this impracticality.
Turbidity is how water clarity is measured quantitatively. A device called a turbidimeter emits a beam of light through
water and captures how much of this light is scattered by adjacent particles within the water. More light will scatter if the water is cloudy and filled with particles, so the cloudier the water, the higher the turbidity. Whereas P is difficult to measure directly, turbidity is relatively easy. A turbidimeter can comfortably produce turbidity values every 15 minutes. Utilizing Iowa’s historical P data, we have developed statistical models that can predict P levels of a site based on its coinciding turbidity (an example is shown in Figure 1). Thus, when the turbidity of a stream is measured, these models can then help estimate the corresponding P concentration in that stream.
These turbidity models now allow us to quantify P at a specific site more thoroughly, significantly reducing the uncertainties associated with sole reliance on monthly sampling. Using these models, we have been able to assess P levels throughout recent years and determine whether concentrations have changed over time. Such data help track the progress of various nutrient reduction strategies that have been implemented across Iowa. Recent efforts have focused on 16 sites along Iowa’s major rivers (Figure 2), and these sites are critical because they monitor water at the most downstream locations of these waterways before that water leaves the state. Quantification of P at these localities is especially important, as these sites, combined, encompass nearly the entirety of Iowa.
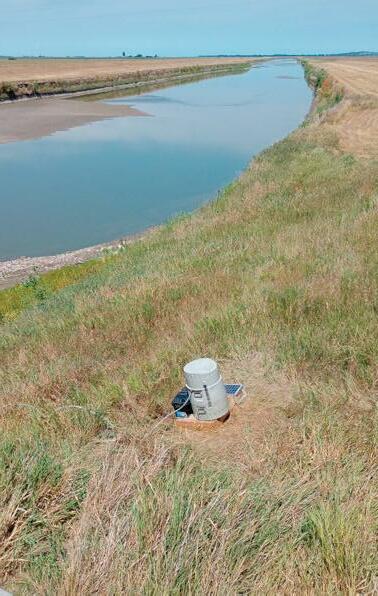
Along with University of Iowa IIHRHydroscience and Engineering staff, the IGS has deployed numerous turbidimeters throughout the state to better understand P patterns and trends within Iowa’s rivers. In many cases, we can further improve P models by incorporating seasonal and flowrelated factors along with turbidity data. The IGS has begun collecting new P data during periods of wet weather, and these devices have been installed at major rivers that can sample P automatically when flows are high (Figure 3). These new data will further improve the performance of these models and ensure that P estimates are as accurate as possible. Moving forward, we view these turbidity-based models as a key component in Iowa’s strategies to improve its water quality and inform policymakers. It seems the simple concept of water clarity has excellent potential to clarify Iowa’s complex relationship with P.
FIGURE 2 (ABOVE). The 16 major watersheds in Iowa and their most downstream monitoring locations (green circles).
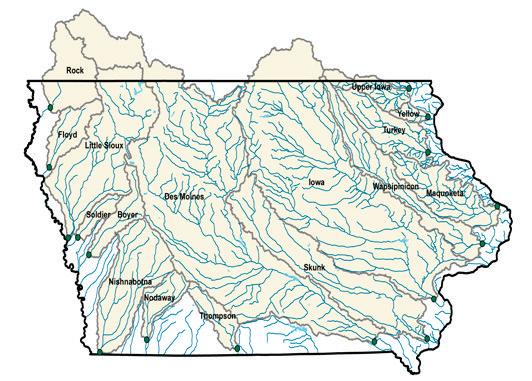
FIGURE 3 (LEFT). Phosphorus sampling equipment deployed along the Little Sioux River.
The 13th most abundant element in the Earth’s crust is fluorine, and the mineral fluoride occurs naturally in rocks. This mineral is important for overall human health because it reduces the prevalence and severity of tooth decay in adults and children. Fluoride is delivered in many forms, it is added to toothpastes and mouthwashes, consumed in small quantities in many foods and beverages, and supplemented in treated drinking water. Community water fluoridation has been implemented to improve human dental health in the United States since the mid-1900s, it is recommended by most public health advocacy groups, and it is widely recognized as the most efficient, equitable, and cost-effective method of delivering fluoride to the general population. Deficient fluoride concentrations can contribute to higher occurrence of tooth decay, however excess fluoride concentrations may cause irreversible dental or skeletal fluorosis and may also be linked to cancer and birth defects. The ideal range for fluoride concentrations in drinking water is narrow, and public health guidance recommends the concentration target of 0.7 mg/L
to maintain dental health benefits with minimal risk of fluorosis. The U.S. Environmental Protection Agency (EPA) has set a maximum contaminant level (MCL) of 4 mg/L for drinking water supplies with a secondary MCL (SMCL) of 2 mg/L.
Fluoride concentrations in natural waters range from 0.1 – 10 mg/L, but large variations exist due to factors such aquifer lithology, well depths, groundwater geochemistry, and anthropogenic sources. Some drinking water systems have naturally sufficient fluoride concentrations, while other systems have elevated fluoride concentrations and dilute with water from other sources. It is important for water suppliers and public health agencies to understand the base concentration of fluoride present in water sources so they can make informed decisions regarding fluoridation. Recent work conducted by the Iowa Geological Survey (IGS) and the University of Iowa Center for Health Effects of Environmental Contamination (CHEEC) characterized the occurrence and distribution of fluoride in Iowa’s groundwater.
The study compiled samples taken from municipal wells statewide from 1931 to 2017
as part of several national and statewide investigations and monitoring programs. Sample records were classified by aquifer age into seven groups: Alluvial, Quaternary, Cretaceous, Mississippian, Devonian, Silurian, and Cambrian-Ordovician (Table 1). Fluoride concentration values were averaged per well which provided 3,663 unique values across the state. Using the recommended concentration of 0.7 mg/L as a benchmark, values above are considered elevated for the purposes of this study. Fluoride values below this value are considered low and if used as source water, may require fluoridation. Values above the 2 mg/L and 4 mg/L EPA limits would be of particular concern due to the increased risk of fluorosis.
Fluoride concentrations from wells across the state ranged from 0.0 mg/L to 11.2 mg/L, with a median value of 0.35 mg/L and mean value of 0.62 mg/L. Broadly speaking, fluoride concentrations in Iowa groundwater are relatively low. However, in some aquifers there is a wide variation in fluoride concentrations, whereas in other aquifers the range in concentrations is quite narrow (Table 1). Approximately 75% of all wells are below the recommended fluoride level for public health (0.7 mg/L), while only 0.6% are above the MCL of 4 mg/L and 5% are above the SMCL of 2 mg/L.
Well sample data were also used to examine correlations between fluoride concentration and other key parameters. Pearson correlation tests indicated weak but statistically significant (p < 0.01) positive correlations between high fluoride concentration and deeper well depths, and higher potassium and sodium (r < 0.6). The positive correlation found between fluoride concentration and well depth may indicate that deeper groundwater is higher in fluoride due to presence of fluoride-bearing minerals, residence time, or increased fluorite solubility. Elevated fluoride levels found in Mississippian, Devonian, and Cambrian-Ordovician wells may be related to the presence of sandstones and carbonates in these aquifers. Some of the highest fluoride concentrations in Iowa groundwater are from wells within the Manson Impact Structure, and this is likely due to the dissolution of biotite (a fluoride-bearing mineral) and low calcium concentrations which can allow for elevated fluoride levels.
Iowa’s groundwater fluoride concentrations (Table 1 and Figure 1) are generally low, but median concentrations in some wells in the central and southwestern portions of the state are routinely above the U.S. Public Health Service recommendation of 0.7 mg/L of fluoride. In these areas removal of
fluoride is necessary to prevent fluorosis. However, most groundwater source waters in Iowa are consistently lower than the target fluoride concentration, and so, like most drinking water utilities in the United States, fluoridation is necessary to help prevent tooth decay.
MEAN WELL FLOURIDE CONCENTRATION ( mg /L)
FIGURE 1. Box plot of mean groundwater fluoride concentrations for municipal wells in major Iowa aquifers.
FLOURIDE CONCENTRATION BY AQUIFER
12.0 10.0 8.0 6.0 4.0 2.0 0.0
of the Iowa Geological Survey,
LAKE RED ROCK is a large flood-control reservoir located on the Des Moines River downstream of the City of Des Moines and it receives water, sediment, and nitratenitrogen (nitrate or NO3-N) loads from predominantly agricultural land in its 14,800 mi2 watershed. The Des Moines River exports significant nitrogen loads to the Mississippi River and contributes to Gulf of Mexico hypoxia. Downstream of the reservoir at Ottumwa, Iowa, drinking water pulled from the Des Moines River is impaired for nitrate.
In a new project funded by the Army Corps of Engineers (ACOE), the Iowa Geological Survey (IGS) is assessing the potential for management of Lake Red Rock hydrology to achieve downstream nitrate concentration reductions. The project has several elements and is being completed in multiple phases. The initial work by the IGS has been focused on: 1) evaluating historical water quality data from the reservoir; 2) characterizing the spatial extent of delta sedimentation; and 3) collecting and analyzing soil cores taken from the delta sediment. This initial phase of the investigation is being supplemented by collaborative work to quantify nitrate loss rates in delta sediments and is led by Iowa State University.
FIGURE 1.
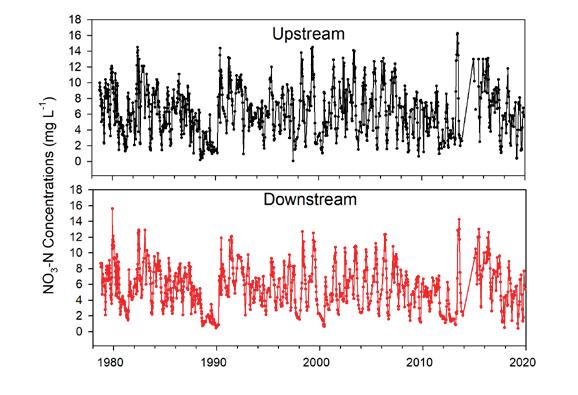
Nitrate-nitrogen (NO3-N) concentrations measured upstream and downstream of Lake Red Rock. Upstream concentrations averaged 6.35 mg/L upstream of the reservoir and 5.74 mg/L downstream.
FIGURE 2.
From left-to-right –Matthew Streeter, State Geologist Keith Schilling, and Tom Stoeffler of the IGS collecting sediment samples from the Lake Red Rock delta.
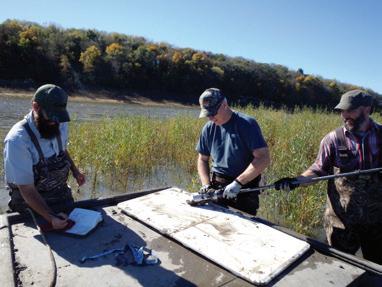
Photo credit and boat driver – Todd Gosselink, Iowa DNR.
To assess the historical nitrate load reductions in Lake Red Rock, we have used rare long-term upstream and downstream monitoring records that extend back in time 42 years (Figure 1). Combined with estimates from tributary inputs, we estimate that Lake Red Rock reservoir has reduced input nitrate loads by an average of 12.4%. Annual variations in nitrate loss rate were found to vary considerably (-2.9% to 41.3%) based on annual reservoir water retention time. Although flood-control reservoirs are designed primarily for flood protection, manipulating the reservoirs to achieve longer water retention times, particularly during periods of high NO3-N concentrations and loads, could be a strategy for alleviating impairments in downstream water supplies.
We are assessing the delta sediments in Lake Red Rock by combining an extensive soil sampling campaign with aerial photograph analysis. During the autumn of 2021, we collected soil samples from more than 50 sites in the delta using a variety of sampling methods (Figure 2). The samples are being processed in the IGS Sediment Laboratory for texture, bulk density, and nutrient contents. The analysis of aerial photographs is focused on quantifying the amount of delta inundation that has occurred at different water level stages in the reservoir. While the data for the second phase of the Lake Red Rock study are still being compiled and analyzed, results gathered so far are very compelling and will be shared in next year’s issue of The IGS Geode. Stay tuned!
THE IOWA GEOLOGICAL SURVEY (IGS) has a long history of collaboration with the Department of Earth and Environmental Sciences (EES), formerly the Department of Geology, at the University of Iowa. A key component of this relationship is the training and employment of students, both undergraduates and graduates. Students are hired under various IGS grants and contracts (e.g., the United States Geological Survey’s STATEMAP, Earth MRI, and National Geological and Geophysical Data Preservation programs). A recent threeyear National Science Foundation (NSF) Improving Undergraduate STEM Education (IUSE) grant (Iowa Environmental Internship Pathways Program) received by EES faculty and IGS staff also provides funding for five undergraduate student summer internships. These opportunities allow the IGS to integrate students into our ongoing initiatives, to the benefit of all involved (Figures 1 and 2). Students have the chance to apply their prior knowledge and their own life experiences to real-world geoscience projects while also gaining valuable skills that will allow them to enhance their understanding of the world around them. Most recently, IGS interns have assisted with describing and logging cutting samples, bedrock and unconsolidated core sampling for a variety of laboratory analyses, collecting horizontal-to-vertical spectral ratio (HVSR) passive seismic geophysics data, field reconnaissance to investigate bedrock and Quaternary exposures, and working with an assortment of GIS data sets. Furthermore, IGS staff also actively participate in the EES curriculum. Some staff help teach courses and/or provide hands-on, in-class demonstrations about core description and geophysical data collection. IGS staff also help with educational field excursions around Iowa that encompass a variety of practical science issues such as soil health, surface and subsurface hydrogeology, and geologic mapping.
This close association with EES not only allows the IGS to play a role in helping to train the next generation of geoscientists, but it also advances our overall understanding of Iowa’s geologic history. Some EES students completing their undergraduate and graduate theses focus on regional geologic questions. IGS staff assist these students with their research endeavors by helping them identify relevant core in the IGS Core Repository (University of Iowa Oakdale Campus) and field locations that they can use to further their investigations. IGS geologists are able to provide valuable knowledge and background information for more Iowa-centric projects that they would not otherwise gain from faculty that are not as familiar with Iowa’s geology. More importantly, such projects complement one of the primary tenets of the IGS’ mission — to provide knowledge necessary to effectively manage the state’s natural resources for long-term sustainability and economic development.
FIGURE 1. IGS intern and EES undergraduate student, Brennan Hill, using the TROMINO® to collect horizontalto-vertical spectral ratio (HVSR) passive seismic geophysics data in Lee County, Iowa – a local dog came to visit while data was being recorded. These data were used in the IGS’ USGS STATEMAP project to map the bedrock and surficial geology of the county.
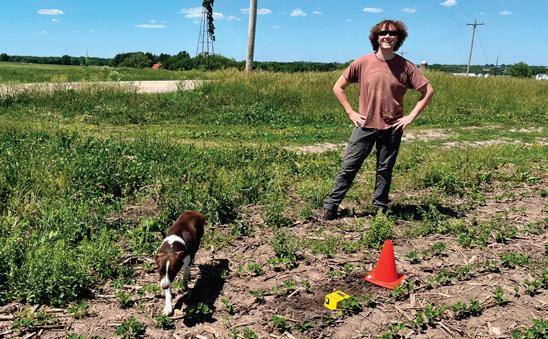
FIGURE 2. From left-to-right – IGS interns (and EES graduate and undergraduate students) Cameron Parrelly, Nathan Platt, and Brennan Hill with Ryan Clark (IGS geologist) collecting chronostratigraphic samples in the Nelson Quarry (owned by Cessford Construction Company), Des Moines County, Iowa. This sampling campaign is part of the IGS’ USGS STATEMAP project focused on geologic mapping in southeastern Iowa.

Ayers, J.R., G. Villarini, K.E. Schilling, C. Jones, A. Brookfield, S.C. Zipper, and W.H. Farmer, 2022. “The Role of Climate in Monthly Baseflow Changes Across the Continental United States,” Journal of Hydrologic Engineering, 27:1-13.
Bancroft, A.M. and P. Kerr, 2022. Bedrock Elevation and Quaternary Thickness Maps of the Muscatine 7.5’ Quadrangle, Muscatine County, Iowa and Rock Island County, Illinois: Iowa Geological Survey, Open File Map OFM-22-5, 1:24,000 scale map sheet.
Bancroft, A.M. and P. Kerr, 2022. Bedrock Elevation and Quaternary Thickness Maps of the Illinois City 7.5’ Quadrangle, Muscatine County, Iowa and Rock Island County, Illinois: Iowa Geological Survey, Open File Map OFM-22-7, 1:24,000 scale map sheet.
Bancroft, A.M., P. Kerr, and R.J. Clark, 2022. Bedrock Geologic Map of the Muscatine 7.5’ Quadrangle, Muscatine County, Iowa and Rock Island County, Illinois: Iowa Geological Survey, Open File Map OFM-22-4, 1:24,000 scale map sheet.
Bancroft, A.M., P. Kerr, and R.J. Clark, 2022. Bedrock Geologic Map of the Illinois City 7.5’ Quadrangle, Muscatine County, Iowa and Rock Island County, Illinois: Iowa Geological Survey, Open File Map OFM-22-6, 1:24,000 scale map sheet.
Biebesheimer, E.J., B.D. Cramer, M. Calner, B.A. Barnett, S.C. Oborny, and A.M. Bancroft, 2021. “Asynchronous δ13Ccarb and δ13C org Records During the Onset of the Mulde (Silurian) Positive Carbon Isotope Excursion from the Altajme Core, Gotland, Sweden,” Chemical Geology, 576:120256.
Brennan, G., P. Kerr, and S.A. Tassier-Surine, 2022. SilurianDevonian Aquifer Vulnerability Map, Benton County, Iowa: Iowa Geological Survey, Open File Map OFM-22-10, 1:100,000 scale map sheet.
Brighenti, T.M., P.W. Gassman, K.E. Schilling, R. Srinivasan, M. Liebman, and J.R. Thompson, 2022. “Determination of Accurate Baseline Representation for Three Central Iowa Watersheds within a HAWQSbased SWAT Analyses,” Science of the Total Environment, 839:156302.
Clark, R.J. and P. Kerr, 2022. Bedrock Elevation and Quaternary Thickness Maps of Lee County, Iowa: Iowa Geological Survey, Open File Map OFM-22-3, 1:100,000 scale map sheet.
Clark, R.J., S.A. Tassier-Surine, P. Kerr, and A.M. Bancroft, 2022. Bedrock Geologic Map of Lee County, Iowa: Iowa Geological Survey, Open File Map OFM-22-1, 1:100,000 scale map sheet.
Hartke, E.R., B.D. Cramer, M. Calner, M.J. Melchin, B.A. Barnett, S.C. Oborny, and A.M. Bancroft, 2021. “Decoupling δ13Ccarb and δ13C org at the Onset of the Ireviken Carbon Isotope Excursion: Δ13C and Organic Carbon Burial (forg) During a Silurian Oceanic Anoxic Event,” Global and Planetary Change, 196:103373.
Kerr, P., 2022. Surficial Geologic Map of the Outlet Creek (HUC 12) Watershed, Buena Vista County, Iowa: Iowa Geological Survey, Open File Map OFM-22-9, 1:24,000 scale map sheet.
Kerr, P., S.A. Tassier-Surine, and A.M. Bancroft, 2022. Surficial Geologic Map of the Wilton 7.5’ Quadrangle, Muscatine and Cedar Counties Iowa: Iowa Geological Survey, Open File Map OFM-22-8, 1:24,000 scale map sheet.
Robinson, T.C., D.E. Latta, L. Notini, K.E. Schilling, and M.M. Scherer, 2021. “Abiotic Reduction of Nitrite by Fe(II): A Comparison of Rates and N2O Production,” Environmental Science Processes and Impacts 23(10):1531-1541.
Schilling, K.E. and M.T. Streeter, 2022. “Paired Riparian Water Table Monitoring to Quantify Hydraulic Loading to a Saturated Buffer,” Environmental Monitoring and Assessment, 194(7):1-7.
Schilling, K.E., T.M. Isenhart, C.F. Wolter, M.T. Streeter, and J.L. Kovar, 2022. “Contribution of Streambanks to Phosphorus Export from Iowa,” Journal of Soil and Water Conservation, 77(2):103-112.
Schilling, K.E., M.T. Streeter, S. Pierce, G. Brennan, and M.S. Clair, 2022. “Subsurface Nitrate Processing Beneath Drainageways: Are They Landscape Opportunities for Subsurface Drainage Remediation?” Journal of the ASABE, 65(5):985-995.
Shohel, M., K.K. Ray, A.V. Tivanski, N.E.B. McAdams, A.M. Bancroft, B.D. Cramer, and T.Z. Forbes, 2022. “Nanomechanical Variability in the Early Evolution of Vertebrate Dentition,” Scientific Reports, 12:10203.
Streeter, M.T. and K.E. Schilling, 2021. “Quantifying the Effectiveness of a Saturated Buffer to Reduce Tile NO3-N Concentrations in Eastern Iowa,” Environmental Monitoring and Assessment, 193:500.
Streeter, M.T., J. Vogelgesang, K.E. Schilling, and C.L. Burras, 2022. “Use of High-Resolution Ground Conductivity Measurements for Denitrifying Conservation Practice Placement,” Environmental Monitoring and Assessment, 194(10):1-14.
Tassier-Surine, S.A., R.J. Clark, P. Kerr, and A.M. Bancroft, 2022. Surficial Geologic Map of Lee County, Iowa: Iowa Geological Survey, Open File Map OFM-22-2, 1:100,000 scale map sheet.
Thomas, N.W., T.B. Ayalew, A.A. Renas, K.E. Schilling, L.J. Weber, and W.F. Krajewski, 2021. “Characterizing the Effect of Dry Antecedent Soil Moisture Conditions, Channel Transmission Losses, and Variable Precipitation on Peak Flow Scaling,” Advances in Water Resources, 158:104061.
Wolter, C.F., K.E. Schilling, and J.A. Palmer, 2021. “Quantifying the Extent of Eroding Streambanks in Iowa,” Journal of the American Water Resources Association, 57(3):391-405.
Zhang, J., C. Lu, W. Crumpton, C. Jones, H. Tian, G. Villarini, Schilling, K.E., and D. Green, 2022. “Heavy Precipitation Impacts on Nitrogen Loading to the Gulf of Mexico in the 21st Century: Model Projections Under Future Climate Scenarios,” Earth’s Future, 10:e2021EF002141.
Schilling, K.E., “Groundwater Use and Sustainability in Iowa,” Department of Environmental Studies Seminar, Cornell College, September 2, 2021.
Vogelgesang, J.A., “Virtual ER Training Session 6: Eddyville Case Study Southbound Data Processing,” Iowa Department of Transportation, September 16, 2021.
Vogelgesang, J.A., “Virtual ER Training Session 7: Eddyville Case Study Northbound Data Processing,” Iowa Department of Transportation, September 21, 2021.
Vogelgesang, J.A., “Virtual ER Training Session 8: Eddyville Case Study Mine Hazard Interpretations,” Iowa Department of Transportation, September 23, 2021.
Kerr, P., “Preservation of Form: The Longevity of Glacial Influence on Drainage Patterns,” Geological Society of America, Portland, Oregon, October 10, 2021.
Kerr, P., D. Bloch, and C.J. Kohrt, “A Sand Dune Inventory and Topographical Analysis on the Iowan Erosion Surface,” Geological Society of America, Portland, Oregon, October 11, 2021.
Schilling, K.E., “Iowa’s Groundwater Quantify Challenges in the 21st Century,” Iowa Watershed Planning and Advisory Council, October 18, 2021.
Schilling, K.E. and M.T. Streeter, “Quantifying the Effectiveness of a Saturated Buffer to Reduce Tile NO3-N Concentrations in Eastern Iowa,” Soil Science Society of America, November 8, 2021.
Schilling, K.E., M. Muste, and A. Arenas-Amado, “Evaluating a TwoStage Roadside Ditch to Improve Environmental Performance,” Soil Science Society of America, Salt Lake City, Utah, November 8, 2021.
Streeter, M.T. and K.E. Schilling, “Erosion and Sediment Delivery in Iowa,” Soil Science Society of America, Salt Lake City, Utah, November 10, 2021.
Kerr, P., “The Formation of the Iowan Erosion Surface: Landscape and Consequences,” Department of Earth and Environmental Sciences Seminar, University of Northern Iowa, November 15, 2021.
Streeter, M.T. and K.E. Schilling, “Saturated Buffer and Alternative Tile Intake Field Day,” Walcott, Iowa, November 17, 2021.
Vogelgesang, J.A., “Introduction to Near-Surface Geophysical Methods,” Applied Environmental Sciences Course, Department of Earth and Environmental Sciences, University of Iowa, November 30, 2021.
Schilling, K.E., “Future Groundwater Quantity Issues in Iowa,” Iowa Water Well Association, January 27, 2022.
Schilling, K.E., “Future Groundwater Quantity Issues in Iowa,” Department of Earth and Environmental Sciences Seminar, University of Iowa, March 25, 2022.
Clark, R.J., “Searching for Critical Minerals in Iowa and Beyond,” Cedar Valley Rocks and Minerals Society, March 26, 2022.
Schilling, K.E., S.A. Tassier-Surine, P. Kerr, A.M. Bancroft, and G. Brennan, “Geologic Mapping and More,” IGS Muscatine County Outreach Event, March 29, 2022.
Clark, R.J., “Filling in the Gaps: Using Passive Seismic for Bedrock Topographic Control in Iowa, U.S.A.,” Geological Society of America Joint North-Central and Southeastern Section Meeting, Cincinnati, Ohio, April 7, 2022.
Activities of the Iowa Geological Survey, 2021–22
Schilling, K.E., “Contribution of Streambanks to Phosphorus Export in Iowa,” Iowa Learning Farms Webinar, April 20, 2022 (watch: https://www.iowalearningfarms.org/ resources/webinar-keith-schilling).
Tassier-Surine, S.A., “Sinkhole Mapping in a Multi-County Area of North-Central Iowa,” Minnesota Groundwater Association, April 28, 2022.
Clark, R.J., “The Effects of Carbon Sequestration in Iowa,” Iowa Groundwater Association, April 29, 2022.
Tiedje, J., X. Xun, J. Quensen, C. O’Connor, M. Grinshpun, Q. Pare, M.T. Streeter, and M. Thompson, “Novel Deep Microbiome Underfoot,” American Society of Microbiology, Washington, D.C., June 9-13, 2022.
Kerr, P., “A Late Wisconsin Polygenetic Landscape: Connecting Landforms on the Iowan Erosion Surface to Past Processes with Lidar and Field Data,” American Quaternary Association, Madison, Wisconsin, June 6, 2022.
Tassier-Surine, S.A., “North-Central Iowa Karst Susceptibility and Sinkhole Mapping,” Monroe County Climate Change Task Force, June 29, 2022.
A Vision Toward a More Resilient Iowa Great Lakes: Keith Schilling: Iowa Department of Natural Resources (Iowa DNR)
Advanced Modeling of Soil Erosion, Sediment Delivery, and Nutrient Export from Iowa Watersheds: Matthew Streeter: Iowa Nutrient Research Center (INRC)
Critical Minerals in Coaly Strata of the Cherokee-Forest City Basin: Ryan Clark: U.S. Department of Energy (DOE)
Developing Design Criteria to Test a New Saturated Waterway Conservation Practice: Keith Schilling: Iowa Nutrient Research Center (INRC)
#DiverseCornBelt: Resilient Intensification Through Diversity in Midwestern Agriculture: Keith Schilling: U.S. Department of Agriculture (USDA)
Drinking Water Protection: Greg Brennan: Iowa Water Quality Consulting
Earth Mapping Resources Initiative (Earth MRI): Geochemistry Reconnaissance Project for Ordovician Phosphate Sediments of the Midcontinent: Ryan Clark: U.S. Geological Survey (USGS)
Evaluating a Two-Stage Roadside Ditch Design to Improve Environmental Performance: Keith Schilling: Iowa Department of Transportation (Iowa DOT)
Evaluating the Combined Effects of N Application with and without Manure on Groundwater Quality using a Paired Field Design at the Kirkwood Community College Farm: Keith Schilling: Iowa Department of Agriculture and Land Stewardship (IDALS)
Evaluating the Nutrient Reduction Benefits of Farm Ponds: Keith Schilling: Iowa Nutrient Research Center (INRC)
Evaluating the Relation of Total Phosphorus to Turbidity During High Flow Events to Improve Quantification of Phosphorus Export from Iowa Rivers: Keith Schilling: Iowa Nutrient Research Center (INRC)
Geologic Mapping in Iowa FY2021 – Including Subprojects in Lee, Muscatine, Buena Vista, and Benton Counties: Stephanie Tassier-Surine: U.S. Geological Survey (USGS)
Geophysical and Evaluation Services Near Eddyville, Iowa: Jason Vogelgesang: Iowa Department of Transportation (Iowa DOT)
Geophysical and Geologic Services to Delineate Bedrock Surface for Engineering Consulting Company: Jason Vogelgesang
Geophysical Exploration Near Fernow Road, Marion, Iowa: Jason Vogelgesang: City of Marion, Iowa
Geophysical Imaging Services at the Marshalltown Well Field: Jason Vogelgesang: Leonard Rice Engineers (LRE), Inc.
Illinois Basin CORE-CM: Ryan Clark: U.S. Department of Energy (DOE)
Iowa Environmental Internship Pathways Program: Stephanie Tassier-Surine: National Science Foundation (NSF) Improving Undergraduate STEM Education (IUSE)
Monitoring Services at the NNG Redfield Facility: Jason Vogelgesang: Northern Natural Gas
Natural Infrastructure Water Quality and Flood Reduction Benefits: Keith Schilling: Environmental Defense Fund (EDF)
Nitrate Reduction via Reservoir Water Level Management in Central Iowa: Keith Schilling: U.S. Army Corps of Engineers (DOD)
Pennsylvanian Stratigraphic Nomenclature Reconciliation in the Midcontinent: Ryan Clark: U.S. Geological Survey (USGS)
Pilot Study for Oltman Quarry: Mike Gannon: BMC Aggregates L.C.
Regional Initiative to Accelerate CCUS Deployment in Midwestern and Northeastern USA: Ryan Clark: U.S. Department of Energy (DOE)
Soil and Plant Health Analyses: Matthew Streeter: Perimeter Solutions LP
FUNDING FOR THE Iowa Geological Survey (IGS) is provided through a combination of sources. A state appropriation, which has remained constant over the past few years, provides about 41% of our annual operating budget. The IGS leverages this base funding to obtain support for a diverse portfolio of projects from a variety of funding sources. In 2021–22, these sources included local municipalities and state agencies, the U.S. Geological Survey (USGS), the Iowa Department of Transportation (Iowa DOT), and the Iowa Nutrient Research Center (INRC), among others.
In addition to the state appropriation directed to the IGS, the University of Iowa’s Earth and Environmental Sciences (EES) Department allowed the IGS to leverage a portion of its own state appropriation in order to secure additional funding from the USGS. We sincerely appreciate the collaboration and the support of EES!
It is important to recognize that the annual state appropriation to the IGS has remained the same since the IGS transitioned to the University of Iowa in 2014. While we continue to seek outside funding, an increase in the IGS’ annual state appropriation would allow us to place more focus on regional statewide initiatives that help ensure sustainable water resources for Iowans and provide science-based information to support well drillers, government officials, and individuals. As always, the IGS is willing to collaborate with new and existing clients on exciting, impactful projects.
FY 2022 $1,715,862
Municipalities City Water Projects (1%)
State Appropriation Funded Through Iowa DNR prior to FY2019 (41%)
INRC Iowa Nutrient Research Center (4%)
Federal Agencies U.S. Geological Survey, Natural Resources Conservation Service, Environmental Protection Agency, U.S. Department of Energy (29%)
Other Non-Government Contracts, Iowa DNR, Iowa DOT, Iowa Department of Agriculture and Land Stewardship (25%)
Activities of the Iowa Geological Survey,
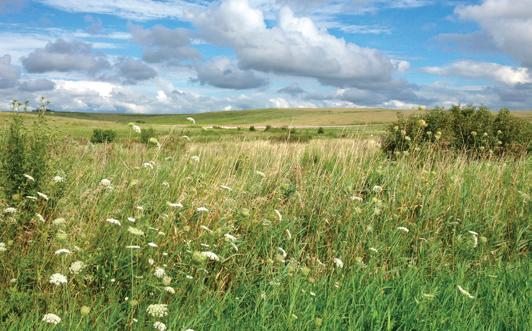
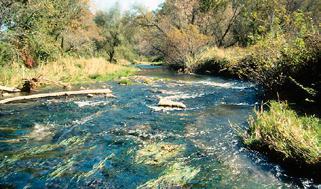
The Iowa Geological Survey has led two national 10-year duration, paired watershed monitoring projects (Figures 1–3). The Sny Magill/Bloody Run Watershed National Monitoring Project in Clayton County in northeast Iowa (conducted from 1991 to 2001) was focused on agricultural best management practice (BMP) adoption and its impact on water quality. The Walnut Creek Watershed National Monitoring Project was conducted in Jasper County from 1995 to 2005. The IGS monitored water quality as a large portion of the Walnut Creek Watershed was converted from row crop agriculture to native prairie by the U.S. Fish and Wildlife Service at the Neal Smith National Wildlife Refuge (NSNWR). Both projects achieved widespread recognition and pioneered a watershedscale approach to assessment and monitoring.
FIGURE 1 (TOP). Iowa State student, Billy Beck, collecting data in the channel of Walnut Creek, as part of the Walnut Creek project.

FIGURE 2 (MIDDLE). A scenic view of Neal Smith National Wildlife Refuge, the focus of the Walnut Creek project.
FIGURE 3 (BOTTOM). Downstream of Sny Magill Site 01, which was part of the Sny Magill project.