SINKHOLE AND KARST SUSCEPTIBILITY MAPPING IN NORTH-CENTRAL IOWA:
Using Geologic Maps to Inform by Stephanie Tassier-Surine, Phil Kerr, Ryan Clark, and Jason Vogelgesang
FIGURE 1. Updated karst susceptibility map for north-central Iowa. Red, yellow, and green colors on the map correspond with areas that have high, medium, and low susceptibility to form karst, respectively. Black dots represent the sinkholes that were identified during this study.
IOWA’S VARIED GEOLOGIC history has resulted in a range of potential hazards to public safety and infrastructure. One such hazard is the natural dissolution of near-surface carbonate bedrock (limestone and dolostone) that can lead to surface subsidence and the formation of sinkholes, caves, and disappearing streams, collectively known as karst. Sinkholes are especially problematic in karst terrain, as they can result in costly damage to roadways, retaining walls, and other structures. The Iowa Geological Survey (IGS) recently completed an extensive update to the sinkhole and karst susceptibility map for Worth, Cerro Gordo, Mitchell, and Floyd counties in north-central Iowa. Funding from the Iowa Department of Transportation (IDOT, project number HR-3018) made this project possible. The primary goals of the project included using updated maps and modern technology to identify sinkholes and depressions, as well as to update the karst susceptibility map of the four-county study area (Fig. 1). The original sinkhole data for Iowa
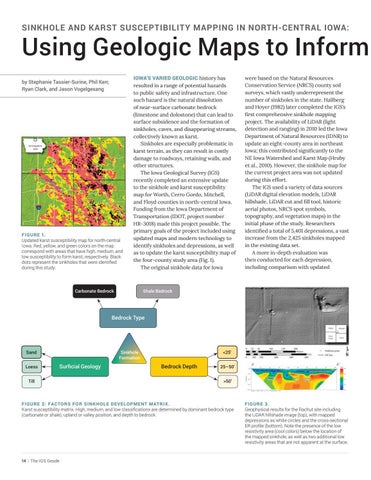
Carbonate Bedrock
were based on the Natural Resources Conservation Service (NRCS) county soil surveys, which vastly underrepresent the number of sinkholes in the state. Hallberg and Hoyer (1982) later completed the IGS’s first comprehensive sinkhole mapping project. The availability of LiDAR (light detection and ranging) in 2010 led the Iowa Department of Natural Resources (IDNR) to update an eight-county area in northeast Iowa; this contributed significantly to the NE Iowa Watershed and Karst Map (Hruby et al., 2010). However, the sinkhole map for the current project area was not updated during this effort. The IGS used a variety of data sources (LiDAR digital elevation models, LiDAR hillshade, LiDAR cut and fill tool, historic aerial photos, NRCS spot symbols, topography, and vegetation maps) in the initial phase of the study. Researchers identified a total of 5,401 depressions, a vast increase from the 2,425 sinkholes mapped in the existing data set. A more in-depth evaluation was then conducted for each depression, including comparison with updated
Shale Bedrock
Bedrock Type
Sinkhole Formation
Sand Loess
Surficial Geology
Till
<25'
Bedrock Depth
25–50’ >50’
FIGURE 2: FACTORS FOR SINKHOLE DEVELOPMENT M ATRI X. Karst susceptibility matrix. High, medium, and low classifications are determined by dominant bedrock type (carbonate or shale), upland or valley position, and depth to bedrock.
14 | The IGS Geode
FIGURE 3. Geophysical results for the Rachut site including the LiDAR hillshade image (top), with mapped depressions as white circles and the cross-sectional ER profile (bottom). Note the presence of the low resistivity area (cool colors) below the location of the mapped sinkhole, as well as two additional low resistivity areas that are not apparent at the surface.


