


May 2025


May 2025
Population in the Tyler MSA (2010 -2023)
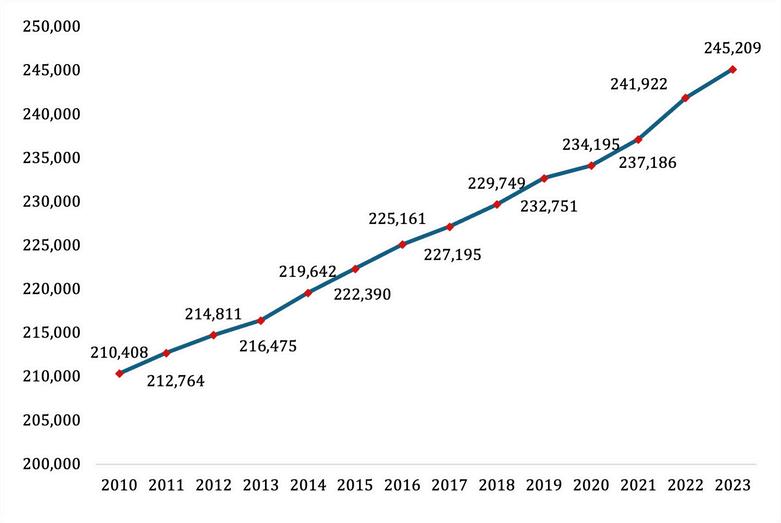

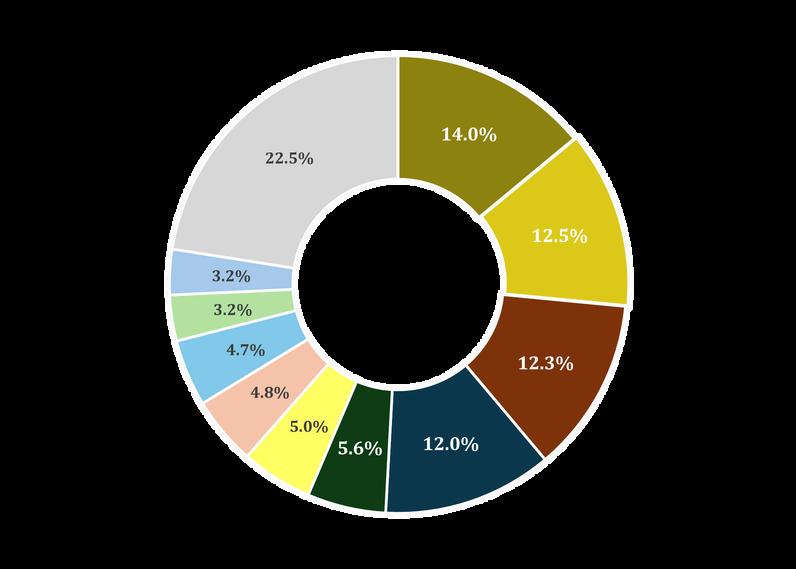
In 2023, the Tyler MSA’s population surpassed 245,000, with a median age that is one year younger than the national average.
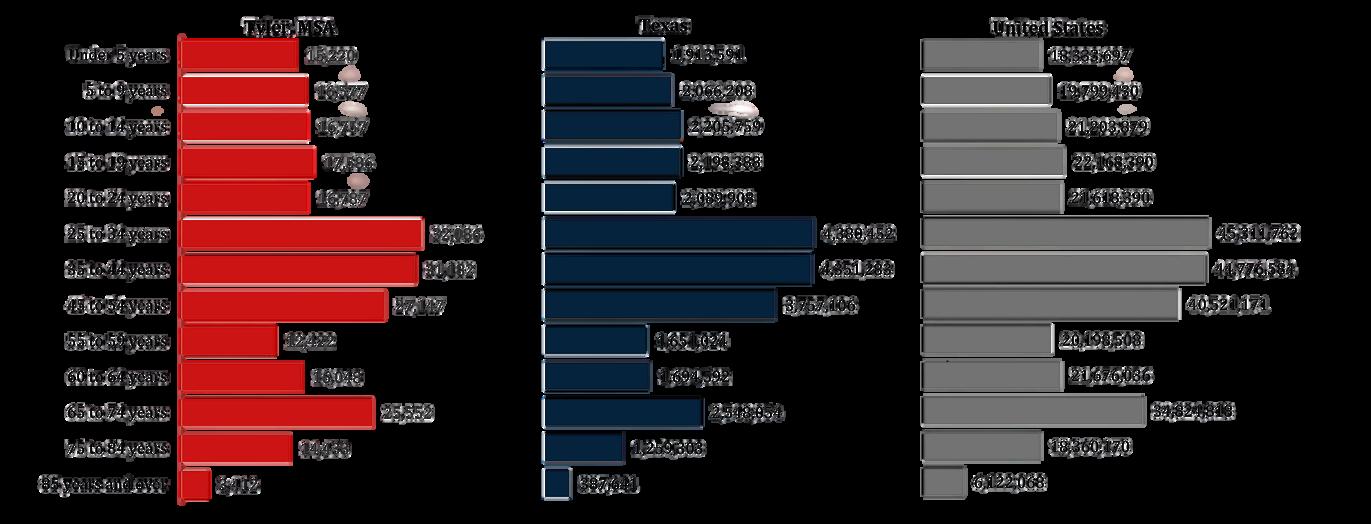
Population Distribution by Age (2023)
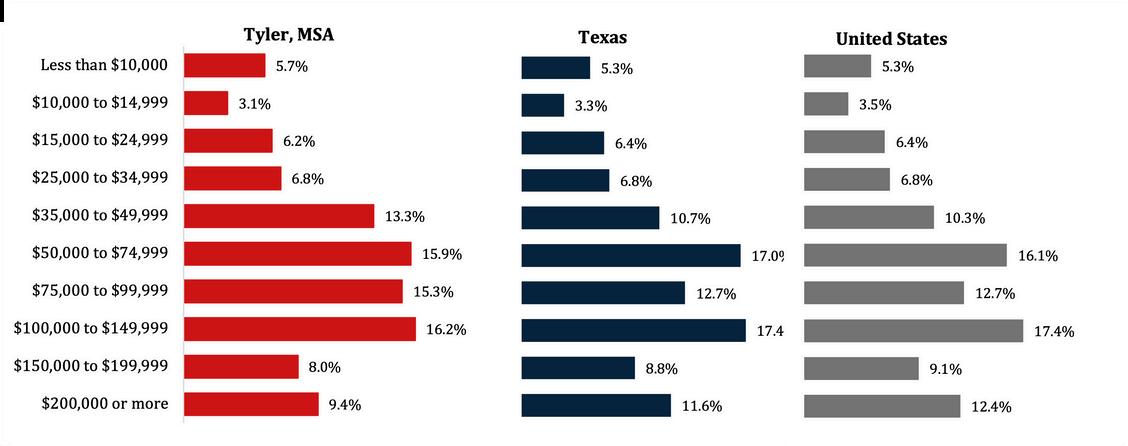
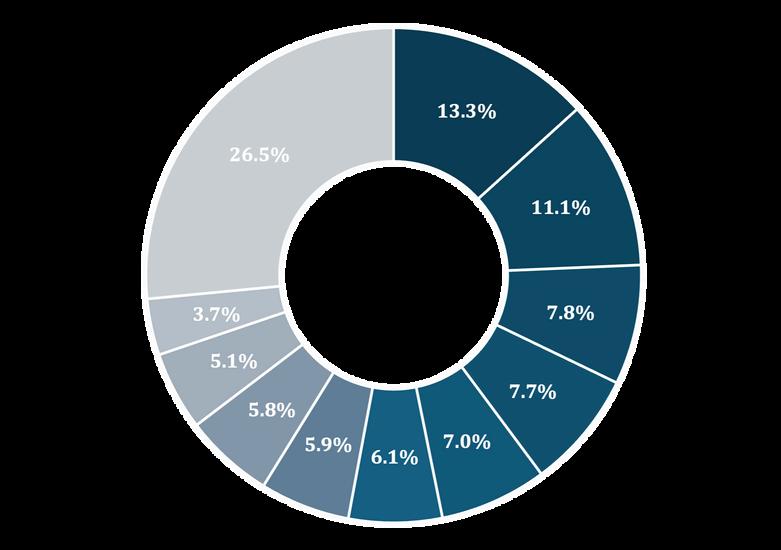
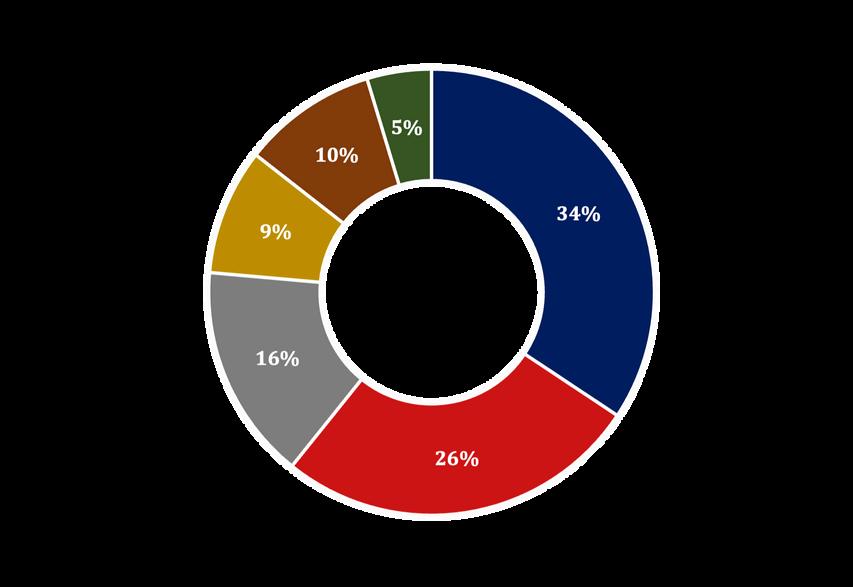
Distribution of Annualized Household Income (2023)
11,260,645
81,987 Households Households Households $69,810 $66,252 $66,887
131,332,360
The Tyler MSA has a greater proportion of households earning between $75K and $99K compared to both state and national averages, but a smaller share of households earning above $100K.
Per Capita Personal Income (2023)


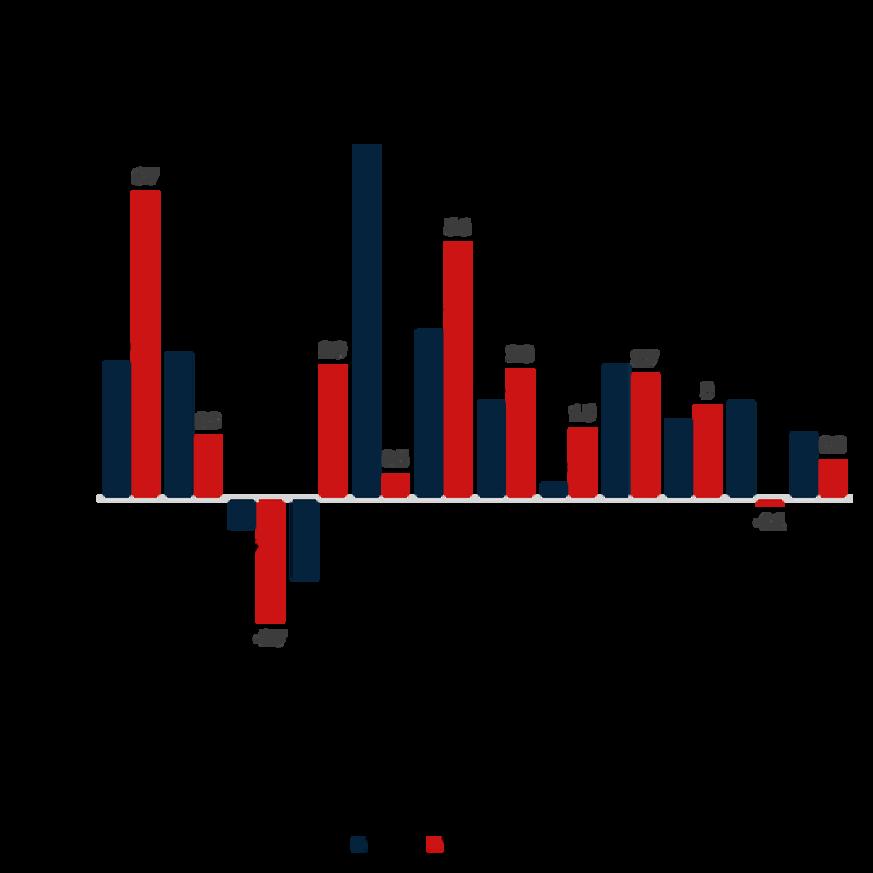
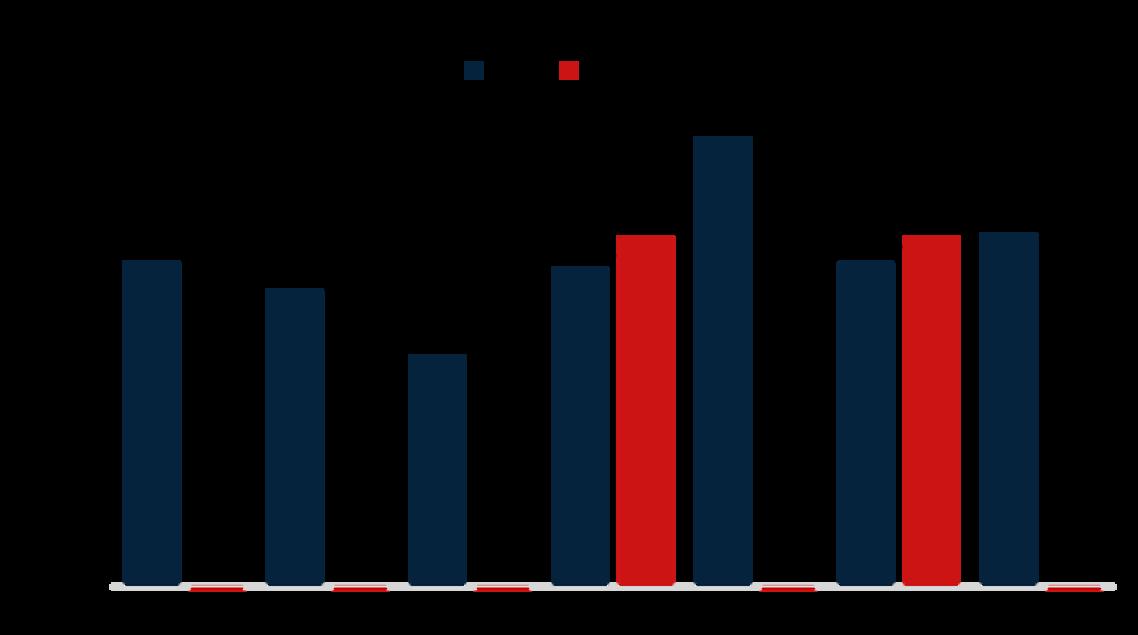
Real Gross Domestic Product (2023Q1 - 2025Q1)
Percentage change from preceding quarter
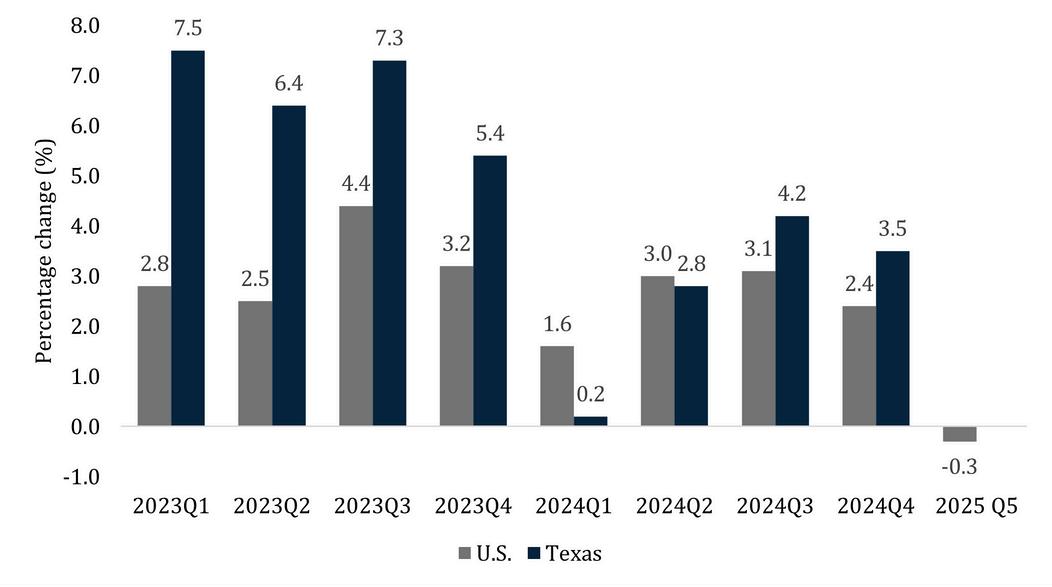
Source: U.S. Bureau of Economic Analysis
The Tyler MSA’s GDP grew by 4.2% in 2023 outpacing the national rate of 2.8%, but trailing Texas’s 7.4%, indicating a steady local expansion.
$12,494,743
TheGrossDomesticProduct(GDP) isameasureofthetotalvalueof goods and services produced in a country, state, or local economy. This measure excludes the intermediate goods and services usedintheproductionprocessto avoiddouble-countingGDPchanges are widely used to indicate the economichealthofanation
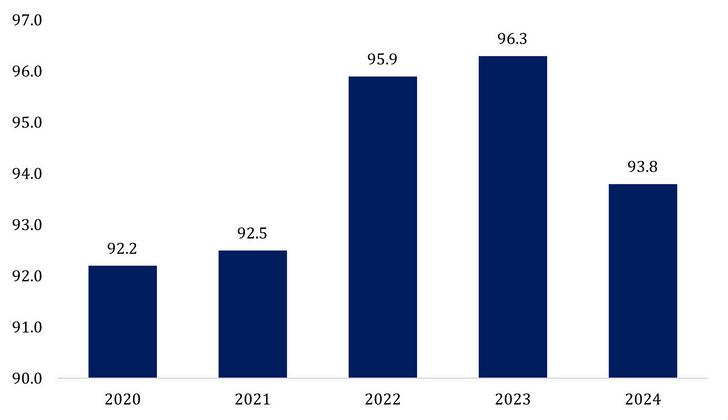
Cost of Living Index in the Tyler MSA
Source:
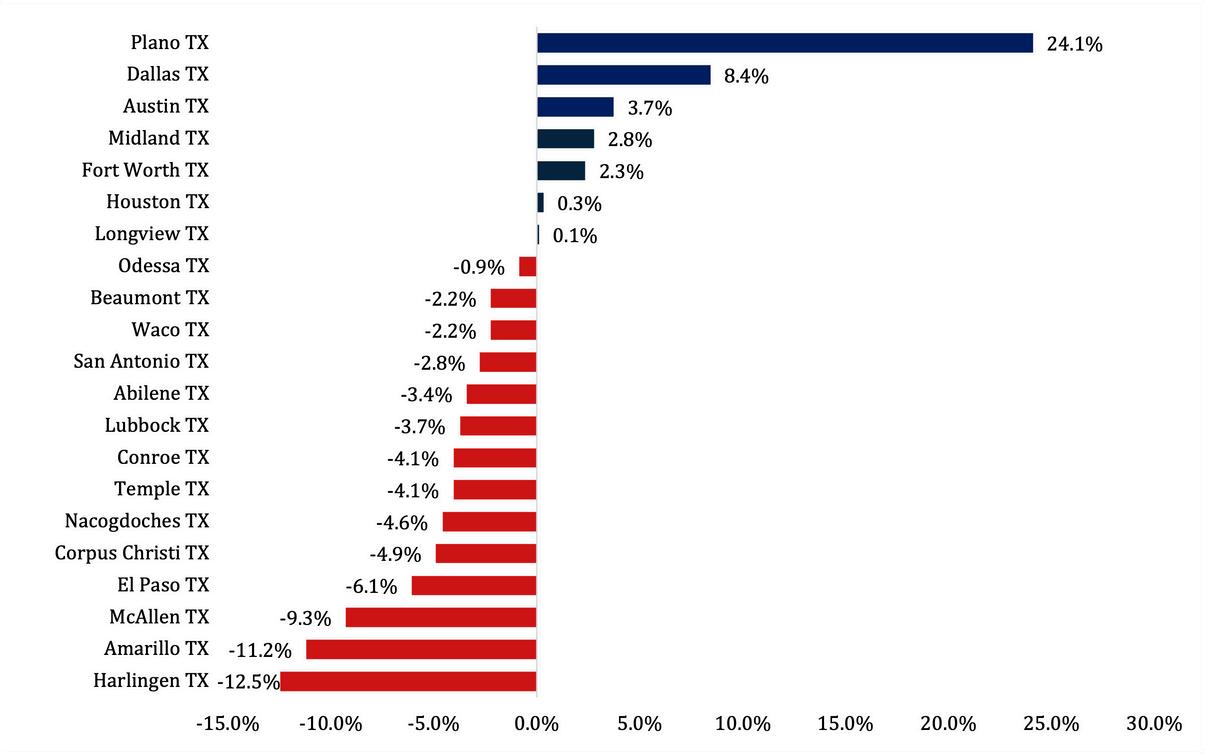
Among nearby East Texas metro areas, Longview’s cost of living is nearly identical to Tyler’s, just 0.1% higher. In contrast, living in Plano is 24% more expensive, while Harlingen and McAllen are 12.5% and 9.3% cheaper, respectively.
CostofLivingIndexRelativetoTyler,MSA
ThisindicatorcomparesthecostoflivingincertainmetroareasinTexasto Tyler'sMetropolitanStatisticalArea(MSA).Apositivepercentageindicateshow muchadditionalafter-taxincomeisrequiredtomaintainyourcurrentlifestyle, asinTyler Conversely,anegativepercentageindicateshowmuchmoneyyou couldpotentiallysaveonyouroverallexpensescomparedtoyourlifestyle expensesinTyler.

Hotel Occupancy Tax Revenue
Tyler MSA (in dollars)
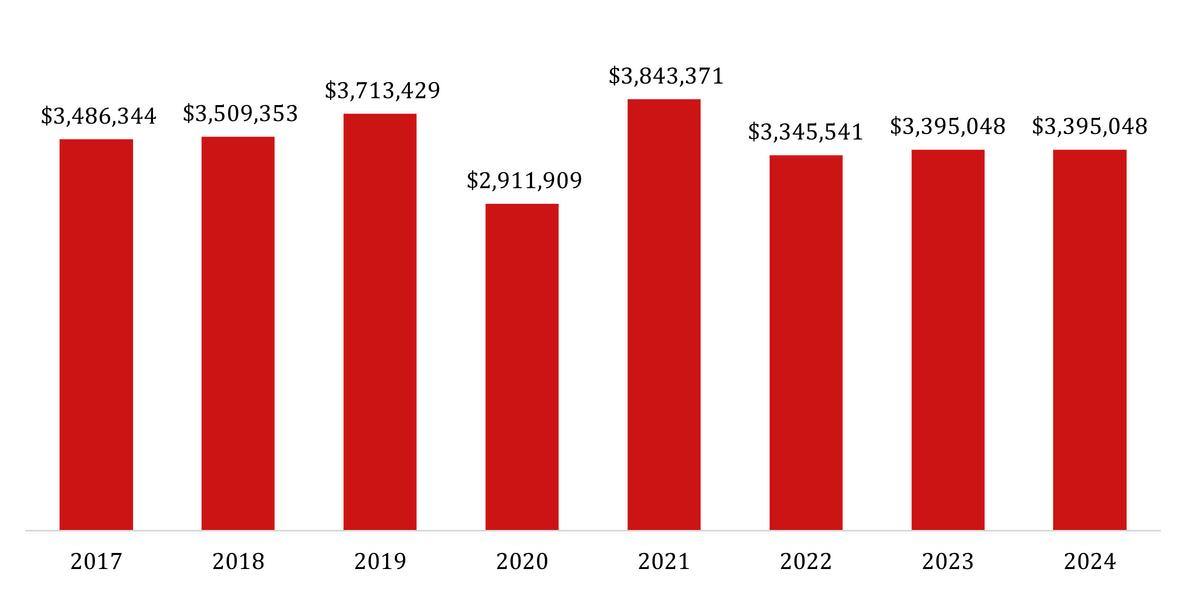
Hotel tax revenue in Tyler held steady at $3.4 million in 2024, while monthly sales tax collections reached a record high of $6 million in early 2025.
Monthly Sales Tax in Tyler City and Smith County
3-month moving average (March 2019 - April 2025)

Number
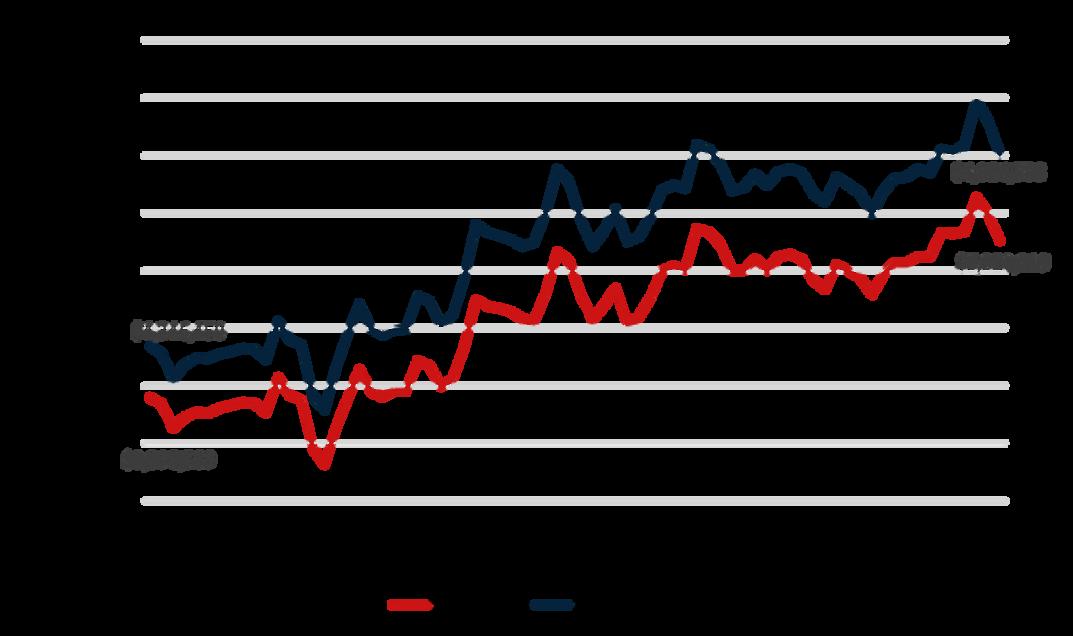
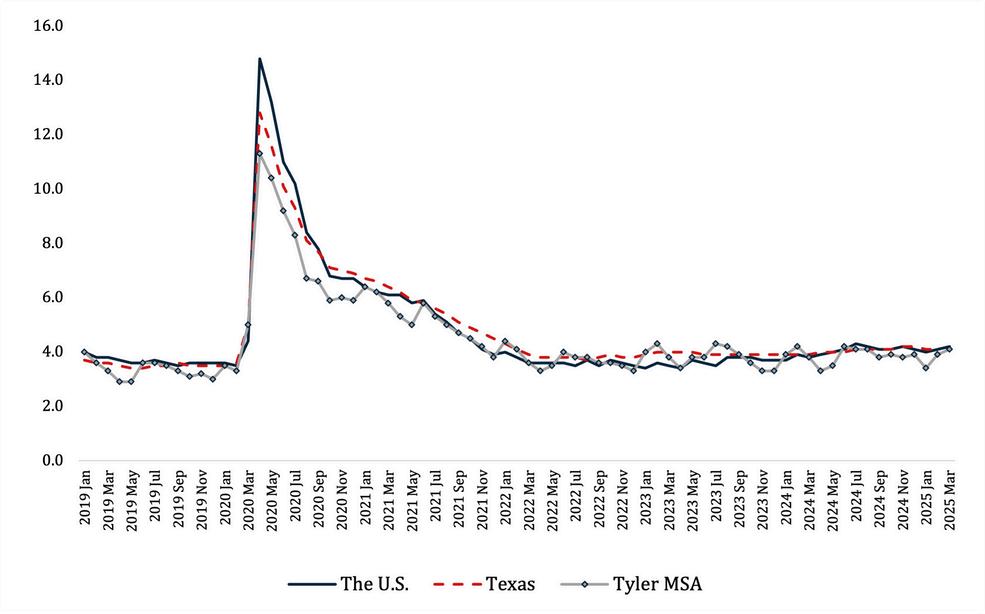
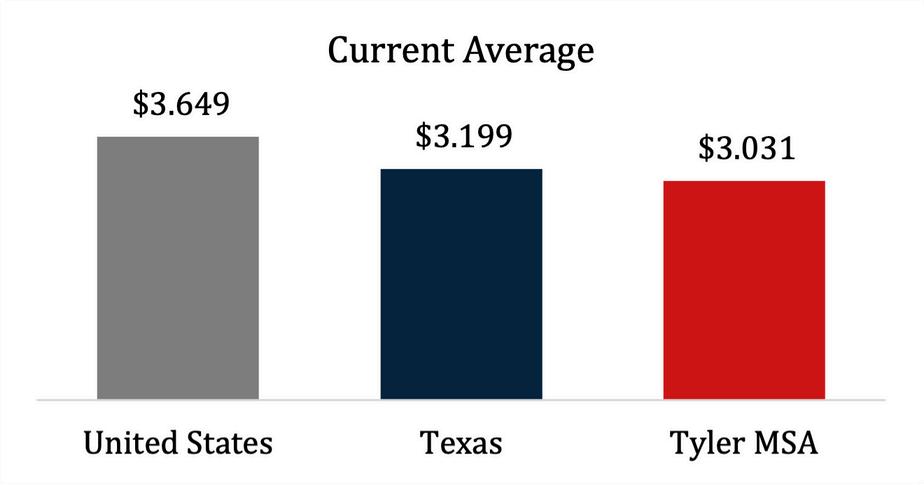
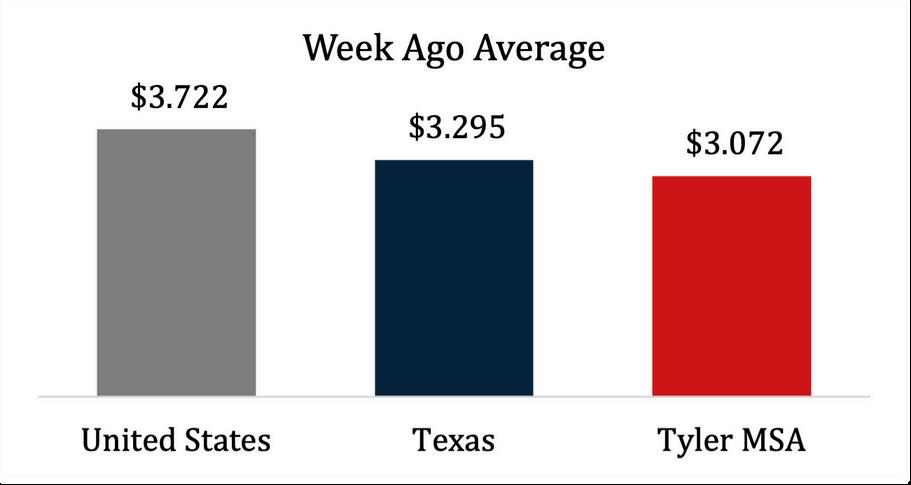
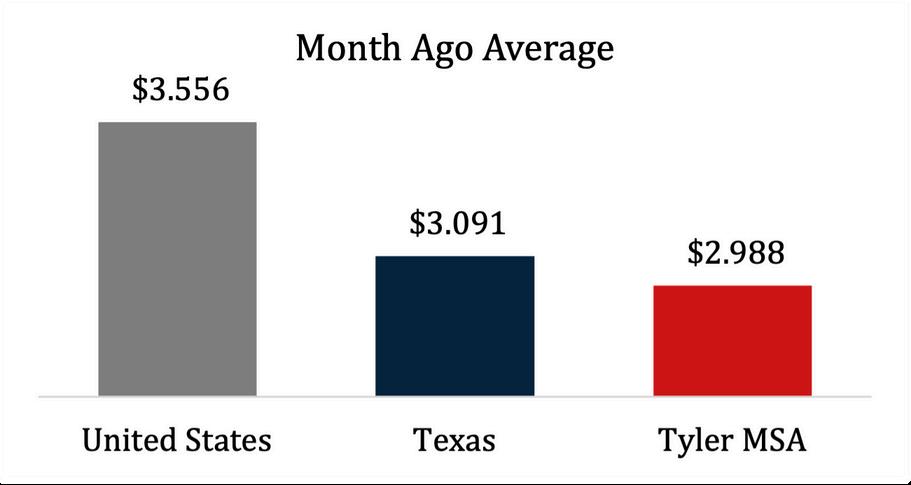
U.S. Mortgage Rates Weekly averages as of 04/10/2025
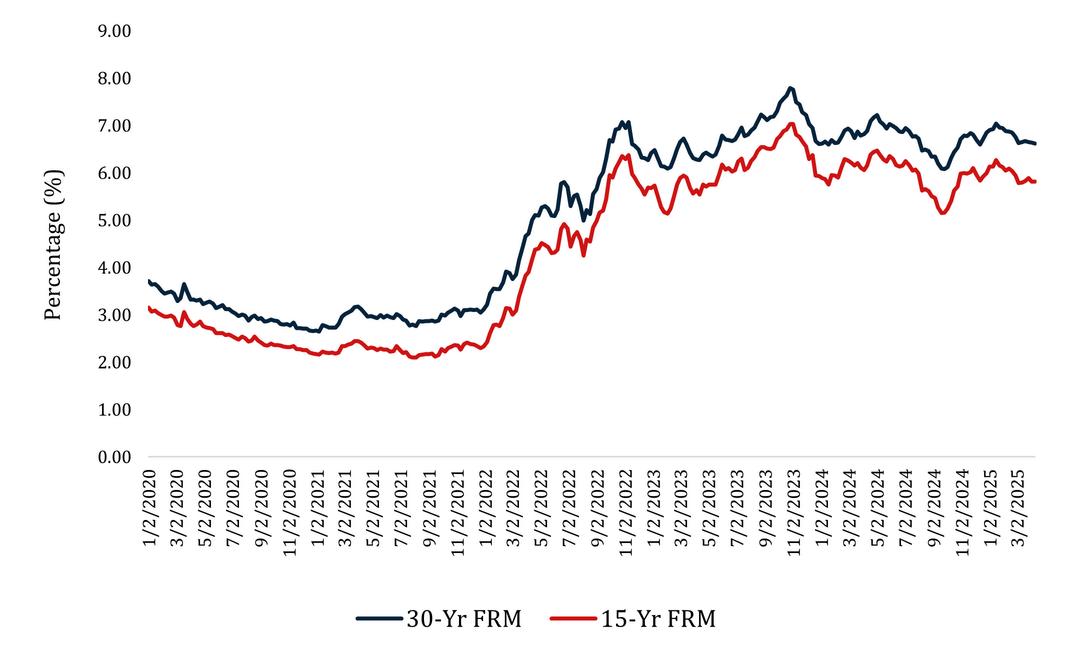
30-year mortgage rates climbed to 6.76%—more than twice their 2021 low—signaling continued affordability challenges for homebuyers.
Source: FreddieMac (05/01/2025) (01/07/2021) (07/29/2021) (10/26/2023) (10/26/2023)
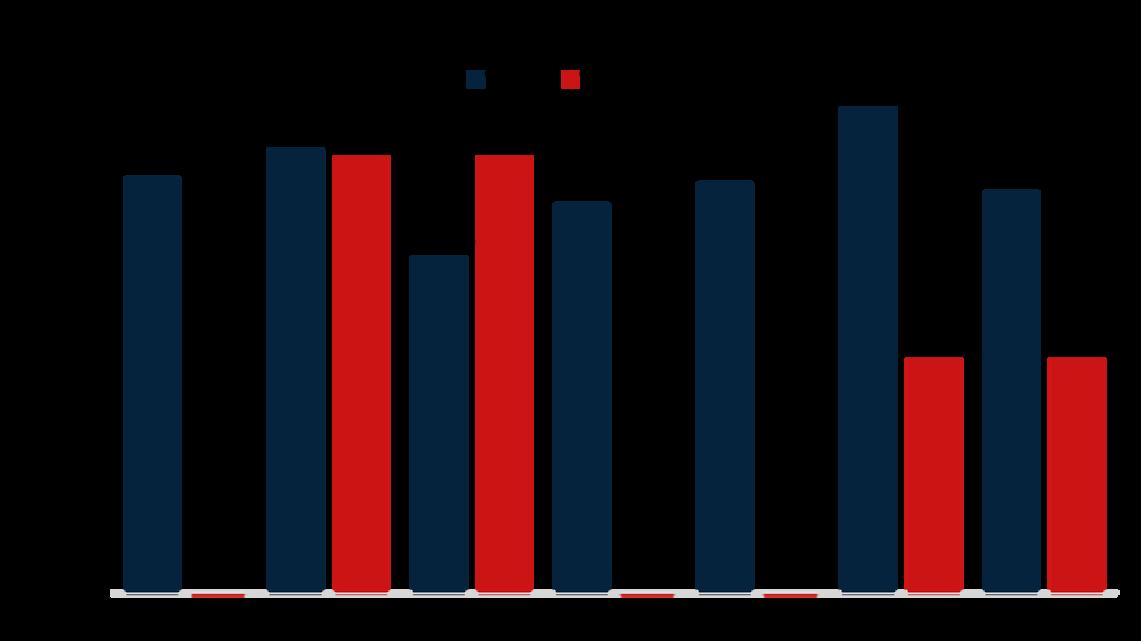
Building Permits by Type and Subtype
2021-2025 annual data in Tyler, TX
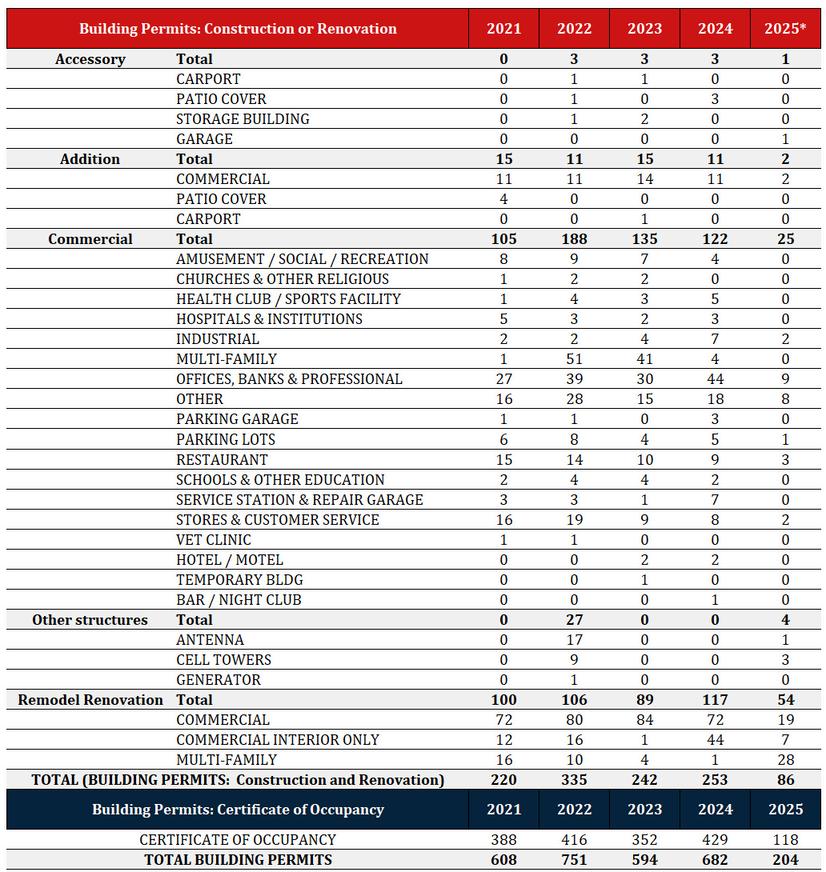
Since 2021, the City of Tyler has issued over 2,800 building permits, with more than half designated as Certificates of Occupancy. Among permits related to construction and renovation, commercial building permits accounted for approximately 20%.
Proportion of Commercial Building Permits in Tyler, TX by Subtype (2024)
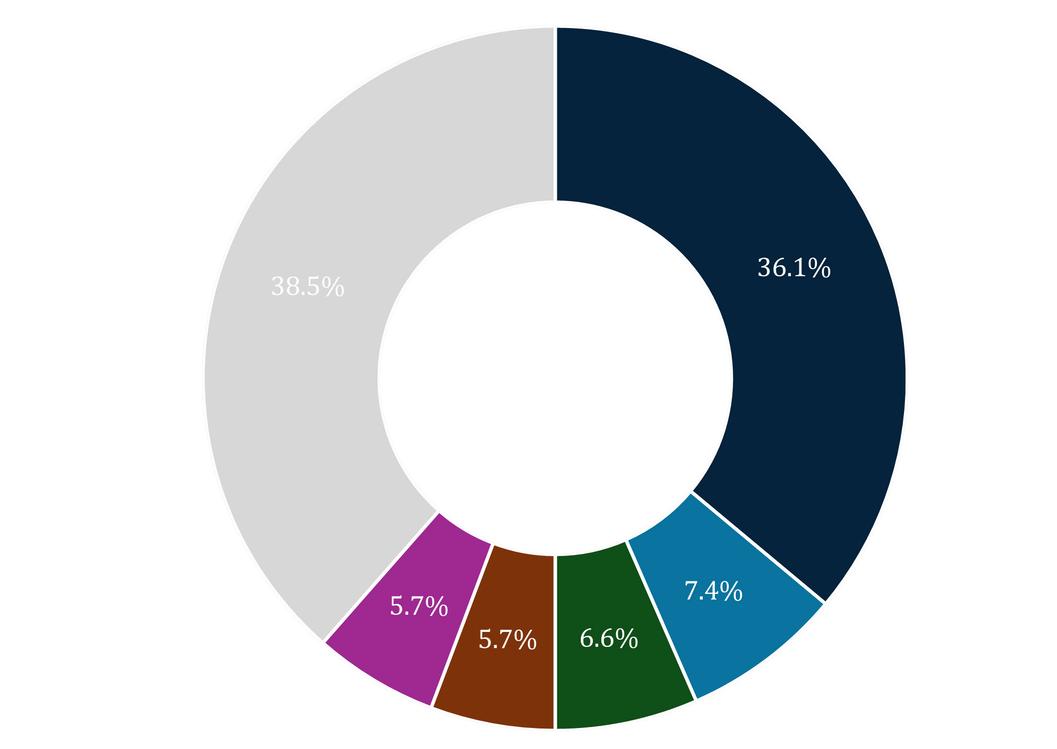
SERVICESTATION& REPAIRGARAGE
INDUSTRIAL
Total 122
OFFICES,BANKS& PROFESSIONAL
RESTAURANT
STORES&CUSTOMER SERVICE
Offices, Banks & Professional buildings accounted for more than one-third of all commercial permits in 2024, while subtypes such as restaurants and stores represented about 7% each.
Source:


A collaborative effort by the team:

President / CEO
Scott Martinez, CEcD
Senior Vice President, Economic Development
Mary Alice Guidry
https://tedc.org/
Acting Director and Senior Research Analyst
Manuel Reyes, D.E.D.
Junior Research Analyst
Cecilia Cuellar, Ph.D.
Research Assistant
Sara Maldonado
María Rodríguez
https://www.uttyler.edu/hibbs-institute/